Abstract
Strain elastography as used in EUS (EUS-real-time tissue elastography [RTE]) is a qualitative technique and provides information on the relative stiffness between one tissue and another. This article reviews the principles, technique, and interpretation of EUS-RTE in various organs. It includes information on how to optimize the technique as well as a discussion on pitfalls and artifacts. We also refer to the article describing RTE using conventional ultrasound transducers.
Keywords: EUS, real-time tissue elastography, ultrasound
INTRODUCTION
Strain imaging (“elastography”) is a new technique for tissue characterization, providing a noninvasive modality for imaging the mechanical properties of tissues. Inflammation and neoplastic infiltration lead to changes in normal tissue structure causing an alteration of its elasticity (harder or softer). The elasticity modulus is a measure of the “stress” applied to the tissue structures, relative to the “strain” or deformation produced, while the ultrasound (US) technique used is called real-time tissue elastography (RTE). This method measures compression-induced tissue deformation (strain) within a region of interest (ROI) which is visualized using a transparent color overlay on the B-mode image. The measurement algorithm is based on the extended combined autocorrelation method.[1] Elastography, as a study of tissue stiffness, can orient the diagnosis toward different pathological entities, based on their elastographic nature.[2]
One of the advantages of EUS elastography (EUS-RTE) is being able to better characterize lesions by the evaluation of tissue stiffness in various locations only accessible from the gastrointestinal (GI) tract. Elastography is not expected to replace biopsy but can be an adjunct to the EUS examinations, due to its ease of use, noninvasiveness, and low cost.[2,3,4]
EUS-RTE techniques offer greater sensitivity for deeper structures and better spatial resolution than manual palpation and have the potential for early-stage differentiation of benign and malignant tissue. In this paper, we describe applications of EUS-RTE, including how to optimize the technique. Pitfalls and artifacts are also discussed. Its application to the study of pancreas, GI tract, and lymph nodes is most studied.
STRAIN-BASED ELASTOGRAPHY – HOW DOES IT WORK?
Strain elastograms can be generated by palpation with the endoscope transducer or by holding the transducer still, allowing the internal physiological pulsations from cardiac or respiratory contractions to generate the strain. The latter is the mechanism used in EUS. However, since displacements are measured only in an axial direction, better results are generally obtained when a simple uniaxial stress is applied. Care must be taken in interpretation when using the tightly curved array transducer since the region immediately in front of the transducer face could be subjected to more stress than the lateral portions of the sector. In this case, narrowing the size of the elastography ROI sector will improve the uniformity of strain image [Figure 1].[5]
Figure 1.
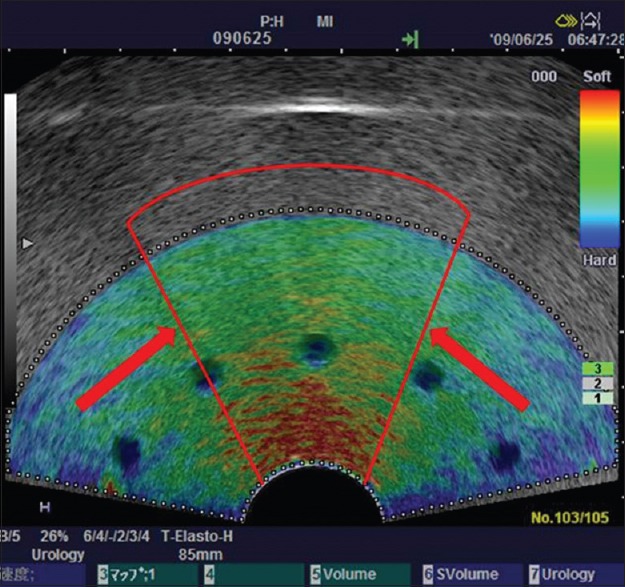
Reducing region of interest sector size to improve uniformity. Using a tightly curved array transducer to image this tissue-mimicking phantom, the material in front of the transducer face has been stressed more that the lateral margins resulting in a greater strain (red color) at the center of the sector, and less strain (blue color) induced at the lateral margins. Narrowing the sector size of the elastography region of interest (indicated by the red lines) will improve uniformity of the stress field. Using the smaller sector region of interest, the probe can be moved to interrogate the mid-portion and two lateral sector regions separately. Depth-dependent stress attenuation can also be observed in the central part in this phantom with homogeneous elasticity
In short, in US systems available for EUS-RTE, hard tissue (minor strain) is visualized by dark blue, whereas soft tissue (distinct strain) is visualized by red. As indicated by the color bar in EUS-RTE images, green and yellow are the representative for intermediate tissue elasticity [Figure 1]. The color map may be changed due to the individual preferences of an operator (see below, color map).
DESCRIPTION OF QUALITY PARAMETERS
Strain graph display and “press indicator”
The strain graph display provides feedback to a user on the degree and uniformity of his/her compression technique. The scale of “%strain” on the Y-axis and the amplitude and speed of movement should be adjusted so that a sine curve is described that remains between the recommended values 0.5% and 1.0%. Once in freeze mode, the strain graph can be used to guide selection of the most relevant frames for analysis, during the release of stress leading to tissue decompression [Figure 2a]. The “stress indicator” provides feedback to the operator in a different way. It gives an indication of the tissue displacement between consecutive US frames. A value of 3 or 4 indicates sufficient amplitude and speed of movement to give the desired contrast in strain within the ROI [Figure 2b]. This quality parameter has been replaced by the strain graph display in more recent versions; however, the press indicator may provide useful feedback when relying on physiological sources of stress to secure adequate strain in the ROI.
Figure 2.
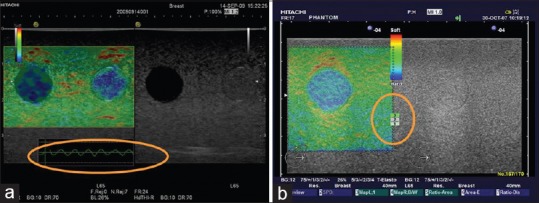
Quality parameters. (a) Strain graph display scale should be set to between 0.5% and 1.0%. (b) Press indicator: A value of 3 or 4 is recommended, but this feedback is now replaced by the strain graph display in recent versions of the software
“Knobology”
Adjustment of console controls
Reference frequency: Up and down toggle adjustment for high/low-frequency selection. As with the B-mode image, a higher frequency offers higher strain image resolution, but a lower frequency will offer a better stress penetration depth. In EUS-RTE, the lower frequency is normally the appropriate selection for the study of all but the smallest or most superficial lesions
Color blend: Rotary control around the periphery of the Elasto on/off knob. It controls the intensity of the color display and reduces the transparency of the color overlay. A semi-transparent setting (around 26%) will allow assessment of the spatial relationship between the strain map and the B-mode image. A higher, less transparent setting will give a stronger impression of the stiffness distribution.
Image menu adjustments
Frame reject is a filter that removes noisy, poor-quality frames from the elastography sequence (experienced when pre- and post-compression frames are not correlated because of movement of the scan plane or signals are too weak). Selecting a low value will allow more “noisy” frames, while a higher value may return fewer frames where the tissue stiffness is imaged.
Noise reject is a filter that removes noisy pixels within each frame (rejects regions where echo signal amplitude is not strong enough for correlation – e.g., within cysts or other hypoechoic areas). The rejected pixels are coded black. If no strain image is displayed, a reduction of noise reject may allow imaging at the cost of signal-to-noise ratio.
Persistence setting can be used in conjunction with the frame and noise rejection controls to improve image quality. Increasing the persistence prolongs the time each frame is displayed on the screen and provides an overlap between consecutive frames which creates a more stable, but less responsive color display (reduces “flashing”).
Density controls the line density. As with B-mode imaging, a lower line density will result in a higher frame rate with better temporal but lower spatial resolution, and vice versa. Increasing the line density usually increases elastogram resolution when imaging a small ROI in a tissue with little movement.
Frame rate provides additional control of frame rate with high, medium, and low selections. This allows the operator to adjust the frame rate of the elastography images to suit his/her compression speed and amplitude to achieve acceptable levels of strain between frames (which can be monitored from the strain graph display).
Color map: Elastograms are usually imaged as color maps superimposed on the B-mode image. Grayscale, single color, and rainbow color maps among others are available. Most users apply the default color map where red is soft, yellow and green intermediate, and blue hard; however, the color maps can be inverted, so careful investigation of the labels used for the displayed color bar is necessary for correct interpretation of the elastogram. The color map transparency relative to the B-mode image can be selected by adjusting the “blend” and is given on screen as a percentage.
E-Dyn (1–8) adjusts the dynamic range of the color map, E-Dyn = dynamic range for elastography image. The default value of 4 is most commonly used. With higher values, a larger proportion of the strains recorded will be imaged as green and only the more extreme strain values will be displayed as blue (hard) or red (soft). If the E-Dyn is reduced, a smaller amount of recorded strains are colored green, and the strain values are increasingly colored as blue or red.[6]
These strain imaging parameters are available in the HITACHI RTE version of elastography. They may not all be accessible to the examiner in all versions of EUS elastography. Similar versions of strain elastography are available in Aloka/Olympus scanners depending on the US unit used.
HOW TO USE REAL-TIME TISSUE ELASTOGRAPHY?
Region of interest size
RTE displays the relative stiffness of tissue, so it is important to include a sufficient quantity of normal or reference tissue surrounding the lesion of interest in the ROI. The best image quality was recorded in phantom experiments when the “lesion” of interest covered 25%–50% of the ROI.[6] In the case of a large lesion, the ROI can be placed toward the edge of the lesion so that surrounding normal tissue is included in the evaluation.
With the curved transducer of the EUS scope, the edges of the image sector are clipped in the dual display, so returning to a single, full-screen elastography image allows a wider ROI to be used and may improve the ratio of lesion to reference tissue in the ROI, particularly important when trying to image large pancreatic tumors.
Checking reproducibility
To assess the quality and reproducibility of the elastography image, the image can be frozen and the stored cine loop reviewed frame by frame. A consistent color pattern obtained in a number of consecutive frames indicates a good reliable technique.
Methods for assessment of tissue stiffness
Assessment and classification of lesions can be made based on the pattern of strain distribution within the ROI. Early EUS-RTE studies used a combination of color and color pattern homogeneity to differentiate benign and malignant lesions;[7,8] however, better results have been subsequently obtained when the strain ratio (SR), where the strain within the lesion is compared to normal reference tissue within the same ROI, or a strain histogram, which quantifies the distribution of strain values within the ROI, is obtained.
QUANTIFYING STRAIN DIFFERENCES - STRAIN RATIO, STRAIN HISTOGRAMS
Definition
SR is defined as:

SR is a tool used for quantifying relative tissue stiffness, normally used to measure the stiffness of a discrete mass lesion. With the assumption that the stress is uniformly distributed throughout the field of view, the strain in the ROI can be compared to an ROI in normal surrounding reference tissue that experiences similar stress. This semi-quantitative measurement is known as the SR (also known as fat-lesion ratio when applied to the breast). Havre et al. showed that the SR can provide reliable and reproducible results in a tissue-mimicking phantom and that best results were obtained when the reference tissue area was selected at a similar distance from the transducer as the ROI. In a homogeneous phantom material, the size of the reference tissue ROI did not influence the SR measurement significantly.[9] In a more inhomogeneous soft tissue in vivo, designating a small reference area is likely to cause selection bias; therefore, when possible, select a similar size ROI as that of the “lesion” but avoiding probable strain artifacts.
How to do it?
First, an ROI that best circumscribes a relevant area of the lesion (A) is selected and positioned. Second, the reference area (B) is sized and positioned over a relevant reference tissue that was subject to similar stress as the “lesion.” The mean strain of both these areas is expressed as a percentage (%) and the SR calculated as mean strain in reference (B) divided by mean strain in the “lesion” (A) as presented in Eq. (1) [Figures 3 and 4].
Figure 3.
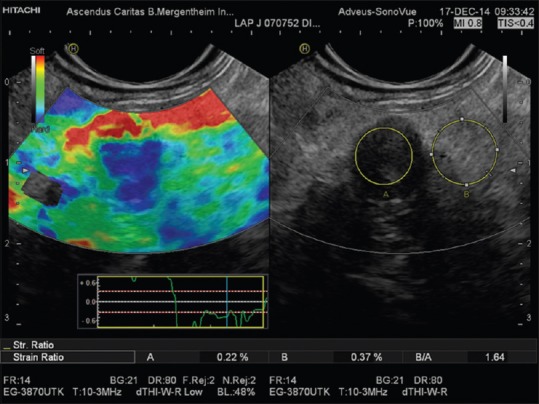
Strain ratio measurement as applied to the pancreas. Region of interest A is placed within the pancreatic mass and region of interest B in adjacent parenchyma or fat layer. Tissue-lesion ratio = B/A shown in a small solid and malignant pancreatic tumor
Figure 4.
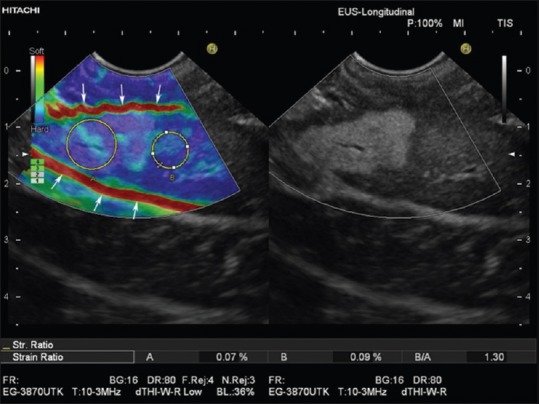
Real-time tissue elastography with strain ratio measurement as applied to the liver. Region of interest A is placed within the hyperechoic liver mass and region of interest B in adjacent liver parenchyma. The Strain ratio of 1.3 indicates nearly equal elasticity of the lesion (which turned out to be focal fatty infiltration) and surrounding “normal” liver tissue. Due to respiration-induced movements, both slipping boundaries between liver and peritoneal space show a high strain (red lines, arrows) and should not be used as a reference area for strain ratio measurements
Explanations
SR is calculated using the raw strain data. It is not affected by display parameters, which change the displayed colors in the elastogram. Thus, changing the E-Dyn of the elastogram may change the displayed colors but neither the strains recorded nor the SR
SR is a quantification method useful for comparing the difference in strains in different areas within the same ROI. Therefore, the choice of the reference area is crucial for the cutoff values used to differentiate between malignant and benign lesions. To compare the SR of focal lesions between patients, a similar protocol for selecting the reference tissue should be in place, e.g. normal parenchymal tissue or fat. As defined in the first study applying SR in EUS-RTE,[10] most authors use very small soft (red colored) reference areas between the lesion and the adjacent gastroduodenal wall as reference tissue. As explained below, this approach is prone to artifacts.
What to avoid?
Reference ROI should be positioned at similar distance from the transducer surface as the lesion[9] and not placed directly above or beneath the lesion as soft tissue will strain more when it is adjacent to hard tissue
Visible blood vessels should be avoided in the ROI as the movement of blood gives an artificial effect of large displacement or “softness”
Tissue boundaries that allow normal tissue movement, such as pleura, peritoneum, and bowel wall, should be avoided in the ROI as slippery boundaries between tissues may show high strain (red color) as well as low strain (blue coloring) beyond the boundary [Figure 4]
If the lesion shows a heterogeneous elastogram, as a general rule, the lesion ROI should include as much of the lesion as possible to measure the mean stiffness of the lesion. However, sometimes, the examiner must select a relevant section of the tumor as heterogenicity may be caused by necrosis and vessels or be due to inhomogeneous stress distribution. Therefore, the observer should interpret the elastogram.
Tips and tricks
The system can be set up to store the raw strain data with the image. This allows SR measurements on images that are retrieved from the hard disc at a later time. The elastography ROI can be re-sized on a frozen image. ROI A and B size and position can also be readjusted.
Histograms
Histogram analysis is typically used in diffuse diseases such as chronic hepatitis and pancreatitis, where the color pattern displayed in the elastogram is related to the fibrous structure caused by chronic disease. From this mosaic pattern, the distribution of recorded strains can be displayed as a histogram (Gaussian distribution curve) from which a number of statistical parameters can be derived for quantitative evaluation. The key parameters (features extracted from the strain image) are mean strain (MEAN); standard deviation (SD) of the mean; percentage of blue area (%AREA); and complexity of the blue areas (COMP) (relation between the circumference and the area of blue patches). The shape of the histogram described mathematically by skewness and kurtosis also reflects the distribution and tells us something about the homogeneity or otherwise of the tissue stiffness recorded [Figure 5].[11,12,13,14]
Figure 5.
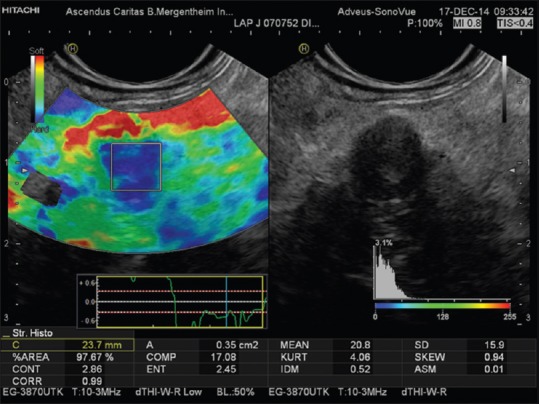
Histograms display the distribution of recorded strains (%) within an elastography region of interest of a small solid and malignant pancreatic tumor [same lesion as in Figure 3]
PANCREAS
The internal structure of the smoothly contoured normal pancreas is homogenously isoechoic as compared to the healthy liver parenchyma.[15,16,17,18] It has a reproducibly soft (homogenously green) elastogram in most cases. With increasing age, pancreatic tissue becomes significantly harder, but not approaching the tissue stiffness as measured using histogram analysis in patients with chronic pancreatitis.[19] In acute pancreatitis, the necrotic zones appear softer as compared to the stiffer surroundings. A small ductal adenocarcinoma shows an almost unequivocally very stiff pattern in comparison to the surrounding pancreatic parenchyma [Figures 3 and 5]. Ductal adenocarcinoma can be excluded with high accuracy when a predominantly soft (green) pattern is seen. The negative predictive value is >95%.[2] Stiffer neuroendocrine tumors compared to the pancreatic parenchyma are typical, especially if malignant; therefore, the positive predictive value is low. Chronic circumscript pancreatitis can be differentiated from ductal adenocarcinoma of the pancreas by a difference in the elastography appearance in most cases. The important results are based on semi-quantitative analysis, which has shown high strain for the average hue histograms in chronic pancreatitis as compared to pancreatic adenocarcinoma.[12,13] Early stages of autoimmune pancreatitis also show a characteristically diffuse stiff pattern in the whole pancreatic parenchyma, not just in the focal mass.[20] The combined approach using EUS elastography and contrast-enhanced EUS is of importance.[21,22] In patients with early stages of chronic pancreatitis, the honeycomb parenchymal pattern is also reflected in elastographic images [Figure 6]. Moreover, in chronic pancreatitis, histogram parameters and SR were shown to be closely correlated with a pathological fibrosis score,[23] number of B-mode criteria and diagnostic certainty,[24] and probability of pancreatic exocrine insufficiency. In pancreatic applications, quantitative elastography (SR, histogram analysis) may improve specificity compared with qualitative elastography.[25] For more examples, we refer to the EFSUMB website.[26]
Figure 6.
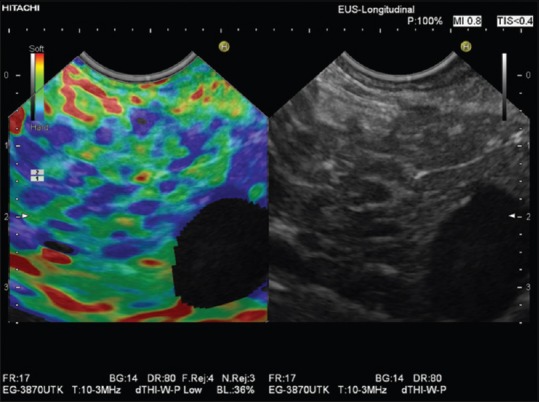
Elastographic honeycomb pattern in a patient with early chronic pancreatitis
LYMPH NODES
EUS-RTE has been shown to have high sensitivity and specificity for lymph node characterization [Figure 7][27] and has been used to improve nodal staging of upper GI malignancy.[28,29,30]
Figure 7.
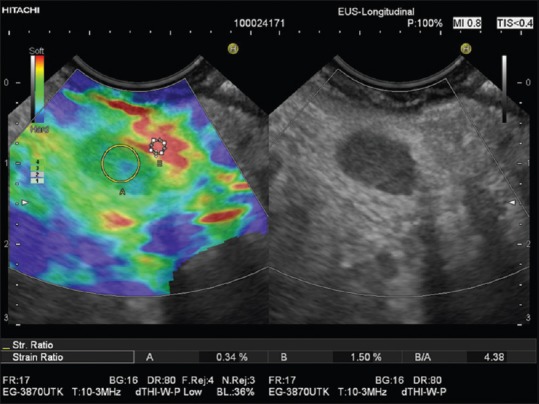
Reactive periduodenal lymph node (region of interest A). In comparison to the softest area available in the vicinity of the lymph node (region of interest B), a strain ratio of 4.4 was calculated
Sensitivity of EUS-FNA depends on the appropriate selection of the lymph node and targeting of the area of focal infiltration within the node for biopsy. EUS-RTE has the potential to further improve the accuracy of EUS-FNA by identifying the most suspicious lymph nodes for needle sampling. The lymph node architecture using elastography has not been studied in detail.[14,31,32,33,34,35,36] Endobronchial elastography has been introduced mainly for lymph node evaluation.[37,38]
SUBEPITHELIAL LESIONS
Subepithelial lesions are classified according to their location, size, echogenicity, and other criteria including EUS-RTE. For the prognosis, the most important question is whether a subepithelial lesion is benign or malignant. Small GI stromal tumor (GIST) typically shows a homogeneously stiff elastogram. Depending on their size and age, GIST may develop degenerative changes that result in anechoic or hyperechoic areas [Figure 7].[39] In lipoma, EUS-RTE often shows homogeneously softer tissue, but hard(er) lipoma may also occur.[40]
TUMOR STAGING
EUS-RTE in the upper and lower GI tract has facilitated tumor staging. The differentiation between stages T2 and T3 may be possible using EUS-RTE based on the assumption that acute inflammatory changes appear “softer” than the usually “harder” tumor images. However, elastography imaging of acute inflammation may also appear harder than surrounding tissue. Elastography has also proven to be useful in the discrimination between adenoma and adenocarcinoma of the rectum. For more information, we refer to recently published reviews.[32,33,35]
ELASTOGRAPHY-GUIDED BIOPSY
So far, the use of elastography-guided biopsy has not been evaluated in studies. We recommend this technique under circumstances when tumor stiffness might be different from surrounding parenchyma or tissue. As an example, this can be done to identify focal and stiffer malignant infiltration in lymph nodes by differentiated carcinoma, which tends to metastasize focally.[31,32,33,34,35,37,41,42] We use elastography always before biopsy as an “add-on” adjunctive tool since there is no negative impact but eventually additional value in targeting the needle.
OTHER APPLICATIONS
Publications describe the use of EUS elastography in many other applications, including anorectal applications in fecal incontinence.[43,44] For other applications, we refer to published guidelines[1,26,45,46,47,48,49,50,51,52,53,54,55] and comments on the guidelines.[56,57,58,59] Shear wave elastography has been established for the liver,[1,45,46,49,60] breast,[46,48] thyroid,[61,62,63] and prostate,[46,64] but this technique is not included in the current review.
CONCLUSION: BENEFITS AND LIMITATIONS OF STRAIN ELASTOGRAPHY IN CLINICAL APPLICATIONS
Strain-based elastography enables visualization and relative quantification of tissue stiffness in areas inaccessible to palpation. As a diagnostic tool, strain elastography has shown to be beneficial in evaluation of focal lesions in the breast, thyroid, lymph nodes, and pancreatic lesions. However, for many applications where the distinction between malignant and benign entity is of importance, consecutive series have shown that the specificity of the method is not satisfactory as a single modality. Several reports have concluded that strain elastography is most effectively used as an adjunct to B-mode US with Doppler or contrast-enhanced US.[46,65] Within a limited clinical scenario, such as colorectal adenoma and early carcinoma, the method has performed better than US and magnetic resonance imaging in diagnostic accuracy.[66]
Strain elastography is performed using the probe or internal tissue movements to calculate local strain. This strain is displayed as a color image. The main limitations of this method are that the applied stress is unknown, and therefore, the absolute value of the elasticity or Young's modulus of the tissue cannot be calculated. The method relies on an even distribution of stress over the ROI, but this is sometimes difficult to obtain in practice. Anisotropy of tissues in vivo can cause variable stress distributions and thus variable strains. The boundaries of tissue and the movement between organs also give challenges to this imaging method.
Financial support and sponsorship
Nil.
Conflicts of interest
Ellison Bibby is consultant for Hitachi Ltd, Healthcare Business Unit.
Acknowledgement
We kindly acknowledge the final reading from Julio Iglesias.
REFERENCES
- 1.Shiina T, Nightingale KR, Palmeri ML, et al. WFUMB guidelines and recommendations for clinical use of ultrasound elastography: Part 1: Basic principles and terminology. Ultrasound Med Biol. 2015;41:1126–47. doi: 10.1016/j.ultrasmedbio.2015.03.009. [DOI] [PubMed] [Google Scholar]
- 2.Dietrich CF, Cantisani V. Current status and perspectives of elastography. Eur J Radiol. 2014;83:403–4. doi: 10.1016/j.ejrad.2013.02.028. [DOI] [PubMed] [Google Scholar]
- 3.Dietrich CF. [Real Time Elastography. Indications not only in the gastrointestional tract] Endo heute. 2010;23:177–225. [Google Scholar]
- 4.Dietrich CF. Multiple clinical applications. Multiple clinical solutions. Endheu. 2012;24:177–225. [Google Scholar]
- 5.Bilgen M, Insana MF. Error analysis in acoustic elastography. II. Strain estimation and SNR analysis. J Acoust Soc Am. 1997;101:1147–54. doi: 10.1121/1.418019. [DOI] [PubMed] [Google Scholar]
- 6.Havre RF, Elde E, Gilja OH, et al. Freehand real-time elastography: Impact of scanning parameters on image quality and in vitro intra- and interobserver validations. Ultrasound Med Biol. 2008;34:1638–50. doi: 10.1016/j.ultrasmedbio.2008.03.009. [DOI] [PubMed] [Google Scholar]
- 7.Giovannini M, Thomas B, Erwan B, et al. Endoscopic ultrasound elastography for evaluation of lymph nodes and pancreatic masses: A multicenter study. World J Gastroenterol. 2009;15:1587–93. doi: 10.3748/wjg.15.1587. [DOI] [PMC free article] [PubMed] [Google Scholar]
- 8.Janssen J, Dietrich CF, Will U, et al. Endosonographic elastography in the diagnosis of mediastinal lymph nodes. Endoscopy. 2007;39:952–7. doi: 10.1055/s-2007-966946. [DOI] [PubMed] [Google Scholar]
- 9.Havre RF, Waage JR, Gilja OH, et al. Real-time elastography: Strain ratio measurements are influenced by the position of the reference area. Ultraschall Med. 2011 doi: 10.1055/s-0031-1273247. Epub ahead of print. [DOI] [PubMed] [Google Scholar]
- 10.Iglesias-Garcia J, Larino-Noia J, Abdulkader I, et al. Quantitative endoscopic ultrasound elastography: An accurate method for the differentiation of solid pancreatic masses. Gastroenterology. 2010;139:1172–80. doi: 10.1053/j.gastro.2010.06.059. [DOI] [PubMed] [Google Scholar]
- 11.Taylor K, O’Keeffe S, Britton PD, et al. Ultrasound elastography as an adjuvant to conventional ultrasound in the preoperative assessment of axillary lymph nodes in suspected breast cancer: A pilot study. Clin Radiol. 2011;66:1064–71. doi: 10.1016/j.crad.2011.05.015. [DOI] [PubMed] [Google Scholar]
- 12.Săftoiu A, Vilmann P, Gorunescu F, et al. Accuracy of endoscopic ultrasound elastography used for differential diagnosis of focal pancreatic masses: A multicenter study. Endoscopy. 2011;43:596–603. doi: 10.1055/s-0030-1256314. [DOI] [PubMed] [Google Scholar]
- 13.Săftoiu A, Vilmann P, Gorunescu F, et al. Efficacy of an artificial neural network-based approach to endoscopic ultrasound elastography in diagnosis of focal pancreatic masses. Clin Gastroenterol Hepatol. 2012;10:84–90.e1. doi: 10.1016/j.cgh.2011.09.014. [DOI] [PubMed] [Google Scholar]
- 14.Cui XW, Jenssen C, Saftoiu A, et al. New ultrasound techniques for lymph node evaluation. World J Gastroenterol. 2013;19:4850–60. doi: 10.3748/wjg.v19.i30.4850. [DOI] [PMC free article] [PubMed] [Google Scholar]
- 15.Dietrich CF, Dong Y. Shear wave elastography with a new reliability indicator. J Ultrason. 2016;16:281–7. doi: 10.15557/JoU.2016.0028. [DOI] [PMC free article] [PubMed] [Google Scholar]
- 16.De Molo C, Cui XW, Pirri C, et al. Pancreas mobile. Z Gastroenterol. 2013;51:1165–70. doi: 10.1055/s-0033-1335185. [DOI] [PubMed] [Google Scholar]
- 17.Pirri C, Cui XW, De Molo C, et al. The pancreatic head is larger than often assumed. Z Gastroenterol. 2013;51:390–4. doi: 10.1055/s-0033-1335175. [DOI] [PubMed] [Google Scholar]
- 18.Tuma J, Jenssen C, Möller K, et al. Ultrasound artifacts and their diagnostic significance in internal medicine and gastroenterology - Part 1: B-mode artifacts. Z Gastroenterol. 2016;54:433–50. doi: 10.1055/s-0042-103247. [DOI] [PubMed] [Google Scholar]
- 19.Janssen J, Papavassiliou I. Effect of aging and diffuse chronic pancreatitis on pancreas elasticity evaluated using semiquantitative EUS elastography. Ultraschall Med. 2014;35:253–8. doi: 10.1055/s-0033-1355767. [DOI] [PubMed] [Google Scholar]
- 20.Dietrich CF, Hirche TO, Ott M, et al. Real-time tissue elastography in the diagnosis of autoimmune pancreatitis. Endoscopy. 2009;41:718–20. doi: 10.1055/s-0029-1214866. [DOI] [PubMed] [Google Scholar]
- 21.Dietrich CF, Sahai AV, D’Onofrio M, et al. Differential diagnosis of small solid pancreatic lesions. Gastrointest Endosc. 2016;84:933–40. doi: 10.1016/j.gie.2016.04.034. [DOI] [PubMed] [Google Scholar]
- 22.Cui XW, Pirri C, Ignee A, et al. Measurement of shear wave velocity using acoustic radiation force impulse imaging is not hampered by previous use of ultrasound contrast agents. Z Gastroenterol. 2014;52:649–53. doi: 10.1055/s-0034-1366036. [DOI] [PubMed] [Google Scholar]
- 23.Itoh Y, Itoh A, Kawashima H, et al. Quantitative analysis of diagnosing pancreatic fibrosis using EUS-elastography (comparison with surgical specimens) J Gastroenterol. 2014;49:1183–92. doi: 10.1007/s00535-013-0880-4. [DOI] [PubMed] [Google Scholar]
- 24.Iglesias-Garcia J, Domínguez-Muñoz JE, Castiñeira-Alvariño M, et al. Quantitative elastography associated with endoscopic ultrasound for the diagnosis of chronic pancreatitis. Endoscopy. 2013;45:781–8. doi: 10.1055/s-0033-1344614. [DOI] [PubMed] [Google Scholar]
- 25.Ying L, Lin X, Xie ZL, et al. Clinical utility of endoscopic ultrasound elastography for identification of malignant pancreatic masses: A meta-analysis. J Gastroenterol Hepatol. 2013;28:1434–43. doi: 10.1111/jgh.12292. [DOI] [PubMed] [Google Scholar]
- 26.Dietrich CF, Rudd L, Saftiou A, et al. The EFSUMB website, a great source for ultrasound information and education. Med Ultrason. 2017;19:102–10. doi: 10.11152/mu-938. [DOI] [PubMed] [Google Scholar]
- 27.Xu W, Shi J, Zeng X, et al. EUS elastography for the differentiation of benign and malignant lymph nodes: A meta-analysis. Gastrointest Endosc. 2011;74:1001–9. doi: 10.1016/j.gie.2011.07.026. [DOI] [PubMed] [Google Scholar]
- 28.Paterson S, Duthie F, Stanley AJ. Endoscopic ultrasound-guided elastography in the nodal staging of oesophageal cancer. World J Gastroenterol. 2012;18:889–95. doi: 10.3748/wjg.v18.i9.889. [DOI] [PMC free article] [PubMed] [Google Scholar]
- 29.Knabe M, Günter E, Ell C, et al. Can EUS elastography improve lymph node staging in esophageal cancer? Surg Endosc. 2013;27:1196–202. doi: 10.1007/s00464-012-2575-y. [DOI] [PubMed] [Google Scholar]
- 30.Sazuka T, Akai T, Uesato M, et al. Assessment for diagnosis of lymph node metastasis in esophageal cancer using endoscopic ultrasound elastography. Esophagus. 2016;13:254–63. doi: 10.1007/s10388-016-0521-0. [DOI] [PMC free article] [PubMed] [Google Scholar]
- 31.Cui XW, Hocke M, Jenssen C, et al. Conventional ultrasound for lymph node evaluation, update 2013. Z Gastroenterol. 2014;52:212–21. doi: 10.1055/s-0033-1356153. [DOI] [PubMed] [Google Scholar]
- 32.Cui XW, Chang JM, Kan QC, et al. Endoscopic ultrasound elastography: Current status and future perspectives. World J Gastroenterol. 2015;21:13212–24. doi: 10.3748/wjg.v21.i47.13212. [DOI] [PMC free article] [PubMed] [Google Scholar]
- 33.Dietrich CF, Jenssen C, Arcidiacono PG, et al. Endoscopic ultrasound: Elastographic lymph node evaluation. Endosc Ultrasound. 2015;4:176–90. doi: 10.4103/2303-9027.162995. [DOI] [PMC free article] [PubMed] [Google Scholar]
- 34.Chiorean L, Barr RG, Braden B, et al. Transcutaneous ultrasound: Elastographic lymph node evaluation. Current clinical applications and literature review. Ultrasound Med Biol. 2016;42:16–30. doi: 10.1016/j.ultrasmedbio.2015.09.005. [DOI] [PubMed] [Google Scholar]
- 35.Chiorean L, Cui XW, Klein SA, et al. Clinical value of imaging for lymph nodes evaluation with particular emphasis on ultrasonography. Z Gastroenterol. 2016;54:774–90. doi: 10.1055/s-0042-108656. [DOI] [PubMed] [Google Scholar]
- 36.Okasha HH, Mansour M, Attia KA, et al. Role of high resolution ultrasound/endosonography and elastography in predicting lymph node malignancy. Endosc Ultrasound. 2014;3:58–62. doi: 10.4103/2303-9027.121252. [DOI] [PMC free article] [PubMed] [Google Scholar]
- 37.Dietrich CF, Jenssen C, Herth FJ. Endobronchial ultrasound elastography. Endosc Ultrasound. 2016;5:233–8. doi: 10.4103/2303-9027.187866. [DOI] [PMC free article] [PubMed] [Google Scholar]
- 38.Rozman A, Malovrh MM, Adamic K, et al. Endobronchial ultrasound elastography strain ratio for mediastinal lymph node diagnosis. Radiol Oncol. 2015;49:334–40. doi: 10.1515/raon-2015-0020. [DOI] [PMC free article] [PubMed] [Google Scholar]
- 39.Ignee A, Jenssen C, Hocke M, et al. Contrast-enhanced (endoscopic) ultrasound and endoscopic ultrasound elastography in gastrointestinal stromal tumors. Endosc Ultrasound. 2017;6:55–60. doi: 10.4103/2303-9027.200216. [DOI] [PMC free article] [PubMed] [Google Scholar]
- 40.Dietrich CF, Jenssen C, Hocke M, et al. Imaging of gastrointestinal stromal tumours with modern ultrasound techniques - A pictorial essay. Z Gastroenterol. 2012;50:457–67. doi: 10.1055/s-0031-1282076. [DOI] [PubMed] [Google Scholar]
- 41.Havre RF, Leh SM, Gilja OH, et al. Differentiation of metastatic and non-metastatic mesenteric lymph nodes by strain elastography in surgical specimens. Ultraschall Med. 2016;37:366–72. doi: 10.1055/s-0041-107975. [DOI] [PubMed] [Google Scholar]
- 42.Dietrich CF, Hocke M, Jenssen C. Ultrasound for abdominal lymphadenopathy. Dtsch Med Wochenschr. 2013;138:1001–18. doi: 10.1055/s-0032-1333027. [DOI] [PubMed] [Google Scholar]
- 43.Allgayer H, Ignee A, Dietrich CF. Endosonographic elastography of the anal sphincter in patients with fecal incontinence. Scand J Gastroenterol. 2010;45:30–8. doi: 10.3109/00365520903383251. [DOI] [PubMed] [Google Scholar]
- 44.Allgayer H, Ignee A, Zipse S, et al. Endorectal ultrasound and real-time elastography in patients with fecal incontinence following anorectal surgery: A prospective comparison evaluating short- and long-term outcomes in irradiated and non-irradiated patients. Z Gastroenterol. 2012;50:1281–6. doi: 10.1055/s-0032-1313000. [DOI] [PubMed] [Google Scholar]
- 45.Bamber J, Cosgrove D, Dietrich CF, et al. EFSUMB guidelines and recommendations on the clinical use of ultrasound elastography. Part 1: Basic principles and technology. Ultraschall Med. 2013;34:169–84. doi: 10.1055/s-0033-1335205. [DOI] [PubMed] [Google Scholar]
- 46.Cosgrove D, Piscaglia F, Bamber J, et al. EFSUMB guidelines and recommendations on the clinical use of ultrasound elastography. Part 2: Clinical applications. Ultraschall Med. 2013;34:238–53. doi: 10.1055/s-0033-1335375. [DOI] [PubMed] [Google Scholar]
- 47.Dietrich CF, Rudd L. The EFSUMB website, a guide for better understanding. Med Ultrason. 2013;15:215–23. doi: 10.11152/mu.2013.2066.153.cfd1lr2. [DOI] [PubMed] [Google Scholar]
- 48.Barr RG, Nakashima K, Amy D, et al. WFUMB guidelines and recommendations for clinical use of ultrasound elastography: Part 2: Breast. Ultrasound Med Biol. 2015;41:1148–60. doi: 10.1016/j.ultrasmedbio.2015.03.008. [DOI] [PubMed] [Google Scholar]
- 49.Ferraioli G, Filice C, Castera L, et al. WFUMB guidelines and recommendations for clinical use of ultrasound elastography: Part 3: Liver. Ultrasound Med Biol. 2015;41:1161–79. doi: 10.1016/j.ultrasmedbio.2015.03.007. [DOI] [PubMed] [Google Scholar]
- 50.Cosgrove D, Barr R, Bojunga J, et al. WFUMB guidelines and recommendations on the clinical use of ultrasound elastography: Part 4.thyroid. Ultrasound Med Biol. 2017;43:4–26. doi: 10.1016/j.ultrasmedbio.2016.06.022. [DOI] [PubMed] [Google Scholar]
- 51.Barr RG, Cosgrove D, Brock M, et al. WFUMB Guidelines and recommendations on the clinical use of ultrasound elastography: Part 5.prostate. Ultrasound Med Biol. 2017;43:27–48. doi: 10.1016/j.ultrasmedbio.2016.06.020. [DOI] [PubMed] [Google Scholar]
- 52.Jenssen C, Hocke M, Fusaroli P, et al. EFSUMB guidelines on interventional ultrasound (INVUS), part IV - EUS-guided interventions: General aspects and EUS-guided sampling (Long version) Ultraschall Med. 2016;37:E33–76. doi: 10.1055/s-0035-1553785. [DOI] [PubMed] [Google Scholar]
- 53.Jenssen C, Hocke M, Fusaroli P, et al. EFSUMB guidelines on interventional ultrasound (INVUS), part IV - EUS-guided interventions: General aspects and EUS-guided sampling (Short version) Ultraschall Med. 2016;37:157–69. doi: 10.1055/s-0035-1553788. [DOI] [PubMed] [Google Scholar]
- 54.Fusaroli P, Jenssen C, Hocke M, et al. EFSUMB guidelines on interventional ultrasound (INVUS), part V - EUS-guided therapeutic interventions (short version) Ultraschall Med. 2016;37:412–20. doi: 10.1055/s-0035-1553742. [DOI] [PubMed] [Google Scholar]
- 55.Fusaroli P, Jenssen C, Hocke M, et al. EFSUMB Guidelines on Interventional Ultrasound (INVUS), Part V - EUS-guided therapeutic interventions (short version) Ultraschall Med. 2016;37:412–20. doi: 10.1055/s-0035-1553742. [DOI] [PubMed] [Google Scholar]
- 56.Dietrich CF, Horn R, Morf S, et al. Ultrasound-guided central vascular interventions, comments on the European Federation of Societies for Ultrasound in Medicine and Biology guidelines on interventional ultrasound. J Thorac Dis. 2016;8:E851–68. doi: 10.21037/jtd.2016.08.49. [DOI] [PMC free article] [PubMed] [Google Scholar]
- 57.Dietrich CF, Horn R, Morf S, et al. US-guided peripheral vascular interventions, comments on the EFSUMB guidelines. Med Ultrason. 2016;18:231–9. doi: 10.11152/mu.2013.2066.182.umb. [DOI] [PubMed] [Google Scholar]
- 58.Mohaupt MG, Arampatzis S, Atkinson N, et al. Comments and extensions to EFSUMB guidelines on renal interventional ultrasound (INVUS) Med Ultrason. 2016;18:351–61. doi: 10.11152/mu.2013.2066.183.moh. [DOI] [PubMed] [Google Scholar]
- 59.Dietrich CF, Chiorean L, Potthoff A, et al. Percutaneous sclerotherapy of liver and renal cysts, comments on the EFSUMB guidelines. Z Gastroenterol. 2016;54:155–66. doi: 10.1055/s-0041-106594. [DOI] [PubMed] [Google Scholar]
- 60.Dong Y, Sirli R, Ferraioli G, et al. Shear wave elastography of the liver - Review on normal values. Z Gastroenterol. 2017;55:153–66. doi: 10.1055/s-0042-117226. [DOI] [PubMed] [Google Scholar]
- 61.Dighe M, Barr R, Bojunga J, et al. Thyroid ultrasound: State of the art part 1 - thyroid ultrasound reporting and diffuse thyroid diseases. Med Ultrason. 2017;19:79–93. doi: 10.11152/mu-980. [DOI] [PubMed] [Google Scholar]
- 62.Cosgrove D, Barr R, Bojunga J, et al. WFUMB guidelines and recommendations on the clinical use of ultrasound elastography: Part 4.thyroid. Ultrasound Med Biol. 2017;43:4–26. doi: 10.1016/j.ultrasmedbio.2016.06.022. [DOI] [PubMed] [Google Scholar]
- 63.Dietrich CF, Bojunga J. Ultrasound of the thyroid. Laryngorhinootologie. 2016;95:87–104. doi: 10.1055/s-0041-111275. [DOI] [PubMed] [Google Scholar]
- 64.Barr RG, Cosgrove D, Brock M, et al. WFUMB guidelines and recommendations on the clinical use of ultrasound elastography: Part 5.prostate. Ultrasound Med Biol. 2017;43:27–48. doi: 10.1016/j.ultrasmedbio.2016.06.020. [DOI] [PubMed] [Google Scholar]
- 65.Havre RF, Ødegaard S, Gilja OH, et al. Characterization of solid focal pancreatic lesions using endoscopic ultrasonography with real-time elastography. Scand J Gastroenterol. 2014;49:742–51. doi: 10.3109/00365521.2014.905627. [DOI] [PubMed] [Google Scholar]
- 66.Waage JE, Leh S, Røsler C, et al. Endorectal ultrasonography, strain elastography and MRI differentiation of rectal adenomas and adenocarcinomas. Colorectal Dis. 2015;17:124–31. doi: 10.1111/codi.12845. [DOI] [PMC free article] [PubMed] [Google Scholar]


