Abstract
Photoacoustic microscopy (PAM) with ultraviolet (UV) laser illumination has recently been demonstrated as a promising tool that provides fast, label-free, and multilayered histologic imaging of human breast tissue. Thus far, the axial resolution has been determined ultrasonically. To enable optically defined axial resolution, we exploit the Grüneisen relaxation (GR) effect. By imaging mouse brain slices, we show that GRUV-PAM reveals detailed information about three-dimensional cell nuclear distributions and internal structures, which are important diagnostic features for cancers. Due to the nonlinear effect, GRUV-PAM also provides better contrast in images of cell nuclei.
Introduction
Photoacoustic (PA) tomography (PAT) has been demonstrated as a powerful tool in biomedicine, offering multi-scale imaging capability while providing rich optical absorption contrast [1–4]. The absorption coefficient is an endogenous biomarker of various biological components in tissue. When tissue is irradiated by a short-pulsed laser, the absorption of the incident photons thermo-elastically generates wide-band ultrasonic waves, which can be detected by an ultrasonic transducer for image reconstruction. Because biomolecules all absorb differently at different wavelengths, PAT can selectively image different biomolecules with illumination laser wavelengths properly chosen according to the biomolecules’ absorption spectra. Among PAT implementations, optical-resolution photoacoustic microscopy (OR-PAM) achieves the highest resolution by tightly focusing the illumination region with a diffraction-limited light spot. OR-PAM has been used to image cell nuclei [5], cytoplasm [6], blood vessels [7], and organelles [8]. Depending on the specific absorption of DNA/RNA molecules, using ultraviolet (UV) exposure with OR-PAM is highly efficient for label-free cell nuclear imaging. The short wavelength of UV light allows focusing to a small light spot, providing subcellular resolution to reveal the morphological information of individual cell nuclei, which is significant for cancer diagnosis [9–12]. Recently, histology-like multilayered imaging achieved by UV OR-PAM has been reported [13, 14], which could enable fast and label-free intraoperative margin assessment. However, similar to other conventional OR-PAM techniques, the axial resolution in the reported works is acoustically determined, limited by the acoustic bandwidth of the detected PA signal [15]. So far, the sectioning ability of conventional OR-PAM is insufficient to separate signals from different cell layers within one axial acoustic pixel, which decreases the contrast for cell nuclear visualization. To improve the axial resolution using optical sectioning, nonlinear effects can be utilized, such as two-photon absorption [16] and the Grüneisen relaxation (GR) effect [17–20]. The Grüneisen parameter of a material relates the thermally induced initial pressure to the thermal energy deposition. As the Grüneisen parameter is temperature dependent, it can be altered by transient light absorption and then relaxed to its baseline value over time (e.g., <1 μs), which is called the GR effect. In this Letter, we demonstrate that the GR effect can be combined with UV OR-PAM, and we achieve label-free optically sectioned images of cell nuclei, revealing their precise distribution in three dimensions, and even their internal structures in a cross-section. Moreover, compared with conventional linear UV OR-PAM (LUV-PAM) images, GRUV-PAM not only greatly improves the sectioning ability, but also enhances the contrast between cell nuclei and their background (which comes from other absorbers such as cytoplasm or out-of-focus cell nuclei). This work will be important for further improving the performance of the UV-PAM system for histologic imaging. The revealed internal structures in cell nuclei are vital features for making accurate diagnoses.
Mechanism
In GR-PAM, a pre-heating laser pulse is fired before the main PA excitation pulse to obtain nonlinear PA signals [20]. The pre-heating laser can be either a pulsed laser or a continuously working laser with a brief on period, and it is coaxially focused at the same lateral position as the main laser for PA excitation. The pre-heating increases the Grüneisen parameter of the irradiated sample, which is a factor that affects the subsequently excited PA amplitude. The increased Grüneisen parameter can be expressed by [20, 21]:
| (1) |
where Γ0 is the original Grüneisen parameter at the baseline temperature; k is a linear factor relating the increase of the Grüneisen parameter and the absorbed energy; η is the heat conversion efficiency; μa is the optical absorption coefficient of the sample; F1 is the optical fluence of the pre-heating laser; and Δ is the thermal relaxation time, which is on the order of microseconds for the targeted spatial resolution.
The PA amplitude, from a planer absorber which has a lateral dimension greater than the optical focal diameter, caused by the sequential laser pulse F2 can be calculated by the following integration over the lateral plane [20, 21]:
| (2) |
where P0 is the standard PA amplitude without pre-heating.
In GR-PAM, the nonlinear PA signals can be extracted by subtracting the PA signals without heating from the PA signals with heating. If F1 and F2 have the same spatial distribution but differ only in intensity by a constant factor theta, i.e., F1 = θF2, the nonlinear PA signals, termed GR signals (PGR), can be computed by:
| (3) |
The GR signal is proportional to ∫∫F22 ds, which is no longer invariant with depth. Instead, it decays when absorbers are axially moved away from the optical focus. But in conventional OR-PAM, the PA signal stimulated by F2 is proportional to ∫∫F2ds, which is a constant due to the conservation of the total optical energy at different depths. In other words, in GR-PAM, optical sectioning can be achieved in the axial dimension. If we take a Gaussian approximation for the light beam, the axial resolution Δz can be expressed by [20]:
| (4) |
where λ is the optical wavelength, and NA is the numerical aperture of the optical focal lens.
Experimental Setup
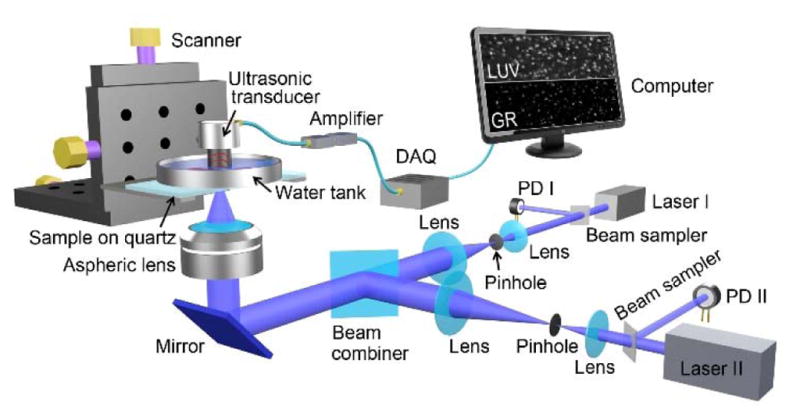
A schematic of the GRUV-PAM system is shown in Fig. 1. Two pulsed 266 nm lasers (10 kHz pulse repetition rate, QL266-010-O, CrystaLaser Inc., and Wedge-XF-266, Bright Solutions SRL) are each first spatially filtered and expanded by an assembly of a lens (LB4941-UV, Thorlabs Inc.), a pinhole (50 μm diameter, #59-257, Edmund Optics Inc.), and another lens (LB4374-UV, Thorlabs Inc.) to obtain single-mode laser beams. The two filtered beams are then spatially combined by a semi-transparent mirror (beam combiner, BSW20, Thorlabs Inc.). The combined beams are reflected upward by a mirror (PF10-03-F01, Thorlabs Inc.) and tightly focused by an aspheric lens (0.18 effective NA, AFL25-40-S-X, asphericon GmbH) to illuminate the sample from below. The sample is placed on a quartz slide, which provides a transparent window for UV light delivery and a flat sample surface for high quality imaging. For efficient acoustic coupling, the sample is placed beneath a plastic membrane at the bottom of a tank that is filled with water. The GR signal from the plastic membrane can be neglected because it absorbs UV light much less than cell nuclei and it is out of focus, as shown in Dataset 1 [22]. A focused ultrasonic transducer (50 MHz central frequency, 85% bandwidth (one way), V214-BB-RM, Olympus NDT Inc.) is immersed in the water for sensitive PA signal detection. The detected signals are then electrically amplified (56 dB, two ZFL-500LN+, Mini-Circuits, Inc.) and sent to a data acquisition card (ATS9350, Alazar Technologies Inc.). Both conventional LUV-PAM and nonlinear GRUV-PAM C-scan images can be obtained by motorized raster scanning (PLS-85, PI miCos GmbH). Note that photodiodes (PDA36A, Thorlabs Inc.) are used to measure and correct the lasers’ pulse-to-pulse fluctuations for accurate mathematical extraction of the nonlinear PA signals.
Fig. 1.

Schematic of the GRUV-PAM experimental system. PD, Photo diode; DAQ, Data acquisition card; LUV, LUV-PAM; GR, GRUV-PAM.
Results
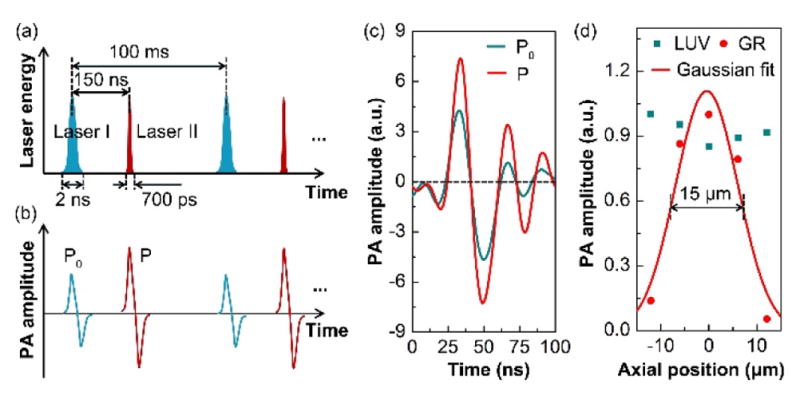
For demonstration, we imaged mouse brain slices with our GRUV-PAM system. To prevent photo-damage of the sample during scanning, the incident UV pulse energies of the two lasers were limited to about tens of nanojoules (10–25 nJ). Due to the small optical focal spots, the thermal relaxation time is short (<1 μs). Therefore, we used a short delay time, ~150 ns, between the two lasers, for efficient GR effect generation. The delay time was tuned by a delay generator. The pre-heating laser (laser I) had a pulse width of 2 ns, whereas the sequential one (laser II) had a pulse width of 700 ps (Fig. 2(a)). The PA signals generated by the first laser (P0) were weaker than the signals generated by the second laser (P) primarily due to the GR effect (Fig. 2(b)). We imaged a cell nucleus using our GRUV-PAM system (The pulse energies of laser I and laser II were 15 nJ and 8 nJ, respectively.). Both P and P0 signals are plotted on the same time scale for comparison in Fig. 2(c). According to the derivation above, the GR signals (PGR) can be obtained by computing the difference between P and P0. To show the sectioning capability of LUV-PAM in comparison to GRUV-PAM, we scanned the cell nucleus at different depths, with a step size of 6.25 μm. At each depth (i.e., axial position), we calculated the maximum amplitude projection (MAP) for both LUV-PAM and GRUV-PAM (Fig. 2(d)). GRUV-PAM clearly shows sectioning of the cell nucleus. Expectedly, LUV-PAM does not show any observable signal difference within 25 μm, which is still smaller than the acoustic resolution (~48 μm) [14]. The data points for GR are fitted with a Gaussian profile. The full width at half maximum (FWHM) is ~15 μm, which matches well with our theoretical estimation (14.8 μm) with the NA of 0.18 and wavelength of 266 nm [20].
Fig. 2.

Study of the improved performance of the GRUV-PAM system. Schematics of (a) the laser pulse sequence and (b) the corresponding stimulated PA signals. The laser pair excites a mouse brain slice at a 10 kHz repetition rate. In each period, laser II is triggered 150 ns after laser I, which is well within the thermal relaxation time. (c) Experimentally measured PA A-line signal of a cell nucleus stimulated sequentially by laser I and laser II. The amplitude of P is greater than that of P0 due to the GR effect. (d) Experimentally measured PA amplitudes of a cell nucleus at different optical focal depths. The FWHM of the Gaussian fit is ~15 μm.
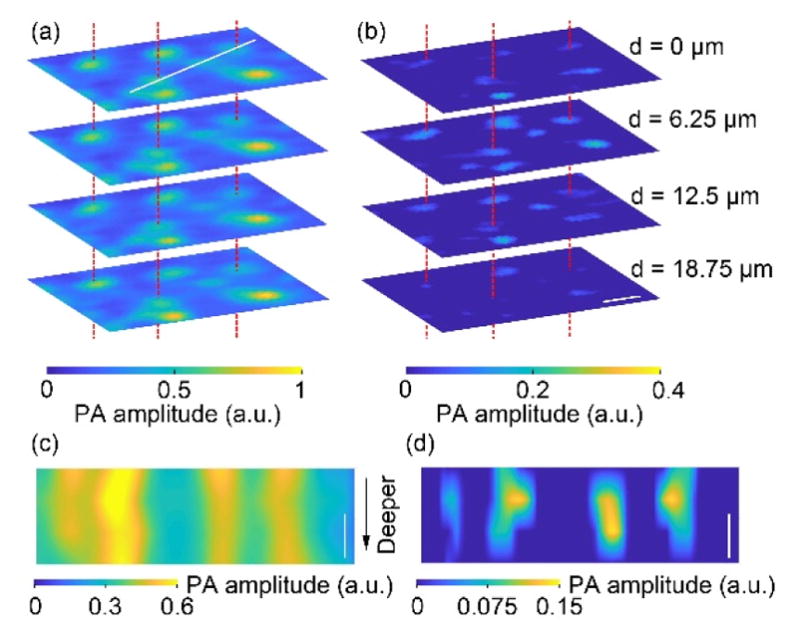
Next, to show the optical sectioning capability of GRUV-PAM in three dimensions, we imaged a small portion of a mouse brain slice with an axial step size of 6.25 μm at four depths and a lateral step size of 0.94 μm, which was close to the lateral optical focal spot size of the current system. The theoretical lateral resolution is 0.64 μm, improved by times over LUV-PAM. Because the main advantage of GRUV-PAM for cell nuclear imaging is its improvement in axial resolution, and to provide the optimal balance between resolution and scanning time, we have used a lateral step size that is slightly larger than the theoretical lateral resolution. Using these parameters for GRUV-PAM, the imaging speed was 4×104 μm3/s. The pulse energies of laser I and laser II were 15 nJ and 8 nJ, respectively. In LUV-PAM, all the cell nuclei show similar brightness at different depths (Fig. 3(a)), whereas in GRUV-PAM, only the cell nuclei near the optical focal plane appear (Fig. 3(b)). Three cell nuclei are marked by red dashed lines to clearly indicate the same pair of nuclei for better comparison. To show the improved axial resolution, Fig. 3(c) and (d) show depth resolved LUV-PAM and GRUV-PAM images, respectively, along the white line marked in Fig. 3(a). The results clearly demonstrate that the GRUV-PAM image (Fig. 3(d)) reveals individual cell nuclei, while the LUV-PAM image (Fig. 3(c)) shows uniform signals at different depths.
Fig. 3.

Comparison of (a) LUV-PAM and (b) GRUV-PAM images of cell nuclei in a mouse brain slice acquired at four different depths 6.25 μm apart. Only the nuclei near the focal plane appear in the GRUV-PAM images, while the LUV-PAM images show all the nuclei. Three pairs of cell nuclei are marked with red dashed lines for comparison. Depth resolved (c) LUV-PAM and (d) GRUV-PAM images along the white line marked in (a). Scale bars: 10 μm.
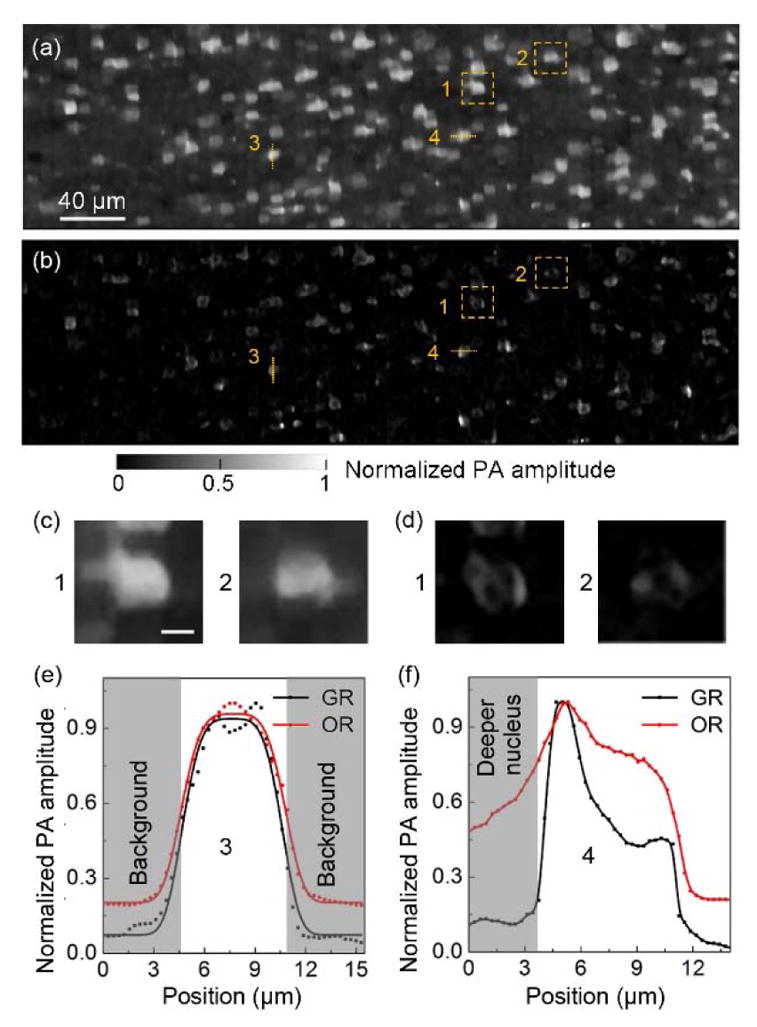
To further show the importance of GRUV-PAM for medical applications, we imaged a larger field-of-view (440 × 130 μm2) of a mouse brain slice so that more cell nuclei could be seen (The pulse energies of laser I and laser II were 25 nJ and 20 nJ, respectively.). The LUV-PAM image is shown in Fig. 4(a), and the GRUV-PAM image of the corresponding region is shown in Fig. 4(b). After normalizing the two images, it is clear that the GRUV-PAM image (Fig. 4(b)) has better contrast than the LUV-PAM image (Fig. 4(a)). Within the zoomed-in regions in Fig. 4(a) and (b), the internal structures of the cell nuclei are invisible in LUV-PAM (Fig. 4(c)), but are revealed in the GRUV-PAM image (Fig. 4(d)). These internal features are critical to making accurate diagnoses. GRUV-PAM also provides better contrast. To show the improvement of contrast quantitatively, we compared two line profiles of Fig. 4(a) and (b). The contrast was quantified as c = (PAmax − PAmin)/PAmin, where PAmax is the peak pixel value of the nucleus, and PAmin is the smallest pixel value of the nucleus. The contrast is enhanced by a factor of ~3.3 for the line profile in Fig. 4(e). Fig. 4(f) shows that the out-of-focus signals from deeper nuclei or cytoplasm are suppressed, and thus a better contrast is achieved in GRUV-PAM.
Fig. 4.

Comparison of (a) LUV-PAM and (b) GRUV-PAM images of the surface of a mouse brain slice. (c), (d) Zoomed-in views of the orange dashed box regions (1) and (2) in (a) and (b), respectively. (e) Cross-sectional normalized PA amplitude distribution along the orange line (3) in (a) and (b). (f) Cross-sectional normalized PA amplitude distribution along the orange line (4) in (a) and (b). Scale bar for (c) and (d): 5 μm.
Conclusions
To conclude, we have developed a GRUV-PAM system with a 15 μm axial resolution. The theoretical lateral resolution is 0.64 μm. In comparing its performance with conventional LUV-PAM using mouse brain slices, the advantages of GRUV-PAM are clear. The sectioning capability is determined optically instead of acoustically. Benefitting from the optical sectioning imaging capability of GRUV-PAM, accurate three-dimensional distributions and internal structures of cell nuclei can be revealed, which are important diagnostic features in many cancer diseases. Moreover, the contrast in cell nuclear imaging is also improved, which boosts the image quality further. An aspheric lens with a higher NA can be used to further improve both the axial and lateral resolutions. However, because a correspondingly smaller scanning step size would be needed and thus decrease the imaging speed, the optimal value of NA used in the system will depend on the specific application. Because two sequential excitations are needed in GR-PAM to trigger the nonlinear effect, the pulse energies should be controlled carefully to prevent any sample damage. In summary, we believe that, given its optical sectioning capability, UV-PAM will find potential applications in clinical settings.
Acknowledgments
Funding. National Institutes of Health grants DP1 EB016986 (NIH Director’s Pioneer Award), R01 CA186567 (NIH Director’s Transformative Research Award).
The authors appreciate Professor James Ballard’s close reading of the manuscript.
Footnotes
OCIS codes: (110.0180) Microscopy; (110.5120) Photoacoustic imaging; (170.3880) Medical and biological imaging; (190.0190) Nonlinear optics.
Competing interests: L.V.W. has a financial interest in MicroPhotoAcoustics Inc., CalPACT, LLC, and Union Photoacoustic Technologies, Ltd., which, however, did not support this work.
References
- 1.Wang LV, Yao J. A practical guide to photoacoustic tomography in the life sciences. Nat Methods. 2016;13:627–638. doi: 10.1038/nmeth.3925. [DOI] [PMC free article] [PubMed] [Google Scholar]
- 2.Wang LV, Hu S. Photoacoustic Tomography: In Vivo Imaging from Organelles to Organs. Science. 2012;335:1458–1462. doi: 10.1126/science.1216210. [DOI] [PMC free article] [PubMed] [Google Scholar]
- 3.Cox B, Laufer JG, Arridge SR, Beard PC. Quantitative spectroscopic photoacoustic imaging: a review. J Biomed Opt. 2012;17:061202. doi: 10.1117/1.JBO.17.6.061202. [DOI] [PubMed] [Google Scholar]
- 4.Xiang L, Wang B, Ji L, Jiang H. 4-D Photoacoustic Tomography. Sci Rep. 2013;3:1113. doi: 10.1038/srep01113. [DOI] [PMC free article] [PubMed] [Google Scholar]
- 5.Yao DK, Maslov K, Shung KK, Zhou Q, Wang LV. In vivo label-free photoacoustic microscopy of cell nuclei by excitation of DNA and RNA. Opt Lett. 2010;35:4139–4141. doi: 10.1364/OL.35.004139. [DOI] [PMC free article] [PubMed] [Google Scholar]
- 6.Wang LV, Zhang C, Zhang S, Yao D. Label-free photoacoustic microscopy of cytochromes. J Biomed Opt. 2013;18:20504. doi: 10.1117/1.JBO.18.2.020504. [DOI] [PMC free article] [PubMed] [Google Scholar]
- 7.Yao J, Wang L, Yang JM, Maslov KI, Wong TTW, Li L, Huang CH, Zou J, Wang LV. High-speed label-free functional photoacoustic microscopy of mouse brain in action. Nat Methods. 2015;12:407–410. doi: 10.1038/nmeth.3336. [DOI] [PMC free article] [PubMed] [Google Scholar]
- 8.Danielli A, Maslov K, Garcia-Uribe A, Winkler AM, Li C, Wang L, Chen Y, Dorn GW, Wang LV. Label-free photoacoustic nanoscopy. J Biomed Opt. 2014;19:86006. doi: 10.1117/1.JBO.19.8.086006. [DOI] [PMC free article] [PubMed] [Google Scholar]
- 9.Petushi S, Garcia FU, Haber MM, Katsinis C, Tozeren A. Large-scale computations on histology images reveal grade-differentiating parameters for breast cancer. BMC Med Imaging. 2006;6:14. doi: 10.1186/1471-2342-6-14. [DOI] [PMC free article] [PubMed] [Google Scholar]
- 10.Rønnov-Jessen L, Petersen OW, Bissell MJ. Cellular changes involved in conversion of normal to malignant breast: importance of the stromal reaction. Physiol Rev. 1996;76:69–125. doi: 10.1152/physrev.1996.76.1.69. [DOI] [PubMed] [Google Scholar]
- 11.Zink D, Fische AH, Nickerson JA. Nuclear structure in cancer cells. Nat Rev Cancer. 2004;4:677–687. doi: 10.1038/nrc1430. [DOI] [PubMed] [Google Scholar]
- 12.Weigelt B, Reis-Filho JS. Histological and molecular types of breast cancer: is there a unifying taxonomy? Nat Rev Clin Oncol. 2009;6:718–730. doi: 10.1038/nrclinonc.2009.166. [DOI] [PubMed] [Google Scholar]
- 13.Wong TTW, Zhang R, Zhang C, Hsu H, Maslov KI, Wang L, Shi J, Chen R, Shung KK, Zhou Q, Wang LV. Label-free automated three-dimensional imaging of whole organs by microtomy-assisted photoacoustic microscopy. Nat Commun. 2017;8:1386. doi: 10.1038/s41467-017-01649-3. [DOI] [PMC free article] [PubMed] [Google Scholar]
- 14.Wong TTW, Zhang R, Hai P, Zhang C, Pleitez MA, Aft RL, Novack DV, Wang LV. Fast label-free multilayered histology-like imaging of human breast cancer by photoacoustic microscopy. Sci Adv. 2017;3:e1602168. doi: 10.1126/sciadv.1602168. [DOI] [PMC free article] [PubMed] [Google Scholar]
- 15.Zhang C, Maslov K, Yao J, Wang LV. In vivo photoacoustic microscopy with 7.6-μm axial resolution using a commercial 125-MHz ultrasonic transducer. J Biomed Opt. 2012;17:116016. doi: 10.1117/1.JBO.17.11.116016. [DOI] [PMC free article] [PubMed] [Google Scholar]
- 16.Benninger RKP, Piston DW. Two-Photon Excitation Microscopy for the Study of Living Cells and Tissues. Curr Protoc Cell Biol. 2003;Chapter 4(Unit 4):11. doi: 10.1002/0471143030.cb0411s59. [DOI] [PMC free article] [PubMed] [Google Scholar]
- 17.Shi J, Wang L, Noordam C, Wang LV. Bessel-beam Grueneisen relaxation photoacoustic microscopy with extended depth of field. J Biomed Opt. 2015;20:116002. doi: 10.1117/1.JBO.20.11.116002. [DOI] [PMC free article] [PubMed] [Google Scholar]
- 18.Ma J, Wang LV, Ma J, Shi J, Hai P, Zhou Y, Wang LV. Grueneisen relaxation photoacoustic microscopy in vivo Grueneisen relaxation photoacoustic microscopy in vivo. J Biomed Opt. 2016;21:66005. doi: 10.1117/1.JBO.21.6.066005. [DOI] [PMC free article] [PubMed] [Google Scholar]
- 19.Tian C, Xie Z, Fabiilli ML, Wang X, Arbor A. Imaging and sensing based on dual-pulse nonlinear photoacoustic contrast: a preliminary study on fatty liver. Opt Lett. 2015;40:2253–2256. doi: 10.1364/OL.40.002253. [DOI] [PMC free article] [PubMed] [Google Scholar]
- 20.Wang L, Zhang C, Wang LV. Grueneisen relaxation photoacoustic microscopy. Phys Rev Lett. 2014;113:174301. doi: 10.1103/PhysRevLett.113.174301. [DOI] [PMC free article] [PubMed] [Google Scholar]
- 21.Wang LV, Wu H. Biomedical OpticsL Principles and Imaging. Wiley; Hoboken, New Jersey: 2007. [Google Scholar]
- 22.Dataset 1. Website:


