Abstract
RNA-seq and mass-spectrometry proteomics combined with growing data repositories have greatly increased the capacity to identify candidate proteins or protein sequence variants that share properties of ideal therapy targets, which include being abundant in cancer cells, absent or rare in adult organs (especially vital organs), and shared by many patient tumors. RNA-seq and fixed content arrays can identify genes that are over-expressed or mis-expressed in cancer. RNA-seq is uniquely suited to identifying-cancer specific sequence variants. We review factors relevant for determining whether products of genes that are abundant or differentially abundant in RNA-seq are concordant or discordant with proteins that are identified as abundant or differentially abundant in mass-spectrometry proteomics assays.
Introduction
Progress on immunotherapy has been slowed in part by a lack of viable cancer-specific proteins that can serve as viable immunotherapy targets. Ideal targets are simultaneously prevalent (i.e., expressed in many different patients), highly immunogenic, and preferably shared by cancers in multiple organ sites. RNA-seq technologies have great potential to identify new classes of immunogenic targets because they are high-throughput, unbiased, sensitive and specific, relatively insensitive to tissue preparation, can identify targets that derive from over-expression, mis-expression and that derive from sequence variants that arise from point mutations, rearrangements, altered splicing or RNA editing. Thus RNA-seq may allow identification of novel targets that have been missed by other approaches. For example, serologic expression cloning (SEREX) is biased against less abundant proteins that may be commonly encoded by low to middle abundance transcripts and it is not practical in large-scale studies1. Fixed content array technologies or workflows that collapse RNA-seq data to gene-level summaries are by definition unable to identify antigens that arise from variation in sequence, rearrangements, splicing or RNA editing. Proteomic approaches based on mass spectrometry (MS) have limited ability to identify therapeutically accessible protein sequence variants because of their limited sensitivity and coverage2 and can only identify variants that reside in derived databases3.
There has been an ongoing debate regarding the strength of relationship between RNA abundance and protein abundance which may call into question whether RNA-seq can serve as a viable strategy to identify abundant proteins. Low correlation of RNA and protein has reported for populations of yeast and other cells4–7 and for solid tumors, most recently in three reports from the National Cancer Institute (NCI) Cancer Proteomics Technology Analysis Consortia (CPTAC)8–10 which concluded that there is a limited concordance between protein and RNA abundance in ovary, colon and breast tumors8–10, although the overall concordance consists of a spectrum from low to high in different groups of proteins, and was especially low with proteins involved in ribosomes and in immune mediators in each of the disease sites.
The CPTAC conclusions regarding the association between RNA and protein abundances were based on correlating mass spectrometry (MS) estimates of protein abundance with RNA-seq estimates of RNA abundance. Low correlations were taken as evidence that proteins and RNA abundances were dysregulated and that low correlations among specific protein subgroups were taken as evidence that those specific pathways are implicated in properties of the disease. We will review properties of MS and RNA-seq assays and use criteria that emphasizes measures of concordance over correlation when re interpreting a subset of the CPTAC data sets in each disease site. The CTPAC sites were focussed in etiological questions, but our interpretations will be focussed on evaluating whether relying on RNA-seq to identify abundant or differentially abundant proteins is reasonable relative to an alternative which uses MS assays.
Selected properties of MS and RNA-seq assays
RNA-seq data sets familiar to most researchers profile the subset of polyAdenylated RNA, which is largely mRNA, although other types of RNA-seq assays also exist.11,12 PolyA RNA is most commonly captured from whole cell RNA using OligoDT which removes ribosomal RNA which constitutes over 90% of all cellular RNA and most of which is not polyAdenylated. mRNA is then fragmented into 300–500 nucleotides (nt) lengths and ~50-100nt (12-33 codons) from each end, or ~100-200nt (25 to 66 codons) total, are sequenced. Read-ends are aligned to a reference genome or transcriptome using one of a variety of available algorithms. See13,14 and others. One or both ends may align with high fidelity to a known transcript isoform, to an intronic region or to an intergenic region outside of a known locus. Some reads that originate from homologous gene families or regions will align to multiple possible locations (ambiguous alignment), or may not align at all. Gene-expression is quantified by counting the number of reads that are mapped to a known exon of each gene divided by the gene length then again by the number of mappable reads in the tumor (termed reads-per-kilobase-of modelled exon, or RPKM).
Discovery-based MS assays most commonly use tandem MS technologies but compared to RNA-seq workflows have a far larger variety of choices for sample processing, instrumentation and settings, and data processing schemes15. In most tandem MS workflows whole tissue protein lysates are first digested, usually with trypsin which enriches peptide C-termini for basic residues (lysine and arginine) that tend to hold multiple positive charges and are necessary for fragmenting the peptide by collision induced dissociation (CID). Peptide identities are inferred from the CID spectra by comparing the observed fragment masses to masses predicted from in-silico digest and fragmentation of a protein sequence database. CID spectra will match to a predicted spectra with varying degrees of fidelity and a variety of open-source and commercial tools exist to select peptides that match with low overall error rates.16–20
Peptides are then associated to a protein. Proteins are declared identified using either a formal protein-inference algorithm18,21 or by thoughtful heuristics which commonly requires two confident peptides per protein. Almost all proteins have peptides that map to only a small number of its peptides, and some peptides will match to multiple different proteins, especially those that derive from members of homologous gene families. Protein inference algorithms may differ greatly on whether and how they use information from these ambiguous peptides. Some, including those used to identify proteins in the CPTAC colon cancer paper,18,21 will assign ambiguous peptides to multiple proteins but with fractional weight, or assign those peptides with fractional weight to only those proteins that also have an unambiguous peptide. The former practice can inflate the number of proteins identified, and especially increase the numbers of proteins that reside in homologous gene groups. The latter practice will not inflate the number of proteins but will affect their abundance estimates (described below).
In MS proteins can be quantified using either a label-free approach such as spectral counting (SC), which was used by the CPTAC to profile colon cancer8, or by relative quantitation, which was used to profile breast and ovary tumors9,10. SC counts the number of times the MS instrument sampled any peptide that was assigned to a specific protein, with either full or fractional weight of ambiguous peptides were retained. Thus a protein will tend to have higher SC than another of equal molarity if it is more abundant, but other factors also affect the SC which will make two proteins of equal molarity have very different SC values. The SC will increase if it the protein has large numbers of tryptic peptides, if it’s peptides ionize better than others, or if it contains posttranslational modifications which render the peptides not identifiable by MS, including glycosylation. The association with protein composition can be reduced but not eliminated by adjusting the SC by the number of observable tryptic peptides in a protein, a process analogous to calculating RPKM for RNA-seq. This will be termed the adjusted spectral count, or ASC.
With relative quantification22 peptides are quantified by the ratio of their ion intensity in cancer to that observed in a reference sample, and so its value does depend on protein composition, but it also does not provide absolute measures of protein abundance as does the ASC. With relative quantitation proteins are quantified by aggregating the ratios of each peptide assigned to it to the protein.
What, if anything, is measured when two different types of assays are correlated?
Assays are compared using a measure of agreement, and CPTAC sites emphasized the Spearman correlation, or simply correlation, for quantitative data comparisons. The following illustrates why this measure is inadequate for comparing results from two different technologies. Consider four labs - A, B, C and D - that interrogate materials derived from the same tumor samples. All labs use the same MS platform (sample processing, instruments and settings) and agree to use the same sample processing protocols except that the Lab C leader was concerned about circulating blood contamination in the tumor, and so she depleted abundant blood proteins (Albumin and other proteins23) from the lysate before digestion and downstream processing24. Lab D uses RNA-seq.
Data are acquired and at first they are processed separately within each lab, but Labs B and C use the same algorithms which are different than Lab A. It should not be surprising to find that shared idiosyncrasies of Labs B and C platforms (the algorithms) artificially inflates their correlation compared to Lab A. Thus, to eliminate shared idiosyncrasies the labs then process the data using the same algorithms.
Proteins in each lab are then separately ranked by average abundance or relative abundance (a within-tumor analysis) and co-varying sets of proteins are identified by hierarchical clustering (a between tumor analysis). It should not be surprising to find that Labs A and B, who use identical protocols, have higher correlation with each other (say, r=0.8 for mean abundances) than to Lab C (say, R=0.7) or Lab D (say, r=0.6). It should also not be surprising to find that Lab D agrees more closely with Lab C (say, r=0.75) than to A and B because RNA-seq is insensitive to blood protein infiltration.
Should these results justify claims by Labs A and B that proteins do not correlate with RNA, or that disease-specific pathways defined by RNA and protein are different, simply because they agree more with each other than with Lab D? If so, then they should also conclude that proteins do not correlate proteins based on their lower correlation with Lab C. It is evident that the latter conclusion does not hold, and thus neither does the former, a priori. If that conclusion does not hold, then one can also not conclude that the MS platforms (Labs A-C) are better than RNA-seq (Lab D) purely because their correlations are higher among them as higher correlations can occur because platforms share idiosyncrasies (i.e., shared data processing algorithms) or biases.
Correlation and concordance of RNA-seq and MS abundance measures
Determining which if any platform should be preferred to another in the absence of a gold standard (e.g., antibody-based assays) requires that one go beyond quantitative metrics and interpret the data. We will not seek to identify whether one platform is superior to another in an absolute sense, as it is an ill-defined problem and one that is not relevant to therapeutics research. We will identify the extent to which results when using one platform or the other lead to discordant findings, then assess properties of those discordances. To demonstrate how concordance can come to different conclusions from correlation we re-interpreted protein abundances in 57 colon cancers8 estimated CPTAC using MS and ASC (adjusted spectral counting). The MS data integrated by CPTAC with matched RNA-seq data from the TCGA8 were downloaded and used without any further processing.
The MS abundances in two samples is associated in Fig. 1A. Each point reflects the log ASC measured in each patient tumor. The grey points are proteins identified in these two samples but not in all samples. The colored points are the subset of proteins used in most CPTAC analyses; the 1920 proteins identified in all 57 samples. Colors reflect the average log(ASC) abundance of each protein in those 1920 proteins (yellow=high ASC, red=low ASC). As can be seen here reproducibility is highest among the abundant proteins.
Fig. 1. Correlations within and between CPTAC colon cancer MS and RNA-seq data sets.
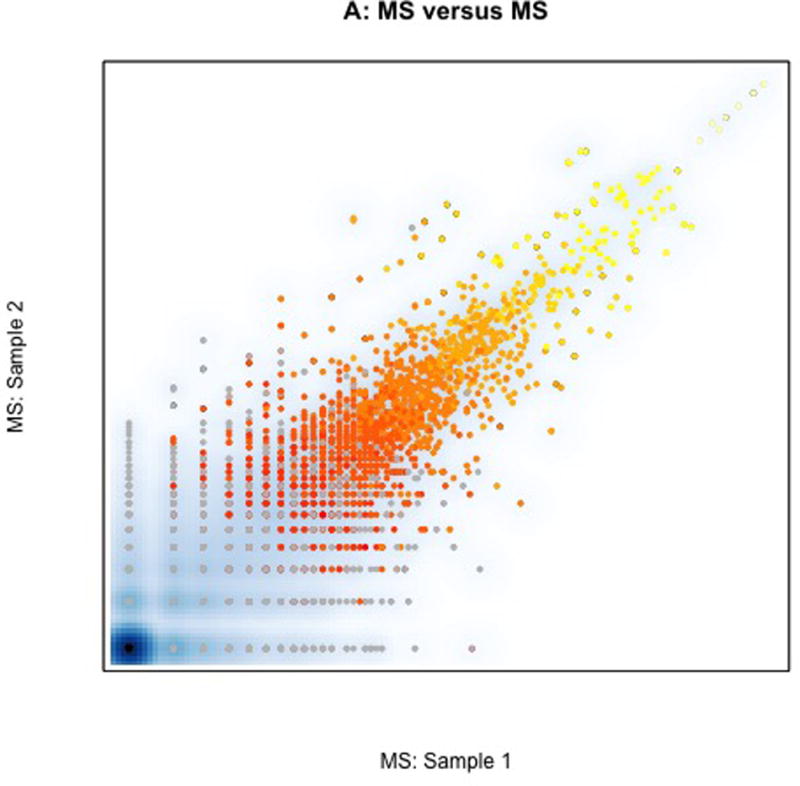
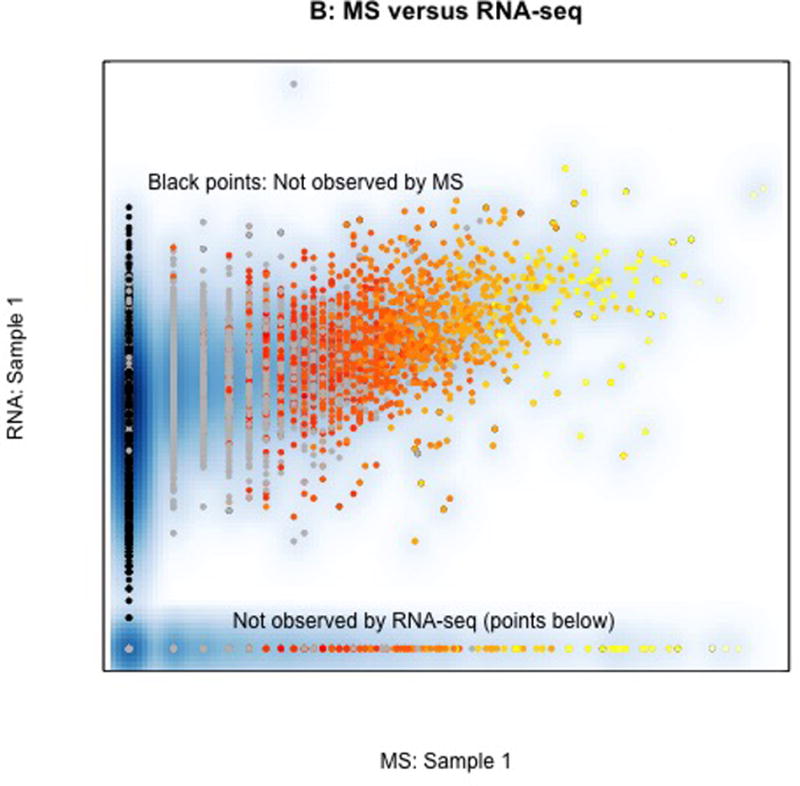
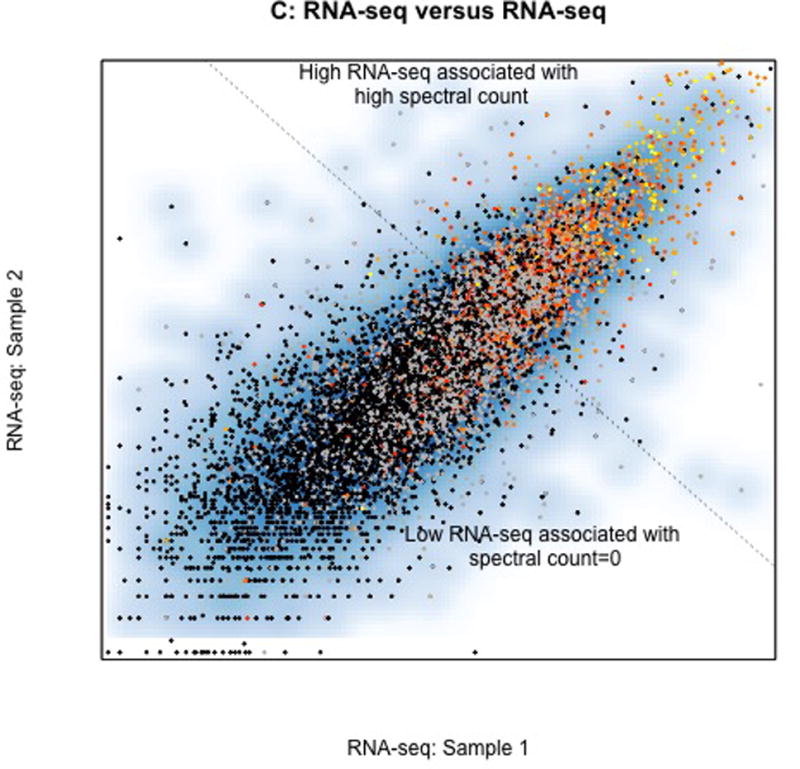
In all figures grey points represent proteins observed by MS only in only some samples, black points represent proteins not observed by MS but observed by RNA-seq, and colored points represent one of ~1,900 proteins observed in all 57 samples (yellow = high mean spectral count, red=1 spectral count). A. Association between MS spectral count in two different colon tumors showing a higher correlation among proteins that are abundant (yellow) than those that are not abundant (red and grey). B. Association between MS spectral count (horizontal axis) and RNA-seq abundance estimates (vertical) within a single sample. Products of over 13K genes were identified by RNA-seq (black). Proteins observed only in MS are largely derived from members of homologous gene families that are difficult to infer individually with sparse peptide coverage provided by MS. C. Correlation of RNA-seq in the two samples. Colored points correspond to one of the genes whose protein product was identified in all samples. Most of the observed proteins are derived from among the most abundant 20% of transcripts, and the most abundant proteins are derived from the most abundant transcripts, showing that overall abundant transcripts encode abundant proteins and abundant proteins derive from abundant transcripts. The dotted line represents the potential selection of abundant transcripts, which also selects the abundant proteins. CPTAC analyses omitted grey points and black points from their assessment.
The correlation between RNA-seq and MS for one of the samples is shown in Fig. 1B. Genes or proteins observed in one platform but not in another are indicated; ~11K transcripts were observed by RNA-seq that do not have an associated MS identification. Most of the proteins unique to MS (noted at bottom) are members of homologous gene families that are difficult to infer without ambiguity by MS.
This correlations demonstrated in Fig. 1A is lower than in Fig. 1B, and represents the type of evidence that was used to conclude that “… protein abundance cannot be reliably predicted from DNA- or RNA-level measurements”.8 However, in their analyses the grey points and black points in Fig. 1B were omitted when they evaluated overall correlations. The effect of eliminating them is demonstrated in Fig. 1C which associates RNA-seq data sets from the two samples. Protein abundance by ASC is indicated by color. As can be seen the lowest abundant proteins (ASC=0, black) are associated with the lowest abundant transcripts, then the next lowest set of proteins (grey, with ASC=0 in some samples, then red=lowest average among 1920 proteins) are associated transcripts that are intermediate abundance, and the most abundant transcripts are associated with the most abundant proteins (yellow).
The demonstration in Fig. 1C shows that abundant proteins largely derive from abundant transcripts and abundant transcripts largely derive from abundant proteins. Calculating a correlation may be problematic when including proteins not identified by MS, but the correlation may not be relevant for selecting abundant proteins as for most proteins both MS and RNA-seq agree; most abundant proteins and abundant transcripts reside above the dashed line in Fig. 1C although there are many proteins identified by RNA-seq that are missed by MS, and some proteins are identified by MS that were missed by RNA-seq.
Properties of proteins that are discordant in RNA-seq and MS assays
We next evaluated properties of transcripts and proteins identified in only one platform. The discordant observations are displayed in Fig. 2 which relates the mean MS and mean RNA-seq abundances calculated across all 57 samples. Discordant points are these observed in only one platform or that deviate signifacantly from the cloud of points. Points were colored based on some observed shard properties; black=unique to RNA-seq, green indicates ribosomes, blue circles indicate proteins that are known marker-genes for immune-response cells and other immune response regulatory proteins, and red indicates a protein identified by two or more unique peptides in a large-scale serum proteomics study of cancer free women (n~1000 proteins total)25.
Fig. 2. Blood derived proteins in CPTAC colon cancer as a potential source for apparent discordance between RNA-seq and MS data sets.
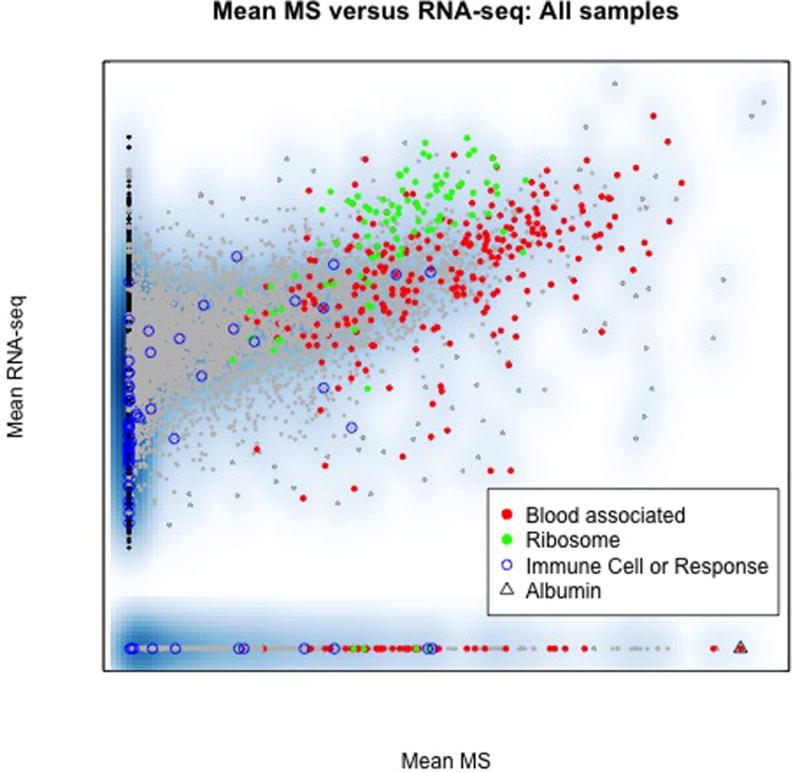
Each point represents the average RNA-seq (vertical) and average MS abundance (horizontal axis) calculated across all 57 colon cancer tumors. As in Fig. 1 black points are observed only by RNA-seq and grey points are observed in only some tissues. Red points indicate proteins identified by two peptides or more in blood of cancer free individuals (blood associated proteins), blue are immune-response cell marker proteins and green points represent ribosomal proteins. Discordant proteins, those that lie furthest from the cloud of points, are significantly enriched for blood proteins, including albumin, which are expected to derive from blood infiltration of the tumor and which may vary dramatically between tumors. Many blood proteins reside in immune response or inflammatory pathways which were identified as pertinent in all CPTAC data sets. Ribosome processing was also identified as pertinent. Blood infiltration includes proteins, non-nucleated and nucleated cells, and only the latter will contribute to RNA-seq data sets, and thus the discordance may be attributed to sample properties and differences in the assays rather than to biological processes in malignant cells that dysregulated RNA and protein abundances.
Transcripts unique to RNA-seq are largely derived from genes that encode modified proteins or proteins that are short and have small numbers of tryptic peptides, and are thus difficult to observe by MS. If products of those genes are relevant to a therapeutic modality then RNA-seq may be considered superior, depending on the quality of proteins identified by MS that are not identified by RNA-seq.
Blood associated proteins and immune response cells accounted for a large portion of all observations unique to MS. These proteins and a subset ribosomal proteins account for the lion share of discordant observations that are shared by the platforms. Ribosomes are commonly recycled so their higher abundance in RNA-seq is not likely a property of dysregulation.
Blood-associated transcripts and proteins can originate from two sources; blood protein and nucleated blood cells from residual blood in the tumor, and products of tumor infiltrating immune-response cells which may be naturally considered part of the tumor microenvironment but not of the malignant component. Nucleated cells will contribute to both MS and RNA-seq but blood proteins will contribute to only MS, and those can be expected to be higher in or unique to MS, which is seen here.
Thus differences in ribosomes and blood proteins can be attributed to known idiosyncrasies of each assay which may make MS data sets more similar. These proteins also share membership in well defined functional groups, including ribosome processing and of inflammation or immune-regulation both of which were implicated by all CPTAC sites as important sources of dysregulation in cancer that can be observed only in MS data sets. We have not reproduced their analyses, but it is plausible that their findings can be attributed at least in part to properties of the assays and sample quality rather than to biological properties of the malignant component of cells. Thus, based on this analysis and that above we conclude that RNA-seq and MS data sets are largely concordant, and discordant findings may be not be relevant for measuring properties of a tumor’s malignant component.
Potential influence of blood infiltration on patient subgroup and pathway identification
The analysis above examined discordance relevant for identifying abundant proteins. Here we look at discordances that may arise when evaluating cross-sample differences in protein abundance. All CPTAC manuscripts reported a discordance between MS and RNA-seq when evaluating patient subgroups or differentially activated pathways, which are identified by clustering changes in protein concentration across samples. To evaluate this we used CPTAC ovarian cancer data, which was obtained in two laboratories. For 32 samples MS data sets were obtained in both laboratories and we restricted attention to these samples.
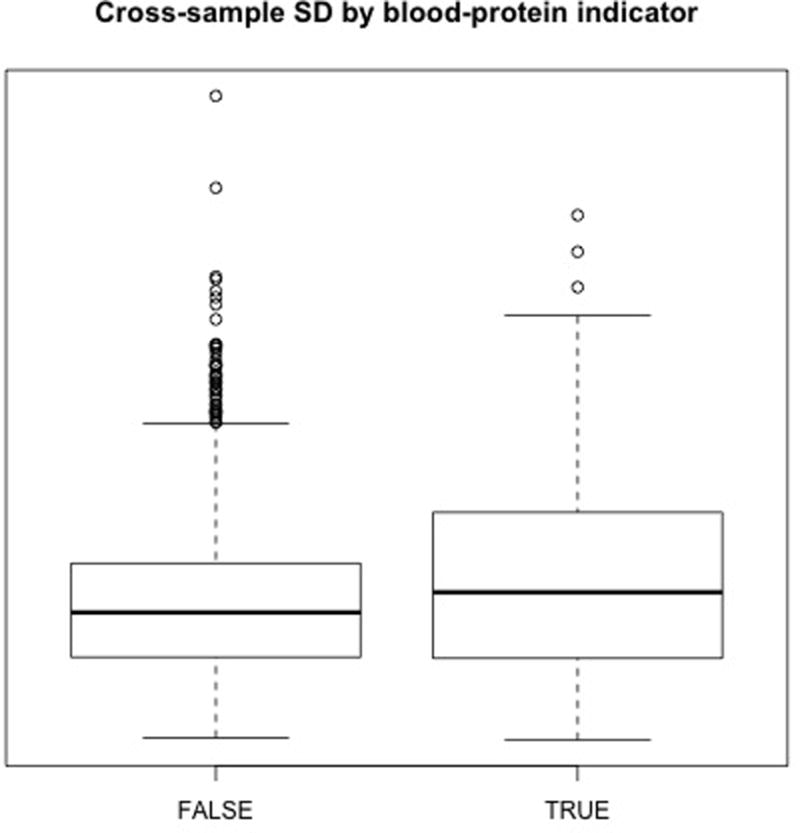
As is common practice CPTAC sites selected a subset of proteins with the highest cross-sample standard deviation. We mimicked this process by selecting an informative subset of proteins from the 4680 proteins identified in all 32 samples by both labs. The SD calculated separately at each lab was highly correlated, indicating a high degree of precision in each lab. See Fig. 3. Points above the dotted line denote 1000 informative proteins selected based on their average cross-sample SD.
Fig. 3. Blood proteins in CPTAC ovarian cancer tissues are enriched among the proteins that are most variable across tumors.
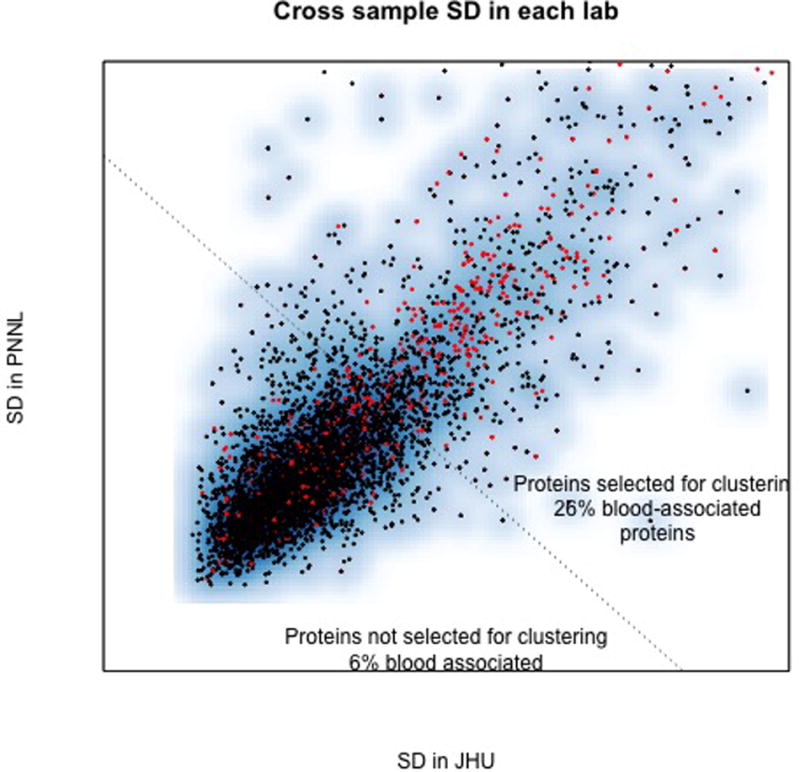
The standard deviation of 4680 proteins identified at both CPTA laboratories was calculated separately using data from each of thirty-two (32) ovarian cancer tissues measured in both laboratories. Each point represents the standard deviation observed in each pair of labs. Blood associated proteins are red. Points above the dotted line are the 1000 proteins that have highest standard deviation averaged across both labs and represent those that may be selected for clustering subgroups or for identifying differentially active pathways. The high correlation indicates a high degree of reproducibility of the assay across the labs. Blood associated proteins account <3% of all proteins identified they represent over 24% of the most abundant proteins that would be selected for clustering for to identify associations among proteins that may point to regulatory pathways of importance. The large fraction of blood associated proteins among this group risks such analyses being dominated by qualities that are unrelated to malignant cells and tumor infiltrating cells which may be operative in the tumor microenvironment.
Blood proteins were found significantly enriched among blood proteins. Although overall <3% of proteins identified were blood-associated they represented 24% of the informative proteins selected in Fig. 2. This finding, which shows that blood-associated proteins are among the most-variable proteins, is meaningfully different than shown in colon cancer, which showed that they are also among the most abundant proteins.
The number of blood proteins and their magnitude of variation creates a risk that subgroup definitions will be dominated by tumor to tumor variation in infiltrating blood which are not relevant for inferring molecular mechanisms in the tumors malignant component or for classifying patients on those factors; i.e., patients with significant blood infiltration will tend to cluster together rather than patients that share a molecular alteration. To demonstrate this potential we correlated a single sample across two labs, first using all proteins identified in that sample, which found a low correlation (r=0.62 in Fig. 4A). Correlation increased significantly when proteins were restricted those shared in all 32 samples (r=0.72 in Fig. 4B). Correlation was highest among the blood proteins observed in all samples (r=0.85 in Fig. 4C). When restricted to the 1000 informative proteins the correlation was comparable to blood only (r=0.78 in Fig. 4D).
Fig. 4. Correlation of MS data between two ovarian cancer samples for different subsets of proteins.
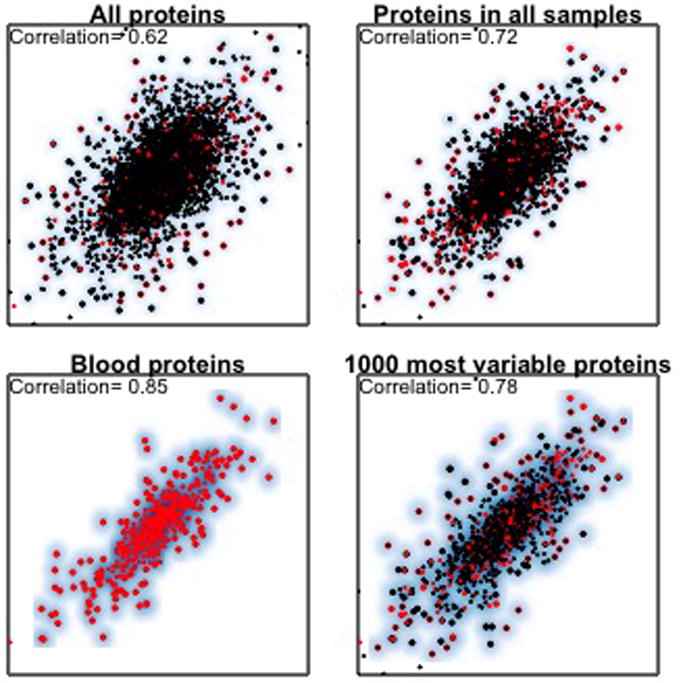
Each figure associate’s log(tumor-reference protein abundance ratio) estimated in the two CPTAC labs for a single ovarian cancer sample. The set of panels show how the correlations between the two labs can change dramatically when subsetting on different subgroups of proteins. A. Correlation of 0.62 for all 7119 proteins measured in the sample at both sites. B. Correlation increases to 0.72 when limited to 4680 proteins that were observed in all 32 samples. This correlation includes 511 (~10%) blood-associated proteins. C. Correlation among the blood-derived proteins only (r=0.82). D. Correlation when restricted to the 1000 proteins that are most variable across all samples. The higher correlation among blood derived proteins is reflective of their larger overall range of relative abundances within a sample compared to other proteins.
The correlations in Fig. 4D have several implications. The higher correlation observed in the informative subset, being dominated by factors not observable in RNA-seq, can serve as an idiosyncrasy shared by MS platforms that will make their correlations high for reasons unrelated to the correlation of RNA and protein. The enrichment of blood proteins among their informative sets means that their clusters may also be defined for by factors unrelated to properties of the malignant cells.
These results conclude that differences in subgroups and pathways that are discordant between RNA-seq and MS are not related to properties important for therapeutics. Although all CPTAC sites implicated immune-regulatory processes (or inflammation), which are important for therapeutics, blood proteins share memberships in these pathways, and thus those conclusions are plausibly a consequence of blood infiltration.
Global properties of proteome measures across multiple assays
The analyses above show that MS and RNA-seq abundance estimates can vary for reasons unrelated to their abundance in a tissue or a cell, and can vary across samples for reasons unrelated to their regulation in malignant cells. Some variation will derive from changes in tumor composition, but a variety of biochemical properties of proteins can affect MS assays in ways that are unrelated to their abundance and which may create discordance between RNA-seq and MS. Properties that affect estimated abundances, like may often be shared by members of well-defined biological pathways which risks false attribution of those biological pathways to tumors. MS assays including antibody mediated proteomics assays may be particularly susceptible to influence from such groups of proteins because they are restricted to high-abundant proteins that derive from specific cellular processes, many of which share a variety of posttranslational modifications that can affect their results.
We demonstrate the potential scale of this problem by integrating CPTAC breast cancer MS data, including RNA-seq data and results from antibody-based Reversed Phase Protein Arrays (RPPA) data9. Analysis was restricted to the 1000 most variable breast cancer proteins identified by MS. Samples and proteins were clustered using MS assays and then annotated for properties. See Fig. 5.
Fig. 5. Global MS, RNA-seq and RPPA expression patterns among 1000 most variable protein abundances in CPTAC breast cancer.
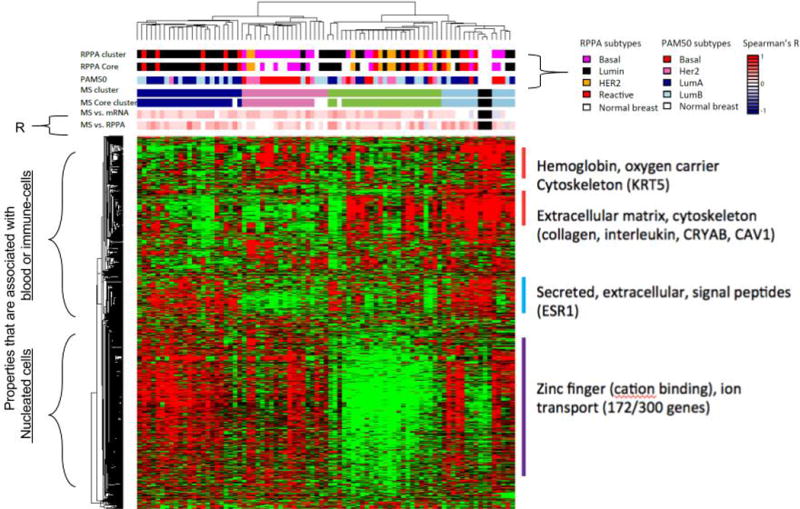
Breast cancer proteome was profiled in 77 tumor samples and 3 biological replicates with high-quality MS data and 3 normal breast samples. Breast cancer proteins were selected based on cross-sample standard deviation. Heatmap indicates relative expression. Samples are annotated based on MS versus RNA-seq, MS versus RPPA, and other factors, and on RPPA cluster identities.
Four distinct protein groups accounted for the majority of the informative proteins identified. These included three groups with properties that are common in blood-derived proteins or immune-cells (top group), and tightly correlated proteins derived from members of highly homologous gene groups (Zinc-fingers). A group of cytoskeletal proteins are also observed. Zinc-fingers, cation binding and other proteins form the largest group. Large numbers of proteins from this family are identified with very similar abundances.
Samples cluster into two major groups (defined by combined Zinc-finger expression and low content of blood-associated proteins. This grouping may suggest that their biological functions have been altered relative to other tissues, and their abundances may define an important subpopulation. However, properties of the assays may also account for some or all of this observation. The close similarity of their abundances could be at least in part a product of ambiguous peptide assignments among members of the group. It is also possible that tumors that Zinc fingers and other proteins are observable in samples that have low volumes of blood infiltration, which will effectively increase the ability of the assay to identify lower abundant proteins.
Four major sub-groups are also defined by MS (See Column headings of MS cluster). While the correlation with RNA-seq or with RPPA for individual samples is not strong (see Column headings), two clusters with relatively low level of blood-associated proteins are concordant with PAM50 and RPPA-based Luminal and Basal subtypes respectively. RNA-seq and RPPA both measure a sizable number of regulatory gene products (mRNA or protein). MS assays appear to be dominated by identifications to abundant cytoskeletal or extracellular proteins, blood-associated proteins. Another group of tumors with high level of cytoskeleton or extracellular matrix genes are tightly co-clustered with the normal breast samples. Significant lower correlation with RNA-seq data was observed for these samples. These results suggests tumor composition is a major factor that drives the discordant subgroup definitions in MS and RNA-seq.
Summary
Ideal immunotherapy targets are proteins that are abundant, prevalent, immunogenic and expressed by malignant cells rather than infiltrating cells. We have reviewed properties of two high-throughput approaches, RNA-seq and MS, that may need to be taken into account when interpreting experiments that are intended to identify such targets or to identify properties of pathways or patient subpopulations that may benefit from them. Based on a reinterpretation of recently published data sets we do not find evidence to support claims that investigators using RNA-seq as a surrogate for protein abundance will be harmed relative to using MS. Overall we find a high degree of concordance between the two assays, and differences in them suggest that MS may be inferior if blood infiltrating proteins are not relevant for the question at hand, or if proteins of interest reside among those that are not generally identifiable by MS because of their abundance, peptide composition, or post-translational modifications.
Our analyses demonstrated that quantitative metrics are not sufficient to draw conclusions. Data sets must be interpreted and properties of the assays must play a role in those interpretations to make a confident attribution. We also advocate for evaluating technologies based on their discordances, not their agreements, which necessarily requires defining an experimental estimand. Our focus was using these techniques to identify proteins that are abundant, that vary significantly across samples, and likely derive from malignant cells or possibly tumor infiltrating cells. We come to different conclusions regarding the strengths and weaknesses of MS and RNA-seq compared to CPTAC manuscripts based on these considerations. Our analyses suggest that the properties shared by MS assays but absent from RNA-seq assays lead (shared idiosyncrasies and biases from blood contamination) create correlations are higher than justified by their precision in estimating protein abundances or differential abundances. This was illustrated in Fig. 3 which showed that when among all proteins replicate MS assays correlate by 0.62 (comparable to RNA-seq MS correlations reported by CPTAC sites) and increases to 0.78 when calculated using proteins that are enriched only in those assays.
The analyses above are for illustrative purposes only. We did not repeat CPTAC analyses, used only a subset of their MS data sets, and we did not use the non-MS data sets that were used in each CPTAC sites. We also did not focus in etiological questions, which was the focus of the CPTAC studies. Thus we do not believe that any of our conclusions serve as evidence to refute their major conclusions, many of which were not reliant solely on MS and RNA-seq. We also recognize that MS workflows are available, including workflows that target specific protein subsets26 with greater sensitivity, and others that can quantify abundances of proteins that reside on the cell surface or that have been secreted and which may play a vital role in therapy design27. RNA-seq and MS assays may also be useful when combined. Together they may have direct advantages for coping with blood infiltration, which will also bring in nucleated cells that will alter both RNA-seq and MS. Because only MS data sets can identify proteins known to be exclusively derived from blood (e.g., albumun) together blood protein variation may be useful as an instrument28 to remove the contribution from cells that derive from the contamination but leave the contribution from cells that are in-fact interacting in the tumor microenvironment.
Acknowledgments
Supported by grants from the National Cancer Institute (NCI) Cancer Target Discovery and Development (CTD2) (U01 CA176270), the NCI Early Detection Research Network (EDRN) (NIH/NCI U01 CA152637), the Department of Defense (W81XWH-12-0349) and the Listwin Family Foundation.
References
- 1.Zhou S, et al. Mapping the high throughput SEREX technology screening for novel tumor antigens. Comb Chem High Throughput Screen. 2012;15:202–215. doi: 10.2174/138620712799218572. [DOI] [PubMed] [Google Scholar]
- 2.Ning K, Nesvizhskii AI. The utility of mass spectrometry-based proteomic data for validation of novel alternative splice forms reconstructed from RNA-Seq data: a preliminary assessment. BMC Bioinformatics. 2010;11(Suppl 11):S14. doi: 10.1186/1471-2105-11-S11-S14. [DOI] [PMC free article] [PubMed] [Google Scholar]
- 3.Nesvizhskii AI. Proteogenomics: concepts, applications and computational strategies. Nat Methods. 2014;11:1114–1125. doi: 10.1038/nmeth.3144. [DOI] [PMC free article] [PubMed] [Google Scholar]
- 4.Edfors F, et al. Gene-specific correlation of RNA and protein levels in human cells and tissues. Mol Syst Biol. 2016;12:883. doi: 10.15252/msb.20167144. [DOI] [PMC free article] [PubMed] [Google Scholar]
- 5.Gygi SP, Rochon Y, Franza BR, Aebersold R. Correlation between protein and mRNA abundance in yeast. Mol Cell Biol. 1999;19:1720–1730. doi: 10.1128/mcb.19.3.1720. [DOI] [PMC free article] [PubMed] [Google Scholar]
- 6.Vogel C, Marcotte EM. Insights into the regulation of protein abundance from proteomic and transcriptomic analyses. Nat Rev Genet. 2012;13:227–232. doi: 10.1038/nrg3185. [DOI] [PMC free article] [PubMed] [Google Scholar]
- 7.de Sousa Abreu R, Penalva LO, Marcotte EM, Vogel C. Global signatures of protein and mRNA expression levels. Mol Biosyst. 2009;5:1512–1526. doi: 10.1039/b908315d. [DOI] [PMC free article] [PubMed] [Google Scholar]
- 8.Zhang B, et al. Proteogenomic characterization of human colon and rectal cancer. Nature. 2014;513:382–387. doi: 10.1038/nature13438. [DOI] [PMC free article] [PubMed] [Google Scholar]
- 9.Mertins P, et al. Proteogenomics connects somatic mutations to signalling in breast cancer. Nature. 2016;534:55–62. doi: 10.1038/nature18003. [DOI] [PMC free article] [PubMed] [Google Scholar]
- 10.Zhang H, et al. Integrated Proteogenomic Characterization of Human High-Grade Serous Ovarian Cancer. Cell. 2016;166:755–765. doi: 10.1016/j.cell.2016.05.069. [DOI] [PMC free article] [PubMed] [Google Scholar]
- 11.Sanz E, et al. Cell-type-specific isolation of ribosome-associated mRNA from complex tissues. Proc Natl Acad Sci U S A. 2009;106:13939–13944. doi: 10.1073/pnas.0907143106. [DOI] [PMC free article] [PubMed] [Google Scholar]
- 12.Ingolia NT, Brar GA, Rouskin S, McGeachy AM, Weissman JS. The ribosome profiling strategy for monitoring translation in vivo by deep sequencing of ribosome-protected mRNA fragments. Nat Protoc. 2012;7:1534–1550. doi: 10.1038/nprot.2012.086. [DOI] [PMC free article] [PubMed] [Google Scholar]
- 13.Trapnell C, Pachter L, Salzberg SL. TopHat: discovering splice junctions with RNA-Seq. Bioinformatics. 2009;25:1105–1111. doi: 10.1093/bioinformatics/btp120. [DOI] [PMC free article] [PubMed] [Google Scholar]
- 14.Wu TD, Reeder J, Lawrence M, Becker G, Brauer MJ. In: Statistical Genomics. Mathé E, Davis S, editors. Springer; New York: pp. 283–334. [Google Scholar]
- 15.Bantscheff M, Schirle M, Sweetman G, Rick J, Kuster B. Quantitative mass spectrometry in proteomics: a critical review. Anal Bioanal Chem. 2007;389:1017–1031. doi: 10.1007/s00216-007-1486-6. [DOI] [PubMed] [Google Scholar]
- 16.Fitzgibbon M, Li Q, McIntosh M. Modes of inference for evaluating the confidence of peptide identifications. J Proteome Res. 2008;7:35–39. doi: 10.1021/pr7007303. [DOI] [PMC free article] [PubMed] [Google Scholar]
- 17.Keller A, Nesvizhskii AI, Kolker E, Aebersold R. An explanation of the Peptide Prophet algorithm developed. Anal Chem. 2002;74:5383–5392. doi: 10.1021/ac025747h. [DOI] [PubMed] [Google Scholar]
- 18.Tabb DL, McDonald WH, Yates RJ., 3rd DTASelect and Contrast: tools for assembling and comparing protein identifications from shotgun proteomics. J Proteome Res. 2002;1:21–26. doi: 10.1021/pr015504q. [DOI] [PMC free article] [PubMed] [Google Scholar]
- 19.Craig R, Beavis RC. TANDEM: matching proteins with tandem mass spectra. Bioinformatics. 2004;20:1466–1467. doi: 10.1093/bioinformatics/bth092. [DOI] [PubMed] [Google Scholar]
- 20.Weatherly DB, et al. A Heuristic method for assigning a false-discovery rate for protein identifications from Mascot database search results. Mol Cell Proteomics. 2005;4:762–772. doi: 10.1074/mcp.M400215-MCP200. [DOI] [PubMed] [Google Scholar]
- 21.Li YF, et al. A bayesian approach to protein inference problem in shotgun proteomics. J Comput Biol. 2009;16:1183–1193. doi: 10.1089/cmb.2009.0018. [DOI] [PMC free article] [PubMed] [Google Scholar]
- 22.Herbrich SM, et al. Statistical inference from multiple iTRAQ experiments without using common reference standards. J Proteome Res. 2013;12:594–604. doi: 10.1021/pr300624g. [DOI] [PMC free article] [PubMed] [Google Scholar]
- 23.Misek DE, et al. A wide range of protein isoforms in serum and plasma uncovered by a quantitative intact protein analysis system. Proteomics. 2005;5:3343–3352. doi: 10.1002/pmic.200500103. [DOI] [PubMed] [Google Scholar]
- 24.Keshishian H, Addona T, Burgess M, Kuhn E, Carr SA. Quantitative, multiplexed assays for low abundance proteins in plasma by targeted mass spectrometry and stable isotope dilution. Mol Cell Proteomics. 2007;6:2212–2229. doi: 10.1074/mcp.M700354-MCP200. [DOI] [PMC free article] [PubMed] [Google Scholar]
- 25.Prentice RL, et al. Novel proteins associated with risk for coronary heart disease or stroke among postmenopausal women identified by in-depth plasma proteome profiling. Genome Med. 2010;2:48. doi: 10.1186/gm169. [DOI] [PMC free article] [PubMed] [Google Scholar]
- 26.Whiteaker JR, et al. A targeted proteomics-based pipeline for verification of biomarkers in plasma. Nat Biotechnol. 2011;29:625–634. doi: 10.1038/nbt.1900. [DOI] [PMC free article] [PubMed] [Google Scholar]
- 27.Zhang H, Li XJ, Martin DB, Aebersold R. Identification and quantification of N-linked glycoproteins using hydrazide chemistry, stable isotope labeling and mass spectrometry. Nat Biotechnol. 2003;21:660–666. doi: 10.1038/nbt827. [DOI] [PubMed] [Google Scholar]
- 28.Sargan JD. The Estimation of Economic Relationships using Instrumental Variables. Econometrica. 1958;26:393–415. [Google Scholar]


