

Abstract
Molecular imaging agents have the ability to non-invasively visualize, characterize, and quantify the molecular biology of disease. Recent advances in nuclear probe development, particularly in PET radiotracers, have generated many new imaging agents with precise molecular targets. With such specificity, PET probes may be utilized as biomarkers to objectively interrogate and evaluate pathology. Whereas the current indications for PET imaging are predominately confined to staging and restaging of malignancy, the utility of PET greatly expands when utilized as a biomarker, the topic of this review. As an imaging biomarker, PET may be used to (1) measure target expression to select subsets of patients who would most benefit from targeted therapy; (2) measure early treatment response to predict therapeutic efficacy; and (3) relate tumor response to survival. This review will discuss the application of radiotracers to targeted cancer therapy. Particular attention is given to new radiotracers evaluated in recently completed clinical trials and those with current or potential clinical utility. The diverse roles of PET in clinical trails for drug development are also examined.
Keywords: Cancer biomarkers, Positron emission tomography, Clinical trials
Introduction
Advances in molecular biology have furthered our understanding of disease pathogenesis, supporting the genesis of a more sophisticated classification of disease. Whereas in the past, cancer was often solely characterized by the organ of origin, our current understanding allows for a new taxonomy based in part on the “intrinsic biology” of the tumor [1–3]. With a better understanding of the molecular biology of disease, medical treatments can be tailored to individual characteristics of each patient, so-called “precision medicine” – the preferred term endorsed by the US National Research Council [1]. The ability of imaging probes to interrogate the underlying molecular biology of disease as a biomarker has great potential to guide cancer therapy through numerous applications [4].
Traditionally, imaging evaluation of disease has been largely anatomic. In radiographic imaging, differences in x-ray attenuation of tissues enable image formation and detection of anatomic abnormalities without regard for underlying biology and pathophysiology. Such anatomic abnormalities can be used to infer biologic properties and thus contribute to the diagnosis and characterization of disease. Likewise, changes in tumor size over time can be used to assess treatment response, which remains an integral component in oncologic guidelines (e.g. RECIST 1.1 criteria [5]). Molecular imaging, though, whereby the underlying biology of disease can be probed, represents a fundamental change in this imaging paradigm [6].
As defined by the Molecular Imaging Center of Excellence and the Society of Nuclear Medicine, “molecular imaging is the visualization, characterization, and measurement of biological processes at the molecular and cellular levels in humans and other living systems,” using the techniques of nuclear medicine, magnetic resonance imaging and spectroscopy (MRI and MRS, respectively), optical imaging, and ultrasound, among others [7].
Fundamentally, MRI exploits differences in tissue local magnetic fields to produce image contrast. The addition of targeted contrast agents can provide biologic specificity and is an area of active research [8,9]. MRS yields a chemical spectrum of a volume of interest which enables identification of metabolites and characterization of tissues [10]. MRS has several oncologic applications, including characterizing brain tumors and prostate cancer [11]. Contrast-enhanced ultrasound with microbubbles targeted to intravascular receptors has been studied in inflammation, angiogenesis, and thrombosis [12,13], but is not yet available clinically. Similarly, molecularly targeted optical contrast agents have been studied, though the limited depth of penetration of light restricts its potential clinical use in vivo to intraoperative and endoscopic setting [14,15].
Biological probes can also be labeled with a radionuclide. Emissions from radioactive decay of the nuclide can be detected by external cameras and images formed, creating the basis of nuclear medicine. For radionuclides that decay by gamma-ray emissions, single-photon emission computed tomography (SPECT) can create three-dimensional image representations of the distribution of the radionuclide. Positron emission tomography (PET) can create similar image representations of the distribution of those radionuclides that decay by positron emission. Attenuation correction can be performed with data from an accompanying CT scan, which can also be used for anatomic localization (PET/CT) [16]. Relative to SPECT, PET is more sensitive in the detection of emitted events, has better spatial and temporal resolution, and more accurate quantification [17,18]. With appropriate data corrections, SPECT can also yield quantitatively accurate images; these corrections, however, are now yet routinely available in clinical practice [19]. For exact quantification of radioactivity of PET images a cylinder with a uniform concentration of radiotracer may be scanned so that a calibration factor can be calculated [16]. Recent research in PET radiotracer development has generated many new and novel imaging agents with specific molecular targets, many of which demonstrate clinical utility. For these reasons, this review will focus on recent advances in PET radiotracer development with particular attention to probes that may transform oncologic care.
Traditionally, PET/CT, using the glucose analog 18F-fluorodeoxyglucose (FDG), has been used clinically for evaluation of extent of disease prior to the start of treatment and assessment of response during or at the conclusion of a treatment – staging and restaging, respectively. These indications reflect the coverage provided by the Centers for Medicare and Medical Services [20]. PET, though, is not limited to such indications and can be used as a biomarker, the topic of this review. As defined by the Biomarkers Definitions Working Group in 2001, a biomarker is “a characteristic that is objectively measured and evaluated as an indicator of normal biological processes, pathogenic processes, or pharmacologic responses to a therapeutic intervention” [21]. PET as an imaging biomarker may be utilized to (1) measure target expression to select subsets of patients who would most benefit from targeted therapy; (2) measure early treatment response to predict therapeutic efficacy; and (3) relate tumor response to survival. Furthermore, PET biomarkers may be used as surrogate endpoints in clinical trials, decreasing trial duration and cost [22]. Treating PET as a molecular imaging biomarker greatly expands its clinical indications and utility, with direct clinical impact.
This review will highlight radiotracers used as biomarkers that are still considered investigational in the United States but have been tested in a number of human studies, including in several late-phase multi-center trials. Development and clinical studies of radiotracers primarily used for staging and restaging disease, although important components in directing cancer therapy, are not discussed in this focused mini-review.
Molecular imaging as a measure of therapeutic target expression
Non-invasive assessment of therapeutic target expression by PET can direct patients to appropriate therapy. Although biopsy remains the reference standard for a tissue diagnosis, its invasive nature limits the number of sites sampled and often prohibits serial assessment [22]. Molecular imaging is not inherently confined by such limitations; the ability to assess multiple lesions across time represents a distinct advantage. Tissue biopsy is also prone to sampling error. For example, a review of ultrasound-guided core needle biopsies for the diagnosis of breast cancer found that an average of 10% of lesions required repeat biopsy across many studies [23]. Laboratory assessment itself may also be error prone. A systematic review in 2010 demonstrated that up to 20% of immunohistochemical estrogen and progesterone receptor testing worldwide may be inaccurate [24].
Imaging receptor status in breast cancer represents an active and potentially impactful area of research. In patients with estrogen receptor (ER) positive breast cancers, endocrine therapy with tamoxifen has been shown to reduce risk of recurrence and breast cancer mortality; little or no effect was seen among ER-negative patients [25]. Receptor expression profiles of breast cancer metastases may also not match that of the primary tumor with changes in hormone receptor status having been shown to affect prognosis [26]. In a 2015 review of meta-analyses, pooled estimates for absolute frequency of change from positive primary tumors to negative metastases ranged from 5.7% to 9.5% for ER status and 17% to 24% for progesterone receptor (PR) status [27]. As expected, loss of ER expression in recurrence has been associated with a poor response to tamoxifen [28]. Estrogen receptor status can thus be used to guide targeted therapy, as reflected in recent clinical practice guidelines [27].
Imaging the estrogen receptor with 18F-fluoroestradiol (FES) PET has shown early translational success. FES uptake in tumors has been shown to correlate with in vitro assays of ER expression [29–31]. Clinically, studies have shown a correlation between pre-therapy FES levels and response [32–34]. A study of forty women with biopsy-proven advanced ER-positive breast cancer showed that patients who responded to tamoxifen had significantly greater baseline FES uptake than non-responders (standardized uptake value (SUV) ± standard deviation of 4.3 ± 2.4 vs. 1.8 ± 1.3, respectively). Interestingly, this study also showed an increase in FDG uptake in tumors of responders at 7–10 days after the initiation of tamoxifen compared to those of non-responders. This so-called metabolic flare may be an indicator of early response, as discussed in detail in the next section [32]. In a study of the response of heavily pretreated metastatic breast cancer patients to salvage hormonal therapy, quantitative FES-PET was also shown to have discriminative ability between responders and non-responders, suggesting a role for patient selection. Eleven of 32 patients with an FES SUV greater than 1.5 responded while none of the 15 patients with an SUV less than 1.5 responded [33] (see Fig. 1). A recently completed phase 2 study of FES-PET gives further support to the utility of FES in patient selection [35].
Fig. 1.
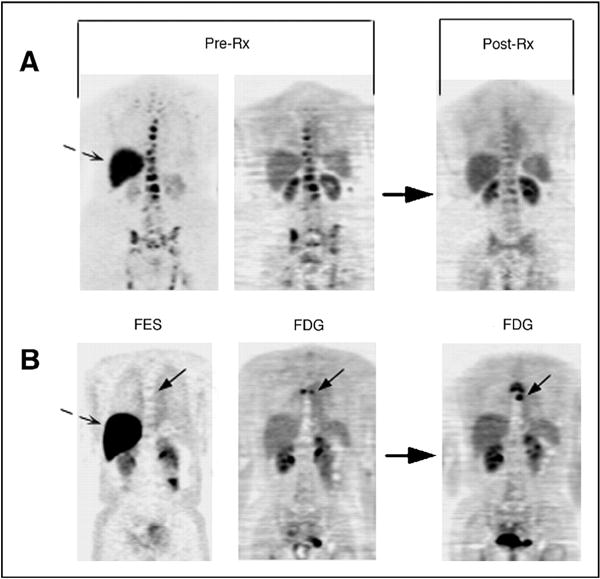
FES-PET used to predict response to hormonal therapy in metastatic breast cancer patients. Pretreatment FES-PET (FES; left) and FDG-PET (FDG; middle) scans and follow-up FDG-PET post-therapy (FDG; right) scan are shown. Bone metastasis with robust FES and FDG uptake (A; top) demonstrates response at 3 months. Bone metastasis (solid arrow) without FES uptake, but with FDG uptake (B; bottom), demonstrates progressive disease at 6 months. Dashed arrows show normal liver FES uptake. Rx, treatment. FDG images are displayed on a consistent SUV scale for each patient pre- and post-therapy. FES is displayed on a scale of 0–5. (Originally published by the American Society of Clinical Oncology [33]).
PET imaging of tumor hypoxia has proved clinically useful as a means to guide targeted chemotherapy, as well as demonstrative in the importance of patient selection in the design of clinical trails. Tumor hypoxia may induce genetic changes in cells resulting in an aggressive phenotype and has been shown to be associated with resistance to radiation and chemotherapy [36,37]. The radiation commonly used in radiotherapy (i.e. sparsely ionizing, low-linear energy transfer (LET) radiation such as x-rays and γ-rays) require molecular oxygen to generate double-stranded DNA breaks and cause cell death [37]. Tumor hypoxia as assessed by invasive means has been associated with poor outcomes in cervical cancers, head and neck cancers, and soft tissue sarcomas [38]. Moreover, modification of tissue hypoxia has also been shown to be associated with an overall survival benefit in a large systematic review of randomized trials [39]. Given these associations and available selective therapy, several PET markers of hypoxia have been created, with 18F-fluoromisonidazole (FMISO) being the most studied [40]. In hypoxic environments, FMISO is reduced and then covalently bonded to macromolecules [41]. A possible role for FMISO in patient selection has been demonstrated in head and neck cancer. In the TROG 98.02 randomized trial of patients with locally advanced squamous cell carcinoma of the head and neck treated with radiation, cisplatin, and either fluorouracil or the hypoxia-selective cytotoxic agent tirapazamine, there was a “trend in favor of the tirapazamine arm for both locoregional control and failure-free survival,” though not statistically significant [42]. However, in a subset of patients whose tumors were evaluated for hypoxia with FMISO imaging, the risk of locoregional failure in hypoxic tumors was greater in those patients not treated with the tirapazamine regimen, suggesting an indication for FMISO in patient selection [43]. As a follow-up to TROG 98.02, a larger phase III trial showed no significant difference in overall survival, failure-free survival, or time to locoregional failure, noting a measure of tumor hypoxia was not used as a selection criterion. The authors concluded that additional trials targeting hypoxia should be conducted with a “well-defined group of patients at high risk of locoregional failure as a result of tissue hypoxia” [44]. Preliminary results from the recently completed ACRIN 6684 study of FMISO-PET and MRI in newly diagnosed glioblastoma patients demonstrated baseline hypoxia was associated with shorter overall survival [45]. Previous work demonstrated other FMISO imaging parameters are associated with survival [46].
Detection of the increased glycolytic rate of tumors with the glucose analog FDG has dominated clinical PET imaging. However, tumors also consume other nutrients, including glutamine, which can be radiolabeled and exploited for both imaging and therapeutic purposes [47]. Glutamine metabolism is complex with involvement in redox homeostasis, macromolecular synthesis, protein and DNA modification, cell signaling, anaplerosis, and energy production [48]. Oncogenic Myc activation can lead to glutamine addiction, representing a possible therapeutic target [49]. Both fluorine- and carbon-labeled glutamine compounds have been synthesized and tested in pre-clinical tumor models [50–52]. In addition, the downstream glutamine derivative glutamate has been 18F-radiolabeled ((4S)-4-(3-[18F]fluoropropyl)-L-glutamate (FSPG)) and studied as a marker of the transporter system XC−, which has a role in the oxidative stress response [53]. In small clinical studies, FSPG has shown encouraging results in detecting non-small cell lung cancer hepatocellular cancer, but not in detecting breast cancer [54,55].
Molecular imaging may also be used to guide radionuclide therapy. Detection and staging with SPECT of neuroendocrine tumors with the somatostatin receptor agonist 111In-octreotide has found widespread clinical use [56]. 68Ga-labeled PET radiotracers have also been studied, noting advantageous imaging characteristics and practical considerations of 68Ga-labeled compounds compared with those labeled with 111In [57]. Clinically, 68Ga-DOTA-octreotate imaging was shown to provide additional information compared to 111In-octreotide imaging in patients with somatostatin-expressing tumors. This additional information subsequently affected patient management [58]. Given target expression, β-emitting somatostatin-targeted radionuclides have been developed targeting the somatostatin receptor, deemed peptide receptor radionuclide therapy (PRRT). Both 177Lu- and 90Y agents have been developed, the former being advantageous in that γ emission allows concomitant imaging (PRRT reviewed in Refs. 56,57,59). Preliminary results have recently become available from the Netter-1 phase III trial of 177Lu-Dotatate in patients with progressive somatostatin-receptor positive midgut neuroendocrine tumors, noting inclusion criteria for this study included a positive OctreoScan for target lesions [60]. A significant increase in progression free survival was seen in the arm receiving the radionuclide compared to the control arm receiving high-dose Octreotide LAR. There was also a suggestion of an improvement in overall survival in the radionuclide-treated arm [61]. Similarly, both diagnostic imaging and radionuclide therapy have been studied with prostate-specific membrane antigen (PSMA) targeted agents, with early clinical studies showing early promise [62].
In more pre-clinical work, imaging agents have also been developed targeting chemokine receptor 4 (CXCR4), a transmembrane protein overexpressed in many cancers and associated with aggressive behavior, metastases, recurrence, and poor survival. Numerous labeled CXCR4 ligands are currently being studied for PET, SPECT, and even fluorescence imaging [63–65]. A recent study of 14 patients with advanced multiple myeloma using [68Ga]Pentixafor demonstrated feasibility of detecting multiple myeloma lesions. With targeted CXCR-agents also in development, radiotracers targeting this receptor represent another opportunity for patient selection [66].
Molecular imaging as a measure of early treatment response
Historically, follow-up tumor imaging has been performed weeks after chemotherapy administration. For example, RECIST 1.1 specifies follow-up every 6–8 weeks may be reasonable in phase II studies if the effect of therapy is unknown [5]. Given the anatomic basis of RECIST 1.1, such an interval is rational as morphological changes in tumor size lag behind biochemical and molecular changes. Molecular imaging with PET, though, can detect such changes to potentially assess early treatment response. Therapy can be adjusted in nonresponders and possibly shortened for responders [67].
Altered cellular metabolism is an emerging hallmark of cancer [68], with detection of increased glycolysis representing the basis of FDG-PET imaging. Numerous growth factors regulate the glycolytic pathway [69], supporting the assessment of glycolysis as an indicator of early treatment response. The glycolytic response of gastrointestinal stromal tumors (GIST) to imatinib mesylate (Gleevec/Glivec, Novartis) has been particularly striking. Advanced GISTs are generally resistant to conventional chemotherapy, but have shown susceptibility to imatinib mesylate, a selective protein kinase inhibitor [70]. In a study from the New England Journal of Medicine in 2002, a sustained objective response to imatinib was achieved in greater than half of patients with advanced unresectable or metastatic GIST. Interestingly, FDG-PET was predictive of treatment response. Markedly decreased FDG uptake as early as 24 hours was seen in all patients with an eventual response after a single dose; all non-responders demonstrated increases in uptake or new active sites of disease [70]. In a more formal study of imaging as a biomarker of early response to imatinib in soft tissue sarcomas, PET response at day eight showed efficacy in predicting eventual CT response and was associated with longer progression-free survival [71]. Lastly, increases in FDG uptake after imatinib termination have been seen in imatinib-refractory GIST, suggesting a heterogeneous tumor population where some tumor clones remain susceptible to imatinib [72,73].
FDG-PET has also shown to be of value in the early assessment of breast cancer therapy. In the Neo-ALTTO study of patients with human epidermal growth factor 2 (HER2)-positive breast cancer, an early metabolic response on FDG-PET was shown to be indicative of a higher likelihood of pathologic complete response (pCR) to neoadjuvant HER2-directed therapy when given with chemotherapy [74]. Similarly, in a study of patients with HER2-negative breast cancer, early decreases in SUV corrected for lean body mass were indicative of pCR to preoperative therapy [75]. FDG-PET has also been studied prospectively to guide therapy. In the AVATAXHER trail, FDG-PET was performed before the first and second cycles of neoadjuvant chemotherapy in HER2-positive breast cancer patients. Patients predicted to be responders continued on standard therapy. Those patients predicted to be nonresponders were then randomized to receive the angiogenesis inhibitor bevacizumab (Avastin, Genentech) in addition to continued chemotherapy or to continue chemotherapy alone. Pathological complete response was seen in 37/69 (53.6%) of those noted to be responders to the initial chemotherapy; 21/48 (43.8%) of non-responders who were subsequently placed on bevacizumab; and 6/25 (24%) of non-responders who were not placed on bevacizumab. This study exemplified how early FDG-PET results can prompt treatment changes and possibly improve overall outcomes, although the sample size was relatively small [76].
Cellular proliferation markers have also been evaluated as indicators of early treatment response. Imaging the thymidine salvage pathway has been particularly attractive as thymidine is the only base uniquely found in DNA as opposed to both DNA and RNA [77]. 11C-thymidine can be directly incorporated into DNA [78]. Theoretically, thymidine imaging should be more specific for malignancy compared to FDG which demonstrates uptake by inflammation as well as by malignant tissue [78]. Although 11C-thymidine has been extensively studied and modeled, the short physical half-life of 11C and rapid catabolism of 11C-thymidine limit its use. The fluorinated compound 3′-fluorothymidine (FLT) has been most extensively studied clinically [77,78]. FLT is phosphorylated and trapped in the cell without significant metabolites, similar to FDG. Although only a small amount of FLT is incorporated into DNA, cellular uptake is dependent on thymidine kinase 1 activity of the DNA synthesis pathway so this radiotracer has been used to measure cellular proliferation [78].
In clinical trails, FLT-PET has been studied in patients with advanced non-small cell lung cancer (NSCLC) after the administration of the epidermal growth factor receptor (EGFR) tyrosine kinase inhibitor gefitinib, a cytostatic agent. Significant differences in the percent change of SUVmax at seven days post gefitinib compared to pretreatment were seen in responders versus nonresponders. When using a decrease of 10.9% in SUVmax as a threshold for predicting response, positive and negative predictive values were above 90% [79]. Of note, two large clinical trials published in 2004, INTACT 1 and INTACT 2, did not show any advantage to adding gefitinib to standard chemotherapy (gemcitabine-cisplatin or paclitaxel-carboplatin, respectively) in chemotherapy-naïve patients with advanced NSCLC [80,81]. Given that inclusion criteria for these studies did not stipulate gefitinib-sensitive EGFR mutations, ultimate clinical trial failure has been speculated to be in part due to non-specific patient selection [82]. In fact, a 2013 study specifically examining NSCLC patients with EGFR mutations showed improved progression-free survival with gefitinib compared to carboplatin-paclitaxel. EGFR mutation analysis was performed with cytologic or histologic specimens, not imaging [83]. Ultimately, the United States Food and Drug Administration approved gefitinib in July 2015 for first-line treatment of patients with metastatic NSCLC with EGFR gene mutations, as detected by an FDA-approved PCR diagnostic test [84]. In the absence of such a genetic test or when tissue sampling is impractical, molecular imaging such as with FLT-PET, as above, may prove efficacious in patient selection for targeted therapy.
Finally, early response assessment with FLT-PET has also been studied in breast cancer. A pilot study in 2007 measured FLT uptake at 90 minutes and irreversible trapping of FLT prior to and after one week of chemotherapy. Each of these parameters demonstrated discriminative power between clinical response at 60 days and stable disease [85]. In the recently completed ACRIN 6688 phase II study, FLT-PET scans were obtained prior to initiation of neoadjuvant chemotherapy (NAC), after one cycle of NAC, and after completion of NAC. FLT-PET uptake on the post-NAC scan correlated with the proliferation marker Ki-67 on surgical specimens. Ultimately, a marginal difference in the percentage change in SUVmax between the pre-therapy scan and the first post-therapy scan was found between patients with pCR and those without pCR (see Fig. 2). Of note, the NAC regimen was not specified in this study, confounding the analysis. These results, in combination with variable results from prior studies, provide the impetus for additional investigation [86].
Fig. 2.
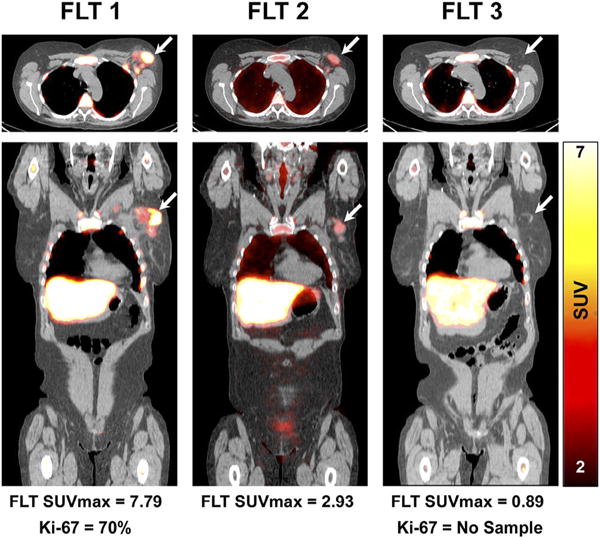
Early assessment of treatment response by FLT-PET. Fused FLT-PET/CT axial (upper) and coronal (lower) images demonstrate increased FLT uptake in an upper outer quarter breast tumor and axillary lymph node before therapy (left). After one cycle of neoadjuvant chemotherapy, there is substantial reduction in the primary breast tumor FLT uptake (middle) and resolution of FLT uptake after completion of neoadjuvant chemotherapy (right). Patient had pathologic complete response confirmed at surgery. Arrows refer to primary tumor site. This research was originally published in JNM, Ref 86. © by the Society of Nuclear Medicine and Molecular Imaging, Inc.).
Relating tumor response to survival
In addition to evaluating for early treatment response, PET/CT, particularly with FDG, has also been shown to have value in predicting survival. This has established a role for PET as a therapeutic endpoint. Numerous studies have examined PET/CT in outcome prediction NSCLC. A 2003 study showed that reduction in tumor FDG uptake after just one cycle of chemotherapy correlated with median time to progression and overall survival. The authors suggested that metabolic response criteria could be used as an endpoint in phase II studies [87]. A separate study in NSCL demonstrated post-therapy PET a better predictor of survival than CT response as evaluated on a single post-therapy CT scan [88]. The prognostic value of FDG-PET has also been shown in several other solid tumors, including esophageal cancer and head and neck cancer (reviewed in Ref. 89).
The use of PET/CT as a predictive marker for survival has been best studied in lymphoma, where the most recent response assessment criteria incorporate the use of FDG-PET. Well before the widespread clinical use of PET/CT, it was known that a residual mass after chemotherapy may not definitely harbor malignancy [90]. The introduction of PET/CT in the revised International Working Group criteria in 2007 allowed for post-treatment mass of any size to be permitted in complete remission as long as the mass was PET negative, eliminating the complete remission/unconfirmed (CRu) classification [91–93]. Updated criteria in 2014, the Lugano Classification, further refined the use of PET/CT in response assessment and recommended PET/CT as the reference standard for routine staging of FDG-avid lymphomas [94] (see Fig. 3). The incorporation of PET/CT into response assessment reflects the prognostic value of PET/CT in treated lymphomas. In Hodgkin lymphoma, both negative and positive predictive values of end-of-treatment PET/CT have been reported to be greater than 90%. Furthermore, the most recent Lugano criteria discourage surveillance scans after remission [94]. A recent prospective study from 2014 studied the use of FDG-PET/CT in patients with mediastinal large B-cell lymphoma after completion of standard chemoimmunotherapy, but with subsequent consolidation radiotherapy permitted. Using liver uptake as a threshold for a positive PET study post chemotherapy, PET was able to discriminate between those with high and low risks of both progression free survival and overall survival at five years [95].
Fig. 3.
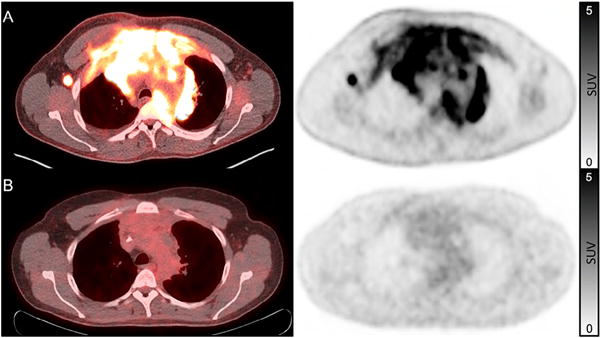
Complete metabolic response to chemotherapy in a patient with Hodgkin lymphoma. Pre-treatment fused FDG-PET/CT and FDG-PET images (A) show intense uptake in a large mediastinal mass and axillary lymphadenopathy. Post-treatment scan (B) shows a residual mediastinal mass, but without increased FDG uptake. Per the Lugano Classification, this represents a complete metabolic response and is considered a complete remission. FDG-uptake scale (SUV) is the same for both pre- and post-therapy images and is displayed on the right.
Like the lymphoma response criteria, there has been a similar evolution in the response criteria of solid tumors. PET/CT was introduced in RECIST 1.1 and further developed in PERCIST [5,96,97]. The use of PET/CT may be most beneficial in evaluating cytostatic medications which may be effective, but not result in decreased tumor size. The use of such medications suggests the need for new imaging endpoints in drug efficacy trials [98].
Conclusion
Ultimately, a successful molecular imaging biomarker should directly impact and guide patient care, whether through selection of targeted therapy, identification of early treatment response, or relating tumor response to survival. A few notable successes have truly transformed patient case, but, as detailed above, many more nuclear probes show scientific and clinical promise, but have not yet made it into the clinic.
Given the tremendous effort involved in translating a scientific idea from the laboratory into the clinic, care in the design and reporting of clinical trails becomes imperative. To “encourage transparent and complete reporting” of studies, the Reporting Recommendations for Tumor Marker Prognostic Studies, the REMARK guidelines, were developed [99] and have been widely accepted [100]. Among twenty specific recommendations for rigorous reporting, the transparency of assay methods is specifically mentioned [99], a topic particularly apropos to nuclear imaging as differences in technical factors may bias/impede imaging data. The Quantitative Imaging Biomarkers Alliance (QIBA), formed in 2007 by the Radiological Society of North America, brings together academia, government, and industry to “improve the value and practicality of quantitative imaging biomarkers by reducing variability across devices, patients and time” [101]. Among many projects, QIBA releases technical profiles detailing quantitative results that may be achieved by adhering to a protocol. Similarly, the Quantitative Imaging Network of the National Cancer Institute was created with a goal of promoting research and developing quantitative imaging methods that ultimately impact clinical decision making [102].
The ability of molecular imaging to transform oncology and patient care is just beginning to be realized. Although FDG imaging currently dominates a clinical PET scanner, new radiotracers are poised to make profound clinical impact. Such clinical tools will herald a new era of targeted cancer therapy and precision medicine.
Acknowledgments
This work was supported in part by the Susan G. Komen Foundation Grant AC140060; Department of Energy Grant DE-SC0012476; and NIH Grants U01-CA19025 and U01-CA148131. Grants support related research and support, in part, the effort of the co-authors.
Footnotes
Conflict of interest
None.
This is an invited mini-review for the special issue on new developments and important issues on targeted cancer therapy
References
- 1.National Research Council (US) Committee on A Framework for Developing a New Taxonomy of Disease. Toward Precision Medicine: Building a Knowledge Network for Biomedical Research and a New Taxonomy of Disease. National Academies Press (US); Washington (DC): 2011. [PubMed] [Google Scholar]
- 2.Farwell MD, Clark AS, Mankoff DA. How imaging biomarkers can inform clinical trials and clinical practice in the era of targeted cancer therapy. JAMA Oncol. 2015;1:421–422. doi: 10.1001/jamaoncol.2015.0667. [DOI] [PubMed] [Google Scholar]
- 3.Katsnelson A. Momentum grows to make “personalized” medicine more “precise. Nat Med. 2013;19:249. doi: 10.1038/nm0313-249. [DOI] [PubMed] [Google Scholar]
- 4.Mankoff DA, O’Sullivan F, Barlow WE, Krohn KA. Molecular imaging research in the outcomes era: measuring outcomes for individualized cancer therapy. Acad Radiol. 2007;14:398–405. doi: 10.1016/j.acra.2007.01.005. [DOI] [PMC free article] [PubMed] [Google Scholar]
- 5.Eisenhauer EA, Therasse P, Bogaerts J, Schwartz LH, Sargent D, Ford R, et al. New response evaluation criteria in solid tumours: revised RECIST guideline (version 1.1) Eur J Cancer. 2009;45:228–247. doi: 10.1016/j.ejca.2008.10.026. [DOI] [PubMed] [Google Scholar]
- 6.Massoud TF, Gambhir SS. Molecular imaging in living subjects: seeing fundamental biological processes in a new light. Genes Dev. 2003;17:545–580. doi: 10.1101/gad.1047403. [DOI] [PubMed] [Google Scholar]
- 7.Mankoff DA. A definition of molecular imaging. J Nucl Med. 2007;48:18N–21N. [PubMed] [Google Scholar]
- 8.Gallagher FA. An introduction to functional and molecular imaging with MRI. Clin Radiol. 2010;65:557–566. doi: 10.1016/j.crad.2010.04.006. [DOI] [PubMed] [Google Scholar]
- 9.Hengerer A, Grimm J. Molecular magnetic resonance imaging, Biomed. Imaging Interv J. 2006;2:e8. doi: 10.2349/biij.2.2.e8. [DOI] [PMC free article] [PubMed] [Google Scholar]
- 10.Soares DP, Law M. Magnetic resonance spectroscopy of the brain: review of metabolites and clinical applications. Clin Radiol. 2009;64:12–21. doi: 10.1016/j.crad.2008.07.002. [DOI] [PubMed] [Google Scholar]
- 11.Martín Noguerol T, Sánchez-González J, Martínez Barbero JP, García-Figueiras R, Baleato-González S, Luna A. Clinical imaging of tumor metabolism with 1H magnetic resonance spectroscopy. Magn Reson Imaging Clin N Am. 2016;24:57–86. doi: 10.1016/j.mric.2015.09.002. [DOI] [PubMed] [Google Scholar]
- 12.Kiessling F, Fokong S, Koczera P, Lederle W, Lammers T. Ultrasound microbubbles for molecular diagnosis, therapy, and theranostics. J Nucl Med. 2012;53:345–348. doi: 10.2967/jnumed.111.099754. [DOI] [PubMed] [Google Scholar]
- 13.Kaufmann BA, Lindner JR. Molecular imaging with targeted contrast ultrasound. Curr Opin Biotechnol. 2007;18:11–16. doi: 10.1016/j.copbio.2007.01.004. [DOI] [PubMed] [Google Scholar]
- 14.Hellebust A, Richards-Kortum R. Advances in molecular imaging: targeted optical contrast agents for cancer diagnostics. Nanomedicine (Lond) 2012;7:429–445. doi: 10.2217/nnm.12.12. [DOI] [PMC free article] [PubMed] [Google Scholar]
- 15.Pierce MC, Javier DJ, Richards-Kortum R. Optical contrast agents and imaging systems for detection and diagnosis of cancer. Int J Cancer. 2008;123:1979–1990. doi: 10.1002/ijc.23858. [DOI] [PMC free article] [PubMed] [Google Scholar]
- 16.Cherry SR, Sorenson JA, Phelps ME. Physics in Nuclear Medicine. 4th. 2012. [Google Scholar]
- 17.Rahmim A, Zaidi H. PET versus SPECT: strengths, limitations and challenges. Nucl Med Commun. 2008;29:193–207. doi: 10.1097/MNM.0b013e3282f3a515. [DOI] [PubMed] [Google Scholar]
- 18.Hicks RJ, Hofman MS. Is there still a role for SPECT-CT in oncology in the PET-CT era? Nat Rev Clin Oncol. 2012;9:712–720. doi: 10.1038/nrclinonc.2012.188. [DOI] [PubMed] [Google Scholar]
- 19.Ritt P, Vija H, Hornegger J, Kuwert T. Absolute quantification in SPECT. Eur J Nucl Med Mol Imaging. 2011;38(Suppl 1):S69–S77. doi: 10.1007/s00259-011-1770-8. [DOI] [PubMed] [Google Scholar]
- 20.Jacques L, Jensen T, Rollins J, Caplan S, Roche J. Decision memo for positron emission tomography (FDG) for solid tumors (CAG-00181R4) 2013 < https://www.cms.gov/medicare-coverage-database/details/nca-decision-memo.aspx?NCAId=263>. accessed 22.10.15.
- 21.Biomarkers Definitions Working Group. Biomarkers and surrogate endpoints: preferred definitions and conceptual framework. Clin Pharmacol Ther. 2001;69:89–95. doi: 10.1067/mcp.2001.113989. [DOI] [PubMed] [Google Scholar]
- 22.Mankoff DA, Pryma DA, Clark AS. Molecular imaging biomarkers for oncology clinical trials. J Nucl Med. 2014;55:525–528. doi: 10.2967/jnumed.113.126128. [DOI] [PubMed] [Google Scholar]
- 23.Youk JH, Kim EK, Kim MJ, Lee JY, Oh KK. Missed breast cancers at US-guided core needle biopsy: how to reduce them. Radiographics. 2007;27:79–94. doi: 10.1148/rg.271065029. [DOI] [PubMed] [Google Scholar]
- 24.Hammond MEH, Hayes DF, Dowsett M, Allred DC, Hagerty KL, Badve S, et al. American Society of Clinical Oncology/College of American Pathologists guideline recommendations for immunohistochemical testing of estrogen and progesterone receptors in breast cancer. J Clin Oncol. 2010;28:2784–2795. doi: 10.1200/JCO.2009.25.6529. [DOI] [PMC free article] [PubMed] [Google Scholar]
- 25.Davies C, Godwin J, Gray R, Clarke M, Cutter D, Darby S, et al. Relevance of breast cancer hormone receptors and other factors to the efficacy of adjuvant tamoxifen: patient-level meta-analysis of randomised trials. Lancet. 2011;378:771–784. doi: 10.1016/S0140-6736(11)60993-8. [DOI] [PMC free article] [PubMed] [Google Scholar]
- 26.Lindström LS, Karlsson E, Wilking UM, Johansson U, Hartman J, Lidbrink EK, et al. Clinically used breast cancer markers such as estrogen receptor, progesterone receptor, and human epidermal growth factor receptor 2 are unstable throughout tumor progression. J Clin Oncol. 2012;30:2601–2608. doi: 10.1200/JCO.2011.37.2482. [DOI] [PubMed] [Google Scholar]
- 27.Van Poznak C, Somerfield MR, Bast RC, Cristofanilli M, Goetz MP, Gonzalez-Angulo AM, et al. Use of biomarkers to guide decisions on systemic therapy for women with metastatic breast cancer: American Society of Clinical Oncology clinical practice guideline. J Clin Oncol. 2015;33:2695–2704. doi: 10.1200/JCO.2015.61.1459. [DOI] [PMC free article] [PubMed] [Google Scholar]
- 28.Kuukasjärvi T, Kononen J, Helin H, Holli K, Isola J. Loss of estrogen receptor in recurrent breast cancer is associated with poor response to endocrine therapy. J Clin Oncol. 1996;14:2584–2589. doi: 10.1200/JCO.1996.14.9.2584. [DOI] [PubMed] [Google Scholar]
- 29.Mintun MA, Welch MJ, Siegel BA, Mathias CJ, Brodack JW, McGuire AH, et al. Breast cancer: PET imaging of estrogen receptors. Radiology. 1988;169:45–48. doi: 10.1148/radiology.169.1.3262228. [DOI] [PubMed] [Google Scholar]
- 30.Peterson LM, Mankoff DA, Lawton T, Yagle K, Schubert EK, Stekhova S, et al. Quantitative imaging of estrogen receptor expression in breast cancer with PET and 18F-fluoroestradiol. J Nucl Med. 2008;49:367–374. doi: 10.2967/jnumed.107.047506. [DOI] [PubMed] [Google Scholar]
- 31.Dehdashti F, Mortimer JE, Siegel BA, Griffeth LK, Bonasera TJ, Fusselman MJ, et al. Positron tomographic assessment of estrogen receptors in breast cancer: comparison with FDG-PET and in vitro receptor assays. J Nucl Med. 1995;36:1766–1774. [PubMed] [Google Scholar]
- 32.Mortimer JE, Dehdashti F, Siegel BA, Trinkaus K, Katzenellenbogen JA, Welch MJ. Metabolic flare: indicator of hormone responsiveness in advanced breast cancer. J Clin Oncol. 2001;19:2797–2803. doi: 10.1200/JCO.2001.19.11.2797. [DOI] [PubMed] [Google Scholar]
- 33.Linden HM, Stekhova SA, Link JM, Gralow JR, Livingston RB, Ellis GK, et al. Quantitative fluoroestradiol positron emission tomography imaging predicts response to endocrine treatment in breast cancer. J Clin Oncol. 2006;24:2793–2799. doi: 10.1200/JCO.2005.04.3810. [DOI] [PubMed] [Google Scholar]
- 34.Dehdashti F, Mortimer JE, Trinkaus K, Naughton MJ, Ellis M, Katzenellenbogen JA, et al. PET-based estradiol challenge as a predictive biomarker of response to endocrine therapy in women with estrogen-receptor-positive breast cancer. Breast Cancer Res Treat. 2009;113:509–517. doi: 10.1007/s10549-008-9953-0. [DOI] [PMC free article] [PubMed] [Google Scholar]
- 35.Peterson LM, Kurland BF, Schubert EK, Link JM, Gadi VK, Specht JM, et al. A phase 2 study of 16α-[18F]-fluoro-17β-estradiol positron emission tomography (FES-PET) as a marker of hormone sensitivity in metastatic breast cancer (MBC) Mol Imaging Biol. 2014;16:431–440. doi: 10.1007/s11307-013-0699-7. [DOI] [PMC free article] [PubMed] [Google Scholar]
- 36.Harris AL. Hypoxia – a key regulatory factor in tumour growth. Nat Rev Cancer. 2002;2:38–47. doi: 10.1038/nrc704. [DOI] [PubMed] [Google Scholar]
- 37.Chan DA, Giaccia AJ. Hypoxia, gene expression, and metastasis. Cancer Metastasis Rev. 2007;26:333–339. doi: 10.1007/s10555-007-9063-1. [DOI] [PubMed] [Google Scholar]
- 38.Vaupel P, Mayer A. Hypoxia in cancer: significance and impact on clinical outcome. Cancer Metastasis Rev. 2007;26:225–239. doi: 10.1007/s10555-007-9055-1. [DOI] [PubMed] [Google Scholar]
- 39.Overgaard J. Hypoxic radiosensitization: adored and ignored. J Clin Oncol. 2007;25:4066–4074. doi: 10.1200/JCO.2007.12.7878. [DOI] [PubMed] [Google Scholar]
- 40.Chitneni SK, Palmer GM, Zalutsky MR, Dewhirst MW. Molecular imaging of hypoxia. J Nucl Med. 2011;52:165–168. doi: 10.2967/jnumed.110.075663. [DOI] [PMC free article] [PubMed] [Google Scholar]
- 41.Yang DJ, Wallace S, Cherif A, Li C, Gretzer MB, Kim EE, et al. Development of F-18-labeled fluoroerythronitroimidazole as a PET agent for imaging tumor hypoxia. Radiology. 1995;194:795–800. doi: 10.1148/radiology.194.3.7862981. [DOI] [PubMed] [Google Scholar]
- 42.Rischin D, Peters L, Fisher R, Macann A, Denham J, Poulsen M, et al. Tirapazamine, cisplatin, and radiation versus fluorouracil, cisplatin, and radiation in patients with locally advanced head and neck cancer: a randomized phase II trial of the Trans-Tasman Radiation Oncology Group (TROG 98.02) J Clin Oncol. 2004;23:79–87. doi: 10.1200/JCO.2005.01.072. [DOI] [PubMed] [Google Scholar]
- 43.Rischin D, Hicks RJ, Fisher R, Binns D, Corry J, Porceddu S, et al. Prognostic significance of [18F]-misonidazole positron emission tomography-detected tumor hypoxia in patients with advanced head and neck cancer randomly assigned to chemoradiation with or without tirapazamine: a substudy of Trans-Tasman Radiation Oncology Group. J Clin Oncol. 2006;24:2098–2104. doi: 10.1200/JCO.2005.05.2878. [DOI] [PubMed] [Google Scholar]
- 44.Rischin D, Peters LJ, O’Sullivan B, Giralt J, Fisher R, Yuen K, et al. Tirapazamine, cisplatin, and radiation versus cisplatin and radiation for advanced squamous cell carcinoma of the head and neck (TROG 02.02, HeadSTART): a phase III trial of the Trans-Tasman Radiation Oncology Group. J Clin Oncol. 2010;28:2989–2995. doi: 10.1200/JCO.2009.27.4449. [DOI] [PubMed] [Google Scholar]
- 45.Fink J, Zhang Z, Gertstner E, Muzi M, Kostakoglu L, Mintz A, et al. ACRIN 6684: multicenter phase II assessment of tumor hypoxia in glioblastoma using 18F-Fluoromisonidazole (FMISO) PET and MRI. J Nucl Med. 2015;56 [Google Scholar]
- 46.Spence AM, Muzi M, Swanson KR, O’Sullivan F, Rockhill JK, Rajendran JG, et al. Regional hypoxia in glioblastoma multiforme quantified with [18F]fluoromisonidazole positron emission tomography before radiotherapy: correlation with time to progression and survival. Clin Cancer Res. 2008;14:2623–2630. doi: 10.1158/1078-0432.CCR-07-4995. [DOI] [PMC free article] [PubMed] [Google Scholar]
- 47.Rajagopalan KN, DeBerardinis RJ. Role of glutamine in cancer: therapeutic and imaging implications. J Nucl Med. 2011;52:1005–1008. doi: 10.2967/jnumed.110.084244. [DOI] [PMC free article] [PubMed] [Google Scholar]
- 48.Hensley CT, Wasti AT, DeBerardinis RJ. Glutamine and cancer: cell biology, physiology, and clinical opportunities. J Clin Invest. 2013;123:3678–3684. doi: 10.1172/JCI69600. [DOI] [PMC free article] [PubMed] [Google Scholar]
- 49.Wise DR, DeBerardinis RJ, Mancuso A, Sayed N, Zhang XY, Pfeiffer HK, et al. Myc regulates a transcriptional program that stimulates mitochondrial glutaminolysis and leads to glutamine addiction. Proc Natl Acad Sci USA. 2008;105:18782–18787. doi: 10.1073/pnas.0810199105. [DOI] [PMC free article] [PubMed] [Google Scholar]
- 50.Qu W, Oya S, Lieberman BP, Ploessl K, Wang L, Wise DR, et al. Preparation and characterization of L-[5-11C]-glutamine for metabolic imaging of tumors. J Nucl Med. 2011;53:98–105. doi: 10.2967/jnumed.111.093831. [DOI] [PubMed] [Google Scholar]
- 51.Lieberman BP, Ploessl K, Wang L, Qu W, Zha Z, Wise DR, et al. PET imaging of glutaminolysis in tumors by 18F-(2S,4R)4-fluoroglutamine. J Nucl Med. 2011;52:1947–1955. doi: 10.2967/jnumed.111.093815. [DOI] [PubMed] [Google Scholar]
- 52.Wu Z, Zha Z, Li G, Lieberman BP, Choi SR, Ploessl K, et al. [(18)F](2S,4S)-4-(3-Fluoropropyl)glutamine as a tumor imaging agent. Mol Pharm. 2014;11:3852–3866. doi: 10.1021/mp500236y. [DOI] [PMC free article] [PubMed] [Google Scholar]
- 53.Koglin N, Mueller A, Berndt M, Schmitt-Willich H, Toschi L, Stephens AW, et al. Specific PET imaging of xC-transporter activity using a 18F-labeled glutamate derivative reveals a dominant pathway in tumor metabolism. Clin Cancer Res. 2011;17:6000–6011. doi: 10.1158/1078-0432.CCR-11-0687. [DOI] [PubMed] [Google Scholar]
- 54.Baek S, Choi CM, Ahn SH, Lee JW, Gong G, Ryu JS, et al. Exploratory clinical trial of (4S)-4-(3-[18F]fluoropropyl)-L-glutamate for imaging xC-transporter using positron emission tomography in patients with non-small cell lung or breast cancer. Clin Cancer Res. 2012;18:5427–5437. doi: 10.1158/1078-0432.CCR-12-0214. [DOI] [PubMed] [Google Scholar]
- 55.Baek S, Mueller A, Lim YS, Lee HC, Lee YJ, Gong G, et al. 4S)-4-(3-18F-fluoropropyl)-L-glutamate for imaging of xC transporter activity in hepatocellular carcinoma using PET: preclinical and exploratory clinical studies. J Nucl Med. 2013;54:117–123. doi: 10.2967/jnumed.112.108704. [DOI] [PubMed] [Google Scholar]
- 56.Chatalic KLS, Kwekkeboom DJ, de Jong M. Radiopeptides for imaging and therapy: a radiant future. J Nucl Med. 2015;56:1809–1812. doi: 10.2967/jnumed.115.161158. [DOI] [PubMed] [Google Scholar]
- 57.Bison SM, Konijnenberg MW, Melis M, Pool SE, Bernsen MR, Teunissen JJM, et al. Peptide receptor radionuclide therapy using radiolabeled somatostatin analogs: focus on future developments. Clin Transl Imaging. 2014;2:55–66. doi: 10.1007/s40336-014-0054-2. [DOI] [PMC free article] [PubMed] [Google Scholar]
- 58.Hofman MS, Kong G, Neels OC, Eu P, Hong E, Hicks RJ. High management impact of Ga-68 DOTATATE (GaTate) PET/CT for imaging neuroendocrine and other somatostatin expressing tumours. J Med Imaging Radiat Oncol. 2012;56:40–47. doi: 10.1111/j.1754-9485.2011.02327.x. [DOI] [PubMed] [Google Scholar]
- 59.Sabet A, Biersack HJ, Ezziddin S. Advances in peptide receptor radionuclide therapy. Semin Nucl Med. 2016;46:40–46. doi: 10.1053/j.semnuclmed.2015.09.005. [DOI] [PubMed] [Google Scholar]
- 60.Advanced Accelerator Applications. A study comparing treatment with 177Lu-DOTA0-Tyr3-octreotate to octreotide LAR in patients with inoperable, progressive, somatostatin receptor positive midgut carcinoid tumours – full text view. ClinicalTrials.gov. < https://clinicaltrials.gov/ct2/show/NCT01578239?term=NCT01578239&rank=1>, n.d (accessed 15.04.16)
- 61.Strosberg JR, Wolin EM, Chasen B, Kulke MH, Bushnell DL, Caplin ME, et al. NETTER-1 phase III: progression-free survival, radiographic response, and preliminary overall survival results in patients with midgut neuroendocrine tumors treated with 177-Lu-Dotatate | 2016 Gastrointestinal Cancers Symposium | Abstracts | Meeting Libr. < http://meetinglibrary.asco.org/content/160126-173>, n.d (accessed 15.04.16)
- 62.Lütje S, Heskamp S, Cornelissen AS, Poeppel TD, van den Broek SAMW, Rosenbaum-Krumme S, et al. PSMA ligands for radionuclide imaging and therapy of prostate cancer: clinical status. Theranostics. 2015;5:1388–1401. doi: 10.7150/thno.13348. [DOI] [PMC free article] [PubMed] [Google Scholar]
- 63.Woodard LE, Nimmagadda S. CXCR4-based imaging agents. J Nucl Med. 2011;52:1665–1669. doi: 10.2967/jnumed.111.097733. [DOI] [PMC free article] [PubMed] [Google Scholar]
- 64.Kuil J, Buckle T, van Leeuwen FWB. Imaging agents for the chemokine receptor 4 (CXCR4) Chem Soc Rev. 2012;41:5239–5261. doi: 10.1039/c2cs35085h. [DOI] [PubMed] [Google Scholar]
- 65.Weiss ID, Jacobson O. Molecular imaging of chemokine receptor CXCR4. Theranostics. 2013;3:76–84. doi: 10.7150/thno.4835. [DOI] [PMC free article] [PubMed] [Google Scholar]
- 66.Philipp-Abbrederis K, Herrmann K, Knop S, Schottelius M, Eiber M, Lückerath K, et al. In vivo molecular imaging of chemokine receptor CXCR4 expression in patients with advanced multiple myeloma. EMBO Mol Med. 2015;7:477–487. doi: 10.15252/emmm.201404698. [DOI] [PMC free article] [PubMed] [Google Scholar]
- 67.Farwell MD, Pryma DA, Mankoff DA. PET/CT imaging in cancer: current applications and future directions. Cancer. 2014;120(22):3433–3445. doi: 10.1002/cncr.28860. [DOI] [PubMed] [Google Scholar]
- 68.Hanahan D, Weinberg RA. Hallmarks of cancer: the next generation. Cell. 2011;144:646–674. doi: 10.1016/j.cell.2011.02.013. [DOI] [PubMed] [Google Scholar]
- 69.Jones RG, Thompson CB. Tumor suppressors and cell metabolism: a recipe for cancer growth. Genes Dev. 2009;23:537–548. doi: 10.1101/gad.1756509. [DOI] [PMC free article] [PubMed] [Google Scholar]
- 70.Demetri GD, von Mehren M, Blanke CD, Van den Abbeele AD, Eisenberg B, Roberts PJ, et al. Efficacy and safety of imatinib mesylate in advanced gastrointestinal stromal tumors. N Engl J Med. 2002;347:472–480. doi: 10.1056/NEJMoa020461. [DOI] [PubMed] [Google Scholar]
- 71.Stroobants S, Goeminne J, Seegers M, Dimitrijevic S, Dupont P, Nuyts J, et al. 18FDG-Positron emission tomography for the early prediction of response in advanced soft tissue sarcoma treated with imatinib mesylate (Glivec) Eur J Cancer. 2003;39:2012–2020. doi: 10.1016/s0959-8049(03)00073-x. [DOI] [PubMed] [Google Scholar]
- 72.Van den Abbeele AD. The lessons of GIST – PET and PET/CT: a new paradigm for imaging. Oncologist. 2008;13(Suppl 2):8–13. doi: 10.1634/theoncologist.13-S2-8. [DOI] [PubMed] [Google Scholar]
- 73.Van Den Abbeele AD, Badawi RD, Manola J, Morgan JA, Desai J, Kazanovicz A, et al. Effects of cessation of imatinib mesylate (IM) therapy in patients (pts) with IM-refractory gastrointestinal stromal tumors (GIST) as visualized by FDG-PET scanning. ASCO Meet Abstr. 2004;22:3012. [Google Scholar]
- 74.Gebhart G, Gamez C, Holmes E, Robles J, Garcia C, Cortes M, et al. 18F-FDG PET/CT for early prediction of response to neoadjuvant lapatinib, trastuzumab, and their combination in HER2-positive breast cancer: results from Neo-ALTTO. J Nucl Med. 2013;54:1862–1868. doi: 10.2967/jnumed.112.119271. [DOI] [PubMed] [Google Scholar]
- 75.Connolly RM, Leal JP, Goetz MP, Zhang Z, Zhou XC, Jacobs LK, et al. TBCRC 008: early change in 18F-FDG uptake on PET predicts response to preoperative systemic therapy in human epidermal growth factor receptor 2-negative primary operable breast cancer. J Nucl Med. 2014;56:31–37. doi: 10.2967/jnumed.114.144741. [DOI] [PMC free article] [PubMed] [Google Scholar]
- 76.Coudert B, Pierga JY, Mouret-Reynier MA, Kerrou K, Ferrero JM, Petit T, et al. Use of [(18)F]-FDG PET to predict response to neoadjuvant trastuzumab and docetaxel in patients with HER2-positive breast cancer, and addition of bevacizumab to neoadjuvant trastuzumab and docetaxel in [(18)F]-FDG PET-predicted non-responders (AVATAXHER) Lancet Oncol. 2014;15:1493–1502. doi: 10.1016/S1470-2045(14)70475-9. [DOI] [PubMed] [Google Scholar]
- 77.Bading JR, Shields AF. Imaging of cell proliferation: status and prospects. J Nucl Med. 2008;49(Suppl 2):64S–80S. doi: 10.2967/jnumed.107.046391. [DOI] [PubMed] [Google Scholar]
- 78.Mankoff DA, Shields AF, Krohn KA. PET imaging of cellular proliferation. Radiol Clin North Am. 2005;43:153–167. doi: 10.1016/j.rcl.2004.09.005. [DOI] [PubMed] [Google Scholar]
- 79.Sohn HJ, Yang YJ, Ryu JS, Oh SJ, Im KC, Moon DH, et al. [18F]Fluorothymidine positron emission tomography before and 7 days after gefitinib treatment predicts response in patients with advanced adenocarcinoma of the lung. Clin Cancer Res. 2008;14:7423–7429. doi: 10.1158/1078-0432.CCR-08-0312. [DOI] [PubMed] [Google Scholar]
- 80.Giaccone G, Herbst RS, Manegold C, Scagliotti G, Rosell R, Miller V, et al. Gefitinib in combination with gemcitabine and cisplatin in advanced non-small-cell lung cancer: a phase III trial – INTACT 1. J Clin Oncol. 2004;22:777–784. doi: 10.1200/JCO.2004.08.001. [DOI] [PubMed] [Google Scholar]
- 81.Herbst RS, Giaccone G, Schiller JH, Natale RB, Miller V, Manegold C, et al. Gefitinib in combination with paclitaxel and carboplatin in advanced non-small-cell lung cancer: a phase III trial – INTACT 2. J Clin Oncol. 2004;22:785–794. doi: 10.1200/JCO.2004.07.215. [DOI] [PubMed] [Google Scholar]
- 82.Millar AW, Lynch KP. Rethinking clinical trials for cytostatic drugs. Nat Rev Cancer. 2003;3:540–545. doi: 10.1038/nrc1124. [DOI] [PubMed] [Google Scholar]
- 83.Maemondo M, Inoue A, Kobayashi K, Sugawara S, Oizumi S, Isobe H, et al. Gefitinib or chemotherapy for non-small-cell lung cancer with mutated EGFR. N Engl J Med. 2010;362:2380–2388. doi: 10.1056/NEJMoa0909530. [DOI] [PubMed] [Google Scholar]
- 84.Peddicord S. Press announcements – FDA approves targeted therapy for first-line treatment of patients with a type of metastatic lung cancer. 2015 < http://www.fda.gov/NewsEvents/Newsroom/PressAnnouncements/ucm454678.htm>. accessed 21.09.15.
- 85.Kenny L, Coombes RC, Vigushin DM, Al-Nahhas A, Shousha S, Aboagye EO. Imaging early changes in proliferation at 1 week post chemotherapy: a pilot study in breast cancer patients with 3′-deoxy-3′-[18F]fluorothymidine positron emission tomography. Eur J Nucl Med Mol Imaging. 2007;34:1339–1347. doi: 10.1007/s00259-007-0379-4. [DOI] [PubMed] [Google Scholar]
- 86.Kostakoglu L, Duan F, Idowu MO, Jolles PR, Bear HD, Muzi M, et al. A phase II study of [(18)F]-3′deoxy-3′-fluorothymidine positron emission tomography (FLT-PET) in the asessment of early response of breast cancer to neoadjuvant chemotherapy: Results from ACRIN 6688. J Nucl Med. 2015;56:1681–1689. doi: 10.2967/jnumed.115.160663. [DOI] [PMC free article] [PubMed] [Google Scholar]
- 87.Weber WA. Positron emission tomography in non-small-cell lung cancer: prediction of response to chemotherapy by quantitative assessment of glucose use. J Clin Oncol. 2003;21:2651–2657. doi: 10.1200/JCO.2003.12.004. [DOI] [PubMed] [Google Scholar]
- 88.Mac Manus MP, Hicks RJ, Matthews JP, McKenzie A, Rischin D, Salminen EK, et al. Positron emission tomography is superior to computed tomography scanning for response-assessment after radical radiotherapy or chemoradiotherapy in patients with non-small-cell lung cancer. J Clin Oncol. 2003;21:1285–1292. doi: 10.1200/JCO.2003.07.054. [DOI] [PubMed] [Google Scholar]
- 89.Weber WA. Use of PET for monitoring cancer therapy and for predicting outcome. J Nucl Med. 2005;46:983–995. [PubMed] [Google Scholar]
- 90.Surbone A, Longo DL, DeVita VT, Ihde DC, Duffey PL, Jaffe ES, et al. Residual abdominal masses in aggressive non-Hodgkin’s lymphoma after combination chemotherapy: significance and management. J Clin Oncol. 1988;6:1832–1837. doi: 10.1200/JCO.1988.6.12.1832. [DOI] [PubMed] [Google Scholar]
- 91.Cheson BD, Horning SJ, Coiffier B, Shipp MA, Fisher RI, Connors JM, et al. Report of an international workshop to standardize response criteria for non-Hodgkin’s lymphomas. NCI Sponsored International Working Group. J Clin Oncol. 1999;17:1244. doi: 10.1200/JCO.1999.17.4.1244. [DOI] [PubMed] [Google Scholar]
- 92.Cheson BD, Pfistner B, Juweid ME, Gascoyne RD, Specht L, Horning SJ, et al. Revised response criteria for malignant lymphoma. J Clin Oncol. 2007;25:579–586. doi: 10.1200/JCO.2006.09.2403. [DOI] [PubMed] [Google Scholar]
- 93.Juweid ME, Stroobants S, Hoekstra OS, Mottaghy FM, Dietlein M, Guermazi A, et al. Use of positron emission tomography for response assessment of lymphoma: consensus of the Imaging Subcommittee of International Harmonization Project in Lymphoma. J Clin Oncol. 2007;25:571–578. doi: 10.1200/JCO.2006.08.2305. [DOI] [PubMed] [Google Scholar]
- 94.Cheson BD, Fisher RI, Barrington SF, Cavalli F, Schwartz LH, Zucca E, et al. Recommendations for initial evaluation, staging, and response assessment of Hodgkin and non-Hodgkin lymphoma: the Lugano classification. J Clin Oncol. 2014;32:3059–3068. doi: 10.1200/JCO.2013.54.8800. [DOI] [PMC free article] [PubMed] [Google Scholar]
- 95.Martelli M, Ceriani L, Zucca E, Zinzani PL, Ferreri AJM, Vitolo U, et al. 18F]fluorodeoxyglucose positron emission tomography predicts survival after chemoimmunotherapy for primary mediastinal large B-cell lymphoma: results of the International Extranodal Lymphoma Study Group IELSG-26 Study. J Clin Oncol. 2014;32:1769–1775. doi: 10.1200/JCO.2013.51.7524. [DOI] [PubMed] [Google Scholar]
- 96.Therasse P, Arbuck SG, Eisenhauer EA, Wanders J, Kaplan RS, Rubinstein L, et al. New guidelines to evaluate the response to treatment in solid tumors. J Natl Cancer Inst. 2000;92:205–216. doi: 10.1093/jnci/92.3.205. [DOI] [PubMed] [Google Scholar]
- 97.Wahl RL, Jacene H, Kasamon Y, Lodge MA. From RECIST to PERCIST: evolving Considerations for PET response criteria in solid tumors. J Nucl Med. 2009;50(Suppl 1):122S–50S. doi: 10.2967/jnumed.108.057307. [DOI] [PMC free article] [PubMed] [Google Scholar]
- 98.Michaelis LC, Ratain MJ. Measuring response in a post-RECIST world: from black and white to shades of grey. Nat Rev Cancer. 2006;6:409–414. doi: 10.1038/nrc1883. [DOI] [PubMed] [Google Scholar]
- 99.McShane LM, Altman DG, Sauerbrei W, Taube SE, Gion M, Clark GM. Reporting recommendations for tumor marker prognostic studies (REMARK) J Natl Cancer Inst. 2005;97:1180–1184. doi: 10.1093/jnci/dji237. [DOI] [PubMed] [Google Scholar]
- 100.McShane LM, Hayes DF. Publication of tumor marker research results: the necessity for complete and transparent reporting. J Clin Oncol. 2012;30:4223–4232. doi: 10.1200/JCO.2012.42.6858. [DOI] [PMC free article] [PubMed] [Google Scholar]
- 101.Quantitative Imaging Biomarkers Alliance (QIBA) < http://rsna.org/QIBA>, n.d. (accessed 14.10.15)
- 102.Quantitative Imaging Network. Cancer Imaging Program – National Cancer Institute. < http://imaging.cancer.gov/programsandresources/specializedinitiatives/qin>, n.d. (accessed 14.10.15)