

Abstract
Reductions in bioenergetic fluxes, mitochondrial enzyme activities, and mitochondrial number are observed in Alzheimer’s disease (AD). Preclinical work indicates estrogen pathway signaling by either estrogen or selective β estrogen receptor (ERβ) agonists benefits these parameters. To assess whether an ERβ agonist could improve mitochondrial function in actual AD subjects, we administered S-equol (10 mg twice daily) to 15 women with AD and determined the platelet mitochondria cytochrome oxidase (COX) activity before initiating S-equol (lead-in), after two weeks of S-equol (active treatment), and two weeks after stopping S-equol (wash-out). Because the intra-individual variation of this enzyme across samples taken at different times was unknown we used a nonparametric, single-arm, dichotomous endpoint that classified subjects whose active treatment COX activity exceeded the average of their lead-in and wash-out measures as positive responders. Eleven positive responses were observed (p<0.06). The implications of this finding on our null hypothesis (that S-equol does not influence platelet mitochondria COX activity) are discussed. To our knowledge, this is the first time a direct mitochondrial target engagement biomarker has been utilized in an AD clinical study.
Keywords: Alzheimer’s disease, biomarker, cytochrome oxidase, mitochondria, S-equol
Introduction
Interventions to eliminate or slow Alzheimer’s disease (AD) cognitive decline and neurodegeneration are urgently needed. Attempts to develop effective interventions currently focus on preventing, reducing, or reversing recognized AD pathologies, for example by limiting the production or accumulation of brain beta-amyloid protein. Other proposed disease modification targets include mitochondrial and bioenergetic function [1]. In AD subject brains and other tissues various mitochondria-localized enzymes show reduced activity [2, 3], and in most neurons intact mitochondria are numerically reduced [4]. Perturbed glucose and oxygen utilization, which could reflect impaired mitochondrial function, are also observed [5, 6].
Estrogen has pro-mitochondrial effects [7]. Estrogen receptor (ER) β may mediate some of these effects [8]. ERβ is found within mitochondria, and ERβ activation reportedly stimulates mitochondrial function. ERβ has also been implicated in mitochondrial biogenesis, the process through which new mitochondria are generated within cells, and which partly determines a cell’s mitochondrial mass [9].
S-equol is an ERβ agonist produced through the metabolism of an isoflavone component of soy, daidzein, by intestinal bacteria [10]. It was previously shown that S-equol, used in conjunction with daidzein and a third isoflavone, genistein, increased respiratory and maximal glycolysis fluxes in rat hippocampal neurons, as well as cytochrome oxidase (COX) activity and COX1 protein levels in brains from ovariectomized mice [11]. S-equol has already been studied in human subjects to assess its health impact [10, 12–14]. For these reasons, we considered whether S-equol could potentially improve mitochondrial function in AD patients. To begin to explore this possibility we conducted a pilot clinical study of S-equol in AD subjects, using a mitochondrial target engagement biomarker to inform our primary outcome measure.
Methods
Participants
The S-equol in AD (SEAD) study (ClinicalTrials.gov identifier NCT02142777) was approved by the Kansas University Medical Center Human Subjects Committee and informed consent was obtained for all participants. AD subjects were recruited through the University of Kansas Alzheimer’s Disease Center (KU ADC). The KU ADC maintains a clinical cohort whose routine characterizations include Clinical Dementia Rating (CDR) scale evaluations, uniform data set (UDS) cognitive testing, and APOE genotyping. The diagnosis of clinic cohort participants is based primarily on CDR and UDS data. Subjects diagnosed with AD further meet current McKhann el al. criteria for that diagnosis [15].
Study organization
Participants had to be female and have very mild (CDR 0.5) or mild (CDR 1) AD. We enrolled only women because at the time this study was designed, for the specific S-equol formulation we used there was less available male safety data than female safety data. We therefore limited enrollment to women for safety reasons. Each participant was required to have a study partner. As part of the informed consent process, participants and study partners were told during different parts of the study participants would receive either an S-equol or inert placebo capsule. The placebo could not be distinguished from the S-equol by sight, touch, or taste so although the investigators knew what participants were receiving at any given point the participants were blind to the actual treatment. This was, therefore, a single-blind study with cross-overs from placebo to active treatment, and then back to placebo. Ausio Pharmaceuticals, LLC (Cincinnati, OH) provided the S-equol and placebo capsules.
Upon enrolling subjects received a two-week supply of study medication, which uniformly consisted of placebo, and were instructed to take the study medication twice daily. After this two-week period participants returned to the KU ADC clinical trials unit (CTU) for their first study visit (visit 1; lead-in evaluation). Visit 1 procedures included an assessment of study medication compliance, vital signs, a query for perceived side effects, the Montreal Cognitive Assessment (MoCA), and a 40 ml phlebotomy; the blood was used to measure platelet mitochondria cytochrome oxidase (COX) and citrate synthase (CS) activities. At the completion of this visit the next two weeks of study medication was dispensed, which uniformly consisted of 10 mg S-equol capsules.
After this second two-week period participants returned to the KU ADC CTU for their second study visit (visit 2; active treatment evaluation). We repeated the same procedures that were performed during the lead-in evaluation and dispensed the next two weeks of study medication, which at this point uniformly consisted of placebo.
After this final two-week period the participants returned to the KU ADC CTU for their third study visit (visit 3; wash-out evaluation). The lead-in and active treatment evaluation procedures were performed again, which completed participation.
To determine treatment compliance, at relevant visits the difference between the number of capsules remaining in a bottle and the number it originally contained was determined. This difference was assumed to represent the number of capsules consumed, and dividing that value by the number of capsules that should have been consumed generated the compliance percentage. When numerators were lower than denominators (which most likely represents a consequence of missing doses), compliance was calculated to be less than 100%. When numerators exceeded denominators (which most likely represents a consequence of consuming extra doses), compliance was calculated to be more than 100%.
Enzyme activity measurements
Forty ml blood samples were collected in tubes containing acid-citrate-dextrose (ACD) tubes as an anticoagulant, and maintained at room temperature. Within 24 hours of phlebotomy the blood was processed by the KU ADC Mitochondrial Genomics and Metabolism Core. To initiate the processing procedure platelets were isolated by centrifugation and enriched mitochondrial fractions prepared using previously described methods [16], which involved nitrogen cavitation to rupture platelets followed by centrifugation to collect mitochondria. The protein concentrations of the enriched mitochondrial fractions were measured using a BCA protein assay kit (BioRad, Hercules, CA).
The raw COX Vmax was determined as a pseudo first order-rate constant (sec−1/mg) by measuring the oxidation of reduced cytochrome c at 550 nm [3, 16]. To correct for inter-sample differences in mitochondrial mass we measured each sample’s citrate synthase (CS) Vmax activity (μmol/sec/mg). The CS assay was performed spectrophotometrically by following the formation of 5-thio-2-nitrobenzoate (412 nm) following the addition of 100 μM oxaloacetate at 30°C [16]. Referencing the COX activity for each sample to its corresponding CS activity generated a final value whose unit was μmol−1.
Outcomes and Analysis
We designated an S-equol-associated modification of platelet mitochondria COX activity as our primary measure of interest. To determine whether an S-equol-associated change in platelet mitochondria COX activity occurred for an individual participant we used all three measures from visits 1-3. Our one-sided null hypothesis that S-equol would not increase these measures allowed for an unspecified linear trajectory in COX activity over time (i.e., this trajectory could be increasing, decreasing, or steady over time at the population level). At the time of this trial such information was unknown, but of interest.
To facilitate a small study with limited participants, we utilized an exact binomial test for inference. Specifically, we identified a subject as having increased COX activity, which we labeled as a “positive response,” if their visit 2 measure was higher than the average of their visit 1 and 3 measures. While this strategy was similar in many ways to a sign test for a pre-post design, this particular strategy protected against temporal linear trends, as noted above. In other words, it allowed us to take into account that underlying increases in COX activity over time, if such occurred, could bias a simpler pre-post design towards rejecting the null hypothesis, and underlying decreases in COX activity over time, if such occurred, could bias towards accepting the null hypothesis. While randomization of treatment order for a two-time point design alleviates such potential temporal bias, the design selected here also provides increased knowledge with respect to whether such temporal trends exist. Further, when we planned this study the intra-individual variation for COX activity measurements taken even over a short time period was simply not known.
Having all participants receive S-equol enhanced our ability to observe treatment-related adverse events. It also increased the possibility that we would be able to compare APOE categories. All these considerations factored into our decision to collect three measures with an off-on-off (visits 1–3, respectively) design.
Secondary outcomes included a safety analysis of the S-equol 10 mg twice per day dose and an analysis of MoCA scores. Although APOE genotype did not inform subject selection, we also planned a post-hoc, secondary analysis of the cognitive and enzyme activity data after stratifying participants by APOE status. These secondary goals were also considered during the design phase of this study when alternative approaches were considered (see discussion).
For the null distribution we assumed S-equol to be at best entirely inert, and thus our primary measure would produce a response and non-response from any given subject with equal probability (0.5 for each). Under this assumption the probability of observing 11 or more subjects out of 15 with a response as defined above would be quite rare, and predictably occur with a probability of <0.06. Thus, the type I error rate for this test was constrained to <0.06.
If in fact S-equol was not inert and did increase COX activity (i.e., our research hypothesis), then the probability of observing 11 or more subjects with a response (as defined above) was greater than 0.8 (i.e., >80% power) if that probability was truly 0.8, and if it was only 0.7 for the true probability there was still a greater than 50% chance of rejecting an untrue null of S-equol being inert. Adjustment to a threshold requiring 12 or more to respond dropped the type I error rate to <0.02, and correspondingly decreased the chance of rejecting the null to <0.65 if the true probability was 0.8, and to <0.30 if the true probability was 0.7.
Data derived from continuous measures were summarized by means, standard deviations, and ranges. Continuous measures data between groups or time-points were compared using linear contrasts from mixed models, which were assessed using residual analyses. Resulting test p-values are reported. Fisher’s exact test was used to compare response rates across APOE genotype status.
To assist analyses of the off-on-off treatment enzyme activity and MoCA values for each individual participant, we additionally calculated the percent change between the lead-in and active treatment values and the lead-in and wash-out values for each participant. This allowed us to summarize group off-on-off treatment parameters as both absolute values and percent changes.
Design operating characteristics were calculated using RStudio. Statistical analyses were performed using SAS version 9.4.
Results
Sixteen participants enrolled in this study. One participant withdrew after the lead-in visit and before taking their first S-equol pill, as she no longer wished to participate. Data from this participant were not included in any analysis. The other 15 participants completed the study. For these 15 subjects 8 were APOE4 carriers (7 with an APOE 3/4 genotype, 1 with an APOE 2/4 genotype), and 7 were non-APOE4 carriers (all 7 had an APOE 3/3 genotype). Age means and baseline MoCA score ranges are shown in Table 1.
Table 1.
Participant APOE status, ages, and MoCA ranges. Ages between APOE4 carriers and non-carriers were not significantly different (p=0.18). SD=standard deviation.
| Number of Participants | Age (Mean±SD) |
Age (Range) |
MoCA Baseline (Range) |
|
|---|---|---|---|---|
| Total | 15 | 73.5±7.8 | 62-89 | 6-25 |
| APOE4 Carriers | 8 | 70.9±6.2 | 63-82 | 7-25 |
| APOE4 non-Carriers | 7 | 76.3±8.9 | 62-89 | 6-17 |
No drug-related adverse events occurred during the course of the study. Compliance ranged between 79% and 116%, with a mean compliance of 96.4%. Mean MoCA scores were similar between visits (Table 2). As the distribution of MoCA scores between participants was quite variable, in addition to summarizing MoCA scores by means and standard errors we also calculated for each participant the percent change between their visit 1 and visit 2 scores, as well as the percent change between their visit 1 and visit 3 scores, and plotted the mean percent changes for the total, APOE4 carrier, and APOE4 non-carrier groups (Figure 1). While no significant differences between visits were similarly observed with this analysis (p=0.98), between visit 1 and visit 2 the percent MoCA score changes were in a downward direction for APOE4 carriers, and in an upward direction for APOE4 non-carriers (p=0.96).
Table 2.
MoCA scores. No significant differences were observed between visits (p=0.92), or between APOE4 carriers and non-carriers (p=0.26). SD=standard deviation.
| Number of Participants | MoCA Visit 1 (Mean±SD) |
MoCA Visit 2 (Mean+SD) |
MoCA Visit 3 (Mean±SD) |
|
|---|---|---|---|---|
| Total | 15 | 14.3±5.6 | 14.6±6.4.4 | 14.3±6.4 |
| APOE4 Carriers | 8 | 16.4±7.2 | 15.8±7.2 | 15.9±7.7 |
| APOE4 non-Carriers | 7 | 12.0±3.9 | 13.3±5.6 | 12.4±4.3 |
Figure 1.
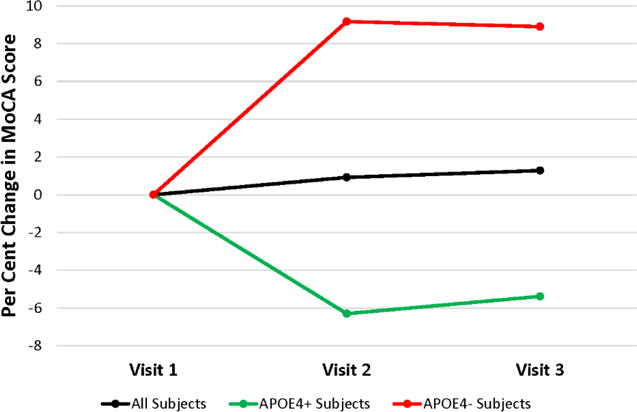
Inter-visit mean percent change in MoCA scores. The percent change between the visit 1 and visit 2 scores, as well as the visit 1 and visit 3 scores, is shown. The black line includes data from all 15 subjects, the green line includes data from the 8 APOE4 carriers, and the red line includes data from the 7 non-APOE carriers.
After correcting for the degree of mitochondrial enrichment from each assayed sample by referencing COX activity to CS activity, 11 of the 15 participants were found to have a positive response pattern in which the active treatment COX/CS activity (visit 2) exceeded the average of their lead-in and wash-out measures (from visits 1 and 3) (p<0.06). Based on our a priori operating characteristics, this outcome directed us to reject the null hypothesis. There were no apparent differences in response across APOE4 carriers and non-carriers, as responders included 6 of the 8 APOE4 carriers (75%) and 5 of the 7 non-APOE4 carriers (71%) (p>0.99).
Figure 2A shows the COX/CS response patterns for all 15 participants who completed the study, and illustrates one of the participants, a non-APOE4 carrier that was counted as a responder, generated COX/CS values that were several-fold higher than the data from the other 14 participants. For this participant the COX/mg protein data were consistent with that of the other 14 participants, but the CS data were exceptionally low. Low CS measurements in this case were determined to be a consequence of the acetyl CoA stock solution that was included in the CS assay buffer used for that participant’s visit 1 assessment. This acetyl CoA stock was used intentionally for the participant’s visit 2 and 3 measurements to facilitate inter-visit comparisons. If this protocol violation-subject is excluded from the analysis, 10 of 14 subjects qualify for responder status (p<0.09) and the primary outcome data remain essentially consistent with a relatively small type I error associated with our decision to reject the null hypothesis.
Figure 2.
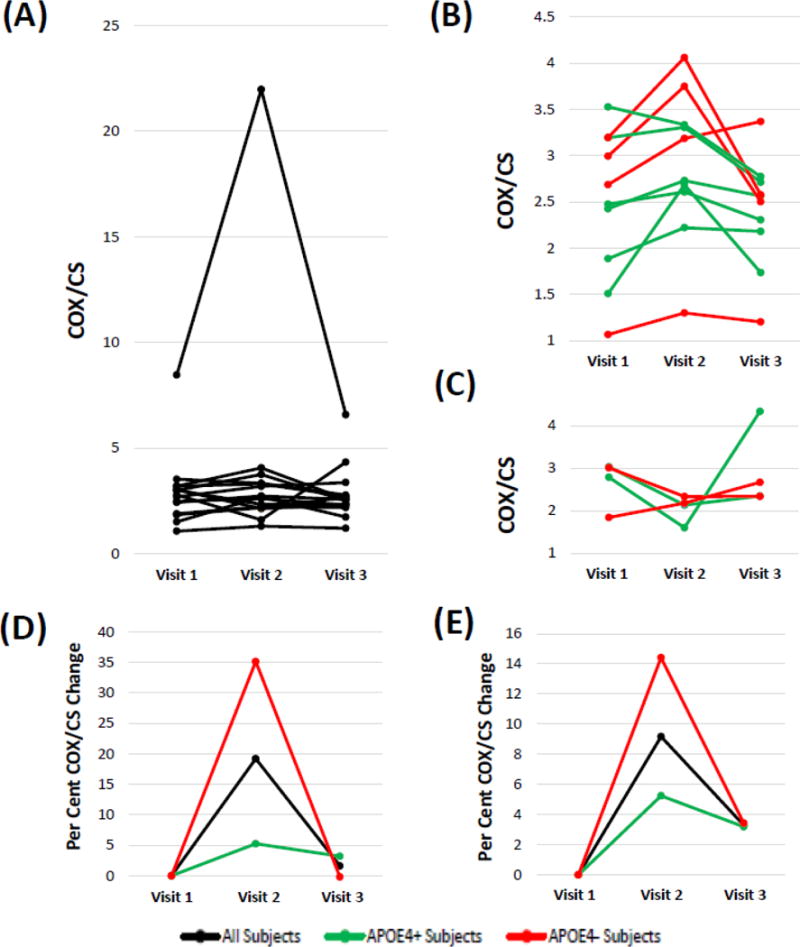
COX/CS response patterns. Units are μmole−1. (A) Response patterns for all 15 participants who completed the study are shown. Data from one participant, a non-APOE4 carrier who showed a positive response pattern, are several-fold higher than that of the other 14 participants because of a technical protocol violation. (B) Eliminating the protocol violation responder and including only data from the other 10 responders more clearly illustrates the inter-visit changes for the responder participants; APOE4 carrier participants are shown in green, and non-APOE4 carrier participants are shown in red. (C) Including only data from the 4 non-responders illustrates the inter-visit changes for each non-responder participant; APOE4 carrier participants are shown in green, and non-APOE4 carrier participants are shown in red. (D) The percent change between the visit 1 and visit 2 scores, as well as the visit 1 and visit 3 scores, is shown; the black line includes data from all 15 subjects, the green line includes data from the 8 APOE4 carriers, and the red line includes data from all 7 non-APOE carriers. (E) After eliminating the single protocol violation non-APOE carrier the percent change between the visit 1 and visit 2 scores, as well as the visit 1 and visit 3 scores, is shown; n=14 for the black line, n=6 for the red line, and n=8 for the green line.
Figure 2B shows the COX/CS pattern for each participant that qualified as a responder, with the exception of the protocol violation non-APOE4 carrier responder. Figure 2C shows the COX/CS pattern for each participant that qualified as a non-responder. For Figures 2D and 2E we calculated for each participant the percent change between their visit 1 and visit 2 scores, as well as the percent change between their visit 1 and visit 3 scores, and plotted the mean percent changes for the total, APOE4 carrier, and APOE4 non-carrier groups. While no significant differences between visits were similarly observed with this analysis, between visit 1 and visit 2 the percent COX/CS change qualitatively rose higher in the non-APOE4 carriers than it did in the APOE4 carriers (p=0.26 for visit by APOE interaction). General patterns consistent with a possible “wash-out” effect were also apparent. Table 3 summarizes the mean COX/CS values, with and without including the data from the protocol violation participant. No statistically significant differences were observed.
Table 3.
COX/CS values. No significant differences were observed between visits (p=0.70 with the protocol violation participant excluded), or between APOE4 carriers and non-carriers (p=0.93 protocol violation participant excluded). COX/CS units are in μmol−1. SD=standard deviation. PVP=protocol violation participant.
| Number of Participants | COX/CS Visit 1 (Mean±SD) |
COX/CS Visit 2 (Mean+SD) |
COX/CS Visit 3 (Mean±SD) |
|
|---|---|---|---|---|
|
| ||||
| Total | ||||
| PVP Included | 15 | 2.94±1.68 | 3.96±5.04 | 2.81±1.25 |
| PVP Excluded | 14 | 2.54±0.72 | 2.67±0.79 | 2.54±0.72 |
|
| ||||
| APOE4 Carriers | 8 | 2.60±0.67 | 2.58±0.59 | 2.62±0.77 |
|
| ||||
| APOE4 non-Carriers | ||||
| PVP Included | 7 | 3.32±2.39 | 5.54±7.31 | 3.03±1.69 |
| PVP Excluded | 6 | 2.47±0.84 | 2.80±1.05 | 2.44±0.70 |
Discussion
S-equol, taken as 10 mg twice daily for two weeks, was associated with a COX activity response pattern (as we defined it a priori) over visits 1-3 in 11 of 15 participants. Excluding the protocol-deviant participant (who showed a positive response pattern) reduces the power of the study and would cause us to miss the pre-specified p<0.06 statistical cut-off (to p<0.09), but given the categorical nature of our outcome measure (and subsequent limited number of p-values) a conclusion to reject the null hypothesis could still be argued. Although this study did not show S-equol does or even can enhance platelet mitochondria COX activity in AD patients (or in anyone for that matter), these preliminary data from AD participants are generally consistent with preclinical data that report S-equol may have the ability to enhance COX activity [11].
Human studies frequently generate aberrant data points and how to handle such data presents challenges. In this study, one participant’s COX/CS absolute values were not comparable to those of the other participants because her CS values were on a different scale. Categorical COX/CS off-on-off treatment slope patterns that defined participants as responders or non-responders, not continuous value-determined means, though, informed our primary endpoint. Further, it is certainly not clear, and arguably unlikely, that the different scaling in this case altered the COX/CS off-on-off pattern and the data from this participant still clearly identify her as a responder. We felt, therefore, that it was appropriate not to throw out data from this participant, just as it would arguably have been inappropriate to throw out data from this participant had it alternatively defined her as a non-responder. Nevertheless, we recognize others may decide to interpret this differently. To help others reach their own conclusions we have openly disclosed and explicitly discussed this protocol violation data point.
To our knowledge this is the first time a direct mitochondrial target engagement biomarker has been featured in an AD therapeutic study. Fluoro-deoxyglucose positron emission tomography (FDG PET) has been used as a biomarker endpoint in other AD therapeutic studies [17], but FDG PET provides only an indirect assessment of mitochondrial function. Magnetic resonance spectroscopy (MRS) similarly has been used to provide biomarker endpoints in AD therapeutic studies [18], and n-acetyl aspartate levels likely relate to mitochondria [19, 20], but MRS also appears to provide at best indirect insight into mitochondrial function. From a conceptual perspective functional MRI, which quantifies brain regional deoxyhemoglobin and oxyhemoglobin, may provide an indirect assessment of brain mitochondrial function but it is unclear whether such inferences are reliable at a practical level [21].
Direct mitochondrial assessments currently require laboratory manipulations of cells or tissues. It is obviously impractical to procure brain samples from living AD subjects. Blood represents an easily procurable tissue, although drug-mediated changes in blood-derived mitochondria does not ensure similar (or indeed any) changes in brain mitochondria have occurred. We recently reported a study in which lymphocyte mitochondria membrane potential values served as a biomarker of mitochondrial target engagement in amyotrophic lateral sclerosis patients treated with rasagiline [22].
To our further knowledge this is the first time activity of a respiratory chain enzyme has served as a target engagement biomarker in any therapeutic trial. Study design and procedures, therefore, were forced to take into account the very exploratory nature of this trial. Platelet mitochondria COX activity seemed to represent a reasonable endpoint, as numerous studies have measured COX activity in AD subject platelets and found that, similar to what is observed in brain mitochondria, platelet mitochondria COX Vmax activities are lower than they are in age-matched control subjects [2].
Reduced platelet mitochondria COX activity has been reported in subjects at various stages of AD, including the mild cognitive impairment stage, and also is reportedly detectable in cognitively normal, middle aged children of AD mothers [16, 23]. It is not clear whether platelet mitochondria COX activity declines in conjunction with AD progression, although in the study of Valla et al. values from MCI and clinical AD subjects, while less than those of age-matched control subjects, were comparable [23]. It is not specifically known whether reduced mitochondria COX activity also occurs in megakaryocytes.
In planning this study we considered that the degree of intra-subject, inter-sample variation between platelet mitochondria obtained from phlebotomies from different days was unknown, as was the amount of S-equol-induced COX activity change to expect. These factors limited our ability to accurately calculate study power based simply on a predicted S-equol-induced change in the COX activity mean. Moreover, previous studies suggest inter-participant COX activity variation does appear to be reasonably high [16]. For these reasons, we used an anticipated pattern of response-informed, dichotomous design to define our primary outcome measure. An added benefit of including the second placebo measurement is that data from this measurement makes it possible for us to now directly address the question of intra-individual variation, which will facilitate the planning of future COX biomarker studies.
In further considering the issue of intra-individual variation, most phlebotomies occurred in the morning and most assays were performed later that same day. Due to the realities of working with human outpatient subjects not everyone, though, underwent phlebotomy at the same time. It is our impression that intra-individual, off-treatment measurement variation increased with more discordant phlebotomy times, although insufficient data are available to render a quantitative conclusion.
Designing this study forced us to make assumptions about platelet mitochondria. We assumed if an S-equol effect on COX activity was to occur, two weeks of treatment would be sufficient to produce it, and two weeks of wash-out would be sufficient for the COX activity to return to baseline. For these assumptions we considered literature that reports the life-span of a platelet is approximately two weeks, a time-frame that also estimates the rate of mitochondrial turn-over [24–28]. We acknowledge, though, that we were and remain uncertain over whether 2 weeks of treatment is adequate for an S-equol-induced increase in COX activity (if such exists) to fully manifest, or whether 2 weeks would allow for a full wash-out of an actual effect.
While a longer treatment duration could have offered potential upsides (perhaps generating a bigger effect), the downsides of a longer treatment duration also require consideration. Potential downsides included more dropouts, adverse events, and resource demands. As this was an exploratory study, the potential downsides of treating longer were felt to outweigh the potential upsides.
Secondary outcome measures included safety, cognition, and the relationship of APOE genotype to the cognitive and COX biomarker data. No treatment-related adverse events (either serious or non-serious) were ascertained, so it seems reasonable to conclude that S-equol, 10 mg twice daily for two weeks, is well-tolerated by AD patients. Regarding cognition, the MoCA is typically used to categorize an individual’s status as cognitively impaired versus not cognitively impaired; it was not specifically designed to reveal potentially subtle treatment-related cognitive changes in AD clinical trials [29]. As designed our study could only have detected profound treatment-mediated improvements (or declines) in cognitive performance. It is perhaps of interest that the slope defined by the MoCA visit 1 and 2 scores projected in the direction of improvement in the APOE4 non-carriers, and in the direction of decline in the APOE4 carriers. While either practice or subtle treatment benefits that primarily impact APOE4 non-carriers could account for this, the ultimate conclusion is that S-equol was not found to benefit cognition in this study. Longer term, larger studies are needed to determine whether S-equol can impact cognition in AD.
APOE status did not have an appreciable impact on the primary outcome measure, as APOE4 carriers and non-carriers showed roughly equivalent proportions of responders and non-responders. The slope defined by the visit 1 and 2 COX/CS activities did trend higher in APOE4 non-carriers than it did in APOE4 carriers, and trends between the visit 2 and 3 measurements could be consistent with a wash-out effect. Based on these data it is tempting to postulate S-equol may more robustly affect APOE4 non-carrier platelet mitochondria COX/CS activity, but this requires caution as post-hoc analyses of small studies can generate misleading inferences [30].
Because it is a selective ERβ agonist S-equol should share some but not all of estrogen’s physiologic effects. Estrogen itself has consistently been shown to influence mitochondrial function although reports of exactly how it influences mitochondria and how this influence manifests are inconsistent. This may reflect the fact that estrogen not only appears to directly affect mitochondrial function, but also to indirectly affect mitochondrial function through other cell effects [7]. Inconsistencies between studies may reflect gross or perhaps even subtle methodologic differences. Relatively recent studies, though, indicate estrogen can promote the expression of mtDNA and nuclear genes that encode mitochondrial proteins [31, 32], and also increase respiratory chain function [33]. The full extent to which ERβ agonists recapitulate the effects of estrogen on mitochondria, though, remains unclear.
It is worth pointing out that relative to the rest of the respiratory chain COX excess capacity is substantial [34]. This infers normal and probably minor COX deficits should not limit respiratory flux. Our COX Vmax measurements do not indicate the state of respiratory flux in the subjects we studied. Narrowly interpreted, therefore, our data only suggest S-equol may have altered the platelet mitochondria COX Vmax activity. Our data, while informing a biomarker of target engagement, do not confirm or refute whether this engagement meaningfully alters a critical AD pathology, or whether it should or should not have symptomatic or disease modifying effects.
This study demonstrates the use of a direct mitochondrial target engagement biomarker to inform an AD treatment trial, and that S-equol 10 mg capsules (taken twice daily for two weeks by women with AD) is well-tolerated. While our data do not prove S-equol does or even can enhance platelet mitochondria COX activity in AD patients, our data also do not lead us to accept a null hypothesis that assumes S-equol does not affect platelet mitochondria COX activity.
With many pilot studies sample sizes are smaller than desired for confirmatory research, and such was the case here as well. We were nevertheless able to estimate operating characteristics under various assumptions that would argue in favor of pursuing future confirmatory studies. Randomized designs with control arms or random-ordered pre-post designs can certainly create a higher level of evidence, and estimates produced from the current study’s data are guiding the design of a more informative trial.
Acknowledgments
This study was supported by Ausio Pharmaceuticals, LLC, and by the University of Kansas Alzheimer’s Disease Center (P30AG035982).
Footnotes
Disclosures
RLJ has equity in Ausio Pharmaceuticals, LLC.
References
- 1.Swerdlow RH. Bioenergetic medicine. Br J Pharmacol. 2014;171:1854–1869. doi: 10.1111/bph.12394. [DOI] [PMC free article] [PubMed] [Google Scholar]
- 2.Swerdlow RH. Mitochondria and cell bioenergetics: increasingly recognized components and a possible etiologic cause of Alzheimer’s disease. Antioxid Redox Signal. 2012;16:1434–1455. doi: 10.1089/ars.2011.4149. [DOI] [PMC free article] [PubMed] [Google Scholar]
- 3.Parker WD, Jr, Filley CM, Parks JK. Cytochrome oxidase deficiency in Alzheimer’s disease. Neurology. 1990;40:1302–1303. doi: 10.1212/wnl.40.8.1302. [DOI] [PubMed] [Google Scholar]
- 4.Hirai K, Aliev G, Nunomura A, Fujioka H, Russell RL, Atwood CS, Johnson AB, Kress Y, Vinters HV, Tabaton M, Shimohama S, Cash AD, Siedlak SL, Harris PL, Jones PK, Petersen RB, Perry G, Smith MA. Mitochondrial abnormalities in Alzheimer’s disease. J Neurosci. 2001;21:3017–3023. doi: 10.1523/JNEUROSCI.21-09-03017.2001. [DOI] [PMC free article] [PubMed] [Google Scholar]
- 5.Silverman DH, Small GW, Chang CY, Lu CS, Kung De Aburto MA, Chen W, Czernin J, Rapoport SI, Pietrini P, Alexander GE, Schapiro MB, Jagust WJ, Hoffman JM, Welsh-Bohmer KA, Alavi A, Clark CM, Salmon E, de Leon MJ, Mielke R, Cummings JL, Kowell AP, Gambhir SS, Hoh CK, Phelps ME. Positron emission tomography in evaluation of dementia: Regional brain metabolism and long-term outcome. JAMA. 2001;286:2120–2127. doi: 10.1001/jama.286.17.2120. [DOI] [PubMed] [Google Scholar]
- 6.Fukuyama H, Ogawa M, Yamauchi H, Yamaguchi S, Kimura J, Yonekura Y, Konishi J. Altered cerebral energy metabolism in Alzheimer’s disease: a PET study. J Nucl Med. 1994;35:1–6. [PubMed] [Google Scholar]
- 7.Klinge CM. Estrogenic control of mitochondrial function and biogenesis. J Cell Biochem. 2008;105:1342–1351. doi: 10.1002/jcb.21936. [DOI] [PMC free article] [PubMed] [Google Scholar]
- 8.Alaynick WA. Nuclear receptors, mitochondria and lipid metabolism. Mitochondrion. 2008;8:329–337. doi: 10.1016/j.mito.2008.02.001. [DOI] [PMC free article] [PubMed] [Google Scholar]
- 9.Onyango IG, Lu J, Rodova M, Lezi E, Crafter AB, Swerdlow RH. Regulation of neuron mitochondrial biogenesis and relevance to brain health. Biochim Biophys Acta. 2010;1802:228–234. doi: 10.1016/j.bbadis.2009.07.014. [DOI] [PubMed] [Google Scholar]
- 10.Jackson RL, Greiwe JS, Schwen RJ. Emerging evidence of the health benefits of S-equol, an estrogen receptor beta agonist. Nutr Rev. 2011;69:432–448. doi: 10.1111/j.1753-4887.2011.00400.x. [DOI] [PubMed] [Google Scholar]
- 11.Yao J, Zhao L, Mao Z, Chen S, Wong KC, To J, Brinton RD. Potentiation of brain mitochondrial function by S-equol and R/S-equol estrogen receptor beta-selective phytoSERM treatments. Brain Res. 2013;1514:128–141. doi: 10.1016/j.brainres.2013.02.021. [DOI] [PMC free article] [PubMed] [Google Scholar]
- 12.Jenks BH, Iwashita S, Nakagawa Y, Ragland K, Lee J, Carson WH, Ueno T, Uchiyama S. A pilot study on the effects of S-equol compared to soy isoflavones on menopausal hot flash frequency. J Womens Health (Larchmt) 2012;21:674–682. doi: 10.1089/jwh.2011.3153. [DOI] [PubMed] [Google Scholar]
- 13.Jackson RL, Greiwe JS, Desai PB, Schwen RJ. Single-dose and steady-state pharmacokinetic studies of S-equol, a potent nonhormonal, estrogen receptor beta-agonist being developed for the treatment of menopausal symptoms. Menopause. 2011;18:185–193. [PubMed] [Google Scholar]
- 14.Usui T, Tochiya M, Sasaki Y, Muranaka K, Yamakage H, Himeno A, Shimatsu A, Inaguma A, Ueno T, Uchiyama S, Satoh-Asahara N. Effects of natural S-equol supplements on overweight or obesity and metabolic syndrome in the Japanese, based on sex and equol status. Clin Endocrinol (Oxf) 2013;78:365–372. doi: 10.1111/j.1365-2265.2012.04400.x. [DOI] [PubMed] [Google Scholar]
- 15.McKhann GM, Knopman DS, Chertkow H, Hyman BT, Jack CR, Jr, Kawas CH, Klunk WE, Koroshetz WJ, Manly JJ, Mayeux R, Mohs RC, Morris JC, Rossor MN, Scheltens P, Carrillo MC, Thies B, Weintraub S, Phelps CH. The diagnosis of dementia due to Alzheimer’s disease: Recommendations from the National Institute on Aging-Alzheimer’s Association workgroups on diagnostic guidelines for Alzheimer’s disease. Alzheimers Dement. 2011;7:263–269. doi: 10.1016/j.jalz.2011.03.005. [DOI] [PMC free article] [PubMed] [Google Scholar]
- 16.Mosconi L, de Leon M, Murray J, E L, Lu J, Javier E, McHugh P, Swerdlow RH. Reduced mitochondria cytochrome oxidase activity in adult children of mothers with Alzheimer’s disease. J Alzheimers Dis. 2011;27:483–490. doi: 10.3233/JAD-2011-110866. [DOI] [PMC free article] [PubMed] [Google Scholar]
- 17.Keller C, Kadir A, Forsberg A, Porras O, Nordberg A. Long-term effects of galantamine treatment on brain functional activities as measured by PET in Alzheimer’s disease patients. J Alzheimers Dis. 2011;24:109–123. doi: 10.3233/JAD-2010-101290. [DOI] [PubMed] [Google Scholar]
- 18.Henigsberg N, Kalember P, Hrabac P, Rados M, Bajs M, Kovavic Z, Loncar M, Madzar T. 1-H MRS changes in dorsolateral prefrontal cortex after donepezil treatment in patients with mild to moderate Alzheimer’s disease. Coll Antropol. 2011;35(Suppl 1):159–162. [PubMed] [Google Scholar]
- 19.Bates TE, Strangward M, Keelan J, Davey GP, Munro PM, Clark JB. Inhibition of N-acetylaspartate production: implications for 1H MRS studies in vivo. Neuroreport. 1996;7:1397–1400. [PubMed] [Google Scholar]
- 20.Clark JB. N-acetyl aspartate: a marker for neuronal loss or mitochondrial dysfunction. Dev Neurosci. 1998;20:271–276. doi: 10.1159/000017321. [DOI] [PubMed] [Google Scholar]
- 21.Sanganahalli BG, Herman P, Hyder F, Kannurpatti SS. Mitochondrial functional state impacts spontaneous neocortical activity and resting state FMRI. PLoS One. 2013;8:e63317. doi: 10.1371/journal.pone.0063317. [DOI] [PMC free article] [PubMed] [Google Scholar]
- 22.Macchi Z, Wang Y, Moore D, Katz J, Saperstein D, Walk D, Simpson E, Genge A, Bertorini T, Fernandes JA, Swenson A, Elman L, Dimachkie M, Herbelin L, Miller J, Lu J, Wilkins H, Swerdlow RH, Statland J, Barohn R. A multi-center screening trial of rasagiline in patients with amyotrophic lateral sclerosis: Possible mitochondrial biomarker target engagement. Amyotroph Lateral Scler Frontotemporal Degener. 2015;16:345–352. doi: 10.3109/21678421.2015.1026826. [DOI] [PMC free article] [PubMed] [Google Scholar]
- 23.Valla J, Schneider L, Niedzielko T, Coon KD, Caselli R, Sabbagh MN, Ahern GL, Baxter L, Alexander G, Walker DG, Reiman EM. Impaired platelet mitochondrial activity in Alzheimer’s disease and mild cognitive impairment. Mitochondrion. 2006;6:323–330. doi: 10.1016/j.mito.2006.10.004. [DOI] [PMC free article] [PubMed] [Google Scholar]
- 24.Hjort PF, Paputchis H. Platelet life span in normal, splenectomized and hypersplenic rats. Blood. 1960;15:45–51. [PubMed] [Google Scholar]
- 25.Menzies RA, Gold PH. The turnover of mitochondria in a variety of tissues of young adult and aged rats. J Biol Chem. 1971;246:2425–2429. [PubMed] [Google Scholar]
- 26.Beattie DS, Basford RE, Koritz SB. The turnover of the protein components of mitochondria from rat liver, kidney, and brain. J Biol Chem. 1967;242:4584–4586. [PubMed] [Google Scholar]
- 27.Khan AA, Wilson JE. STUDIES OF TURNOVER IN MAMMALIAN SUBCELLULAR PARTICLES: BRAIN NUCLEI, MITOCHONDRIA AND MICROSOMES. J Neurochem. 1965;12:81–86. doi: 10.1111/j.1471-4159.1965.tb11942.x. [DOI] [PubMed] [Google Scholar]
- 28.Gross NJ, Getz GS, Rabinowitz M. Apparent turnover of mitochondrial deoxyribonucleic acid and mitochondrial phospholipids in the tissues of the rat. J Biol Chem. 1969;244:1552–1562. [PubMed] [Google Scholar]
- 29.Nasreddine ZS, Phillips NA, Bedirian V, Charbonneau S, Whitehead V, Collin I, Cummings JL, Chertkow H. The Montreal Cognitive Assessment, MoCA: a brief screening tool for mild cognitive impairment. J Am Geriatr Soc. 2005;53:695–699. doi: 10.1111/j.1532-5415.2005.53221.x. [DOI] [PubMed] [Google Scholar]
- 30.Kennedy RE, Cutter GR, Wang G, Schneider LS. Post Hoc Analyses of ApoE Genotype-Defined Subgroups in Clinical Trials. J Alzheimers Dis. 2016;50:1205–1215. doi: 10.3233/JAD-150847. [DOI] [PubMed] [Google Scholar]
- 31.Gavrilova-Jordan LP, Price TM. Actions of steroids in mitochondria. Semin Reprod Med. 2007;25:154–164. doi: 10.1055/s-2007-973428. [DOI] [PubMed] [Google Scholar]
- 32.Mattingly KA, Ivanova MM, Riggs KA, Wickramasinghe NS, Barch MJ, Klinge CM. Estradiol stimulates transcription of nuclear respiratory factor-1 and increases mitochondrial biogenesis. Mol Endocrinol. 2008;22:609–622. doi: 10.1210/me.2007-0029. [DOI] [PMC free article] [PubMed] [Google Scholar]
- 33.Nilsen J, Chen S, Irwin RW, Iwamoto S, Brinton RD. Estrogen protects neuronal cells from amyloid beta-induced apoptosis via regulation of mitochondrial proteins and function. BMC Neurosci. 2006;7:74. doi: 10.1186/1471-2202-7-74. [DOI] [PMC free article] [PubMed] [Google Scholar]
- 34.Gnaiger E, Lassnig B, Kuznetsov A, Rieger G, Margreiter R. Mitochondrial oxygen affinity, respiratory flux control and excess capacity of cytochrome c oxidase. J Exp Biol. 1998;201:1129–1139. doi: 10.1242/jeb.201.8.1129. [DOI] [PubMed] [Google Scholar]