

Understanding the mechanisms underlying microstructural damage to normal-appearing brain tissue in multiple sclerosis will aid the development of neuroprotective strategies. By longitudinally assessing changes in the diffusion properties of optic radiations after acute optic neuritis, Tur et al. obtain evidence that anterograde trans-synaptic degeneration is among the damage mechanisms.
Keywords: multiple sclerosis, optic neuritis, optic radiations, diffusion tensor imaging, trans-synaptic degeneration
Understanding the mechanisms underlying microstructural damage to normal-appearing brain tissue in multiple sclerosis will aid the development of neuroprotective strategies. By longitudinally assessing changes in the diffusion properties of optic radiations after acute optic neuritis, Tur et al. obtain evidence that anterograde trans-synaptic degeneration is among the damage mechanisms.
Abstract
In multiple sclerosis, microstructural damage of normal-appearing brain tissue is an important feature of its pathology. Understanding these mechanisms is vital to help develop neuroprotective strategies. The visual pathway is a key model to study mechanisms of damage and recovery in demyelination. Anterograde trans-synaptic degeneration across the lateral geniculate nuclei has been suggested as a mechanism of tissue damage to explain optic radiation abnormalities seen in association with demyelinating disease and optic neuritis, although evidence for this has relied solely on cross-sectional studies. We therefore aimed to assess: (i) longitudinal changes in the diffusion properties of optic radiations after optic neuritis suggesting trans-synaptic degeneration; (ii) the predictive value of early optic nerve magnetic resonance imaging measures for late optic radiations changes; and (iii) the impact on visual outcome of both optic nerve and brain post-optic neuritis changes. Twenty-eight consecutive patients with acute optic neuritis and eight healthy controls were assessed visually (logMAR, colour vision, and Sloan 1.25%, 5%, 25%) and by magnetic resonance imaging, at baseline, 3, 6, and 12 months. Magnetic resonance imaging sequences performed (and metrics obtained) were: (i) optic nerve fluid-attenuated inversion-recovery (optic nerve cross-sectional area); (ii) optic nerve proton density fast spin-echo (optic nerve proton density-lesion length); (iii) optic nerve post-gadolinium T 1 -weighted (Gd-enhanced lesion length); and (iv) brain diffusion-weighted imaging (to derive optic radiation fractional anisotropy, radial diffusivity, and axial diffusivity). Mixed-effects and multivariate regression models were performed, adjusting for age, gender, and optic radiation lesion load. These identified changes over time and associations between early optic nerve measures and 1-year global optic radiation/clinical measures. The fractional anisotropy in patients’ optic radiations decreased ( P = 0.018) and radial diffusivity increased ( P = 0.002) over 1 year following optic neuritis, whereas optic radiation measures were unchanged in controls. Also, smaller cross-sectional areas of affected optic nerves at 3 months post-optic neuritis predicted lower fractional anisotropy and higher radial diffusivity at 1 year ( P = 0.007) in the optic radiations, whereas none of the inflammatory measures of the optic nerve predicted changes in optic radiations. Finally, greater Gd-enhanced lesion length at baseline and greater optic nerve proton density-lesion length at 1 year were associated with worse visual function at 1 year ( P = 0.034 for both). Neither the cross-sectional area of the affected optic nerve after optic neuritis nor the damage in optic radiations was associated with 1-year visual outcome. Our longitudinal study shows that, after optic neuritis, there is progressive damage to the optic radiations, greater in patients with early residual optic nerve atrophy, even after adjusting for optic radiation lesions. These findings provide evidence for trans-synaptic degeneration.
Understanding the mechanisms underlying microstructural damage to normal-appearing brain tissue in multiple sclerosis will aid the development of neuroprotective strategies. By longitudinally assessing changes in the diffusion properties of optic radiations after acute optic neuritis, Tur et al. obtain evidence that anterograde trans-synaptic degeneration is among the damage mechanisms.
Introduction
Disability accumulation in multiple sclerosis is thought to arise from both microstructural normal-appearing central nervous tissue damage and visible inflammatory changes ( Fernando et al. , 2005 ). A detailed understanding of the damage mechanisms in multiple sclerosis is crucial to help the development of biomarkers of tissue degeneration, which could be used in clinical trials to monitor neuroprotective treatment effects. The visual pathway, from the optic nerve to the visual cortex, and including the optic tracts, lateral geniculate nuclei and optic radiations, provides a well-characterized neural system and unique setting to study these mechanisms in vivo ( Toosy et al. , 2014 ). Inflammatory, demyelinating optic neuritis typically presents with the triad of dyschromatopsia, visual loss and painful eye movements. Optic neuritis can be used as a model for relapse in multiple sclerosis to explore the mechanisms of damage, recovery and persistent deficits ( Toosy et al. , 2014 ). The acute optic neuritis lesion begins with focal inflammatory demyelination, giving rise to conduction block and loss of vision. Recovery of vision is associated with resolution of inflammation, oedema, remyelination (incomplete) and redistribution of sodium channels ( Smith and McDonald, 1999 ). In the post-acute phase there may be persistent neuroaxonal loss and optic nerve atrophy ( Hickman et al. , 2002 , 2004 ; Jenkins et al. , 2011 ).
There is accumulating evidence from MRI studies for changes in post-geniculate visual pathways in association with optic neuritis. For example structural ( Audoin et al. , 2006 ; Jenkins et al. , 2011 ) and functional ( Toosy et al. , 2005 ; Jenkins et al. , 2010 a , b ) cortical changes have been described after optic neuritis. The optic radiations have also been investigated using diffusion tensor imaging (DTI), which provides information about voxel-level microstructural properties ( Basser et al. , 1994 ; Pierpaoli and Basser, 1996 ; Beaulieu, 2002 ). Cross-sectional studies of optic radiations following optic neuritis have demonstrated (i) reduced connectivity metrics in the optic radiations after optic neuritis compared with healthy controls ( Ciccarelli et al. , 2005 ); (ii) increased tissue damage in the optic radiations, reflected by decreased fractional anisotropy (FA) and axial diffusivity (AD), and increased radial diffusivity (RD), after optic neuritis, compared with healthy controls ( Reich et al. , 2009 ; Kolbe et al. , 2012 a ; Balk et al. , 2015 ); (iii) that multiple sclerosis patients with smaller retinal nerve fibre layer (RNFL) thickness had greater damage in the optic radiations as shown by lower FA and greater RD, suggestive of trans-synaptic degeneration ( Reich et al. , 2009 ); (iv) that multiple sclerosis patients with optic neuritis have more optic radiation abnormalities than multiple sclerosis patients without a history of optic neuritis ( Rocca et al. , 2013 ; Gabilondo et al. , 2014 ). These findings could be interpreted as reflecting a trans-synaptic degenerative process, where impaired synaptic input to lateral geniculate nucleus neurons leads to secondary pathology in the optic radiations, although the data collected (analyses performed) have been cross-sectional hence the inferences made have been indirect.
To better assess trans-synaptic degeneration, a longitudinal analysis is required after an incident optic neuritis to track the optic radiation changes over time. We therefore conducted a prospective study of a cohort of acute optic neuritis patients followed up over 1 year with MRI and addressed three aims: (i) to characterize the longitudinal diffusion properties in the optic radiations after acute optic neuritis over 1 year; (ii) to determine whether earlier optic neuritis structure characteristics predict later optic radiation diffusion changes, suggestive of a trans-synaptic lag effect; and (iii) to investigate how optic neuritis and optic radiation MRI metrics correlate with visual function 1 year after the optic neuritis.
We hypothesized that changes in the diffusion properties of the optic radiations can be predicted by changes in earlier optic nerve structure and can relate to clinical measures of visual function.
Materials and methods
Subjects
Subjects with their first episode of acute unilateral optic neuritis and no previous neurological history were consecutively recruited from Moorfields Eye Hospital. Healthy volunteers were also recruited. Participants whose scans showed incidental inflammatory lesions after recruitment were included. Assessments were performed for each subject at baseline (within 1 month of onset of optic neuritis), 3, 6 and 12 months later. All subjects underwent MRI; optic neuritis patients additionally had visual function assessments. Also, in optic neuritis patients, the presence of a second relapse suggestive of multiple sclerosis (but not the topography of the second relapse) during the 12-month follow-up was recorded. The local Ethics Committee approved the study and all subjects provided informed written consent.
Visual function
A retro-illuminated Early Treatment Diabetic Retinopathy Study (ETDRS) Chart was used to measure best corrected visual acuity, recorded as the 4 m logarithm of the minimum angle of resolution (logMAR). Poorer visual acuity is reflected by higher logMAR scores. When no letters could be correctly identified, a score of 1.7 was assigned. The Humphrey automated field analyser was used to assess visual fields using the 30-2 program (Allergan-Humphrey Inc.). The global visual field mean deviation (HMD) was calculated. More negative error scores indicate worse vision. Colour vision was measured using the Farnsworth-Munsell 100-hue test ( Farnsworth, 1943 ), and scored as the square root of the error score. If the visual acuity was too poor to attempt the test, an error score of 36.6 was assigned ( Optic Neuritis Study Group, 1991 ). Higher error scores indicate worse vision. Low contrast acuity was assessed using Sloan charts ( Ferris et al. , 1982 ), at 25%, 5% and 1.25% contrast. The scoring system was identical to standard logMAR scoring, with higher scores indicating worse vision ( Optic Neuritis Study Group, 1991 ).
MRI studies
MRI data were acquired using a 1.5 T GE Signa Echospeed MRI scanner with maximum gradient strength of 33 mTm −1 . All individuals were scanned at baseline, 3, 6 and at 12 months.
The MRI protocol was the follow-up study of Jenkins et al. (2011) , where baseline data were reported. For the present study, we processed the images corresponding to 3-, 6-, and 12-month follow-up time points. The protocol included:
Optic nerve structural scans
The following scans were carried out: (i) coronal-oblique proton density fast spin-echo sequence (repetition time = 2300 ms, echo time = 68 ms, two excitations, echo train length = 8, matrix size = 512 × 384, field of view = 24 × 18 cm, 16 contiguous 3-mm slices); (ii) coronal-oblique fluid-attenuated inversion-recovery (FLAIR) imaging (repetition time = 2500 ms, echo time = 12.7 ms, inversion time = 995 ms, six excitations, echo train length = 6, matrix size = 512 × 384, field of view = 24 × 18 cm, 16 contiguous 3-mm slices); and (iii) post-triple-dose Gd-enhanced coronal-oblique fat-saturated T 1 -weighted spin-echo was acquired (repetition time = 600 ms, echo time = 20 ms, one excitation, matrix size = 256 × 192, field of view = 24 × 18 cm, 16 contiguous 3-mm slices).
Optic nerve images were processed to obtain: (i) lesion length (only in patients, at all time points), by an experienced (and blinded) neuroradiologist (K.M.); (ii) optic nerve cross-sectional area (all individuals, at all time points), from five contiguous slices anterior from the orbital apex ( Hickman et al. , 2001 ), using a semiautomated contouring technique ( Plummer, 1992 ), by a blinded observer (T.J.), as a marker of optic nerve axonal loss ( Trip et al. , 2006 ); and (iii) Gd-enhanced lesion length (only in patients and only at baseline)
Brain structural and functional scans
Visual functional MRI task-dependent scans were acquired in four scanning sessions, as previously described ( Jenkins et al. , 2010 a ).
For diffusion-weighted imaging scans of the optic radiations and occipital lobes, we used an optimized single-shot, cardiac-gated, diffusion-weighted echo-planar imaging sequence, as previously described ( Jenkins et al. , 2010 a , b , 2011 ). Diffusion-weighting gradients were applied along 61 distributed directions ( Cook et al. , 2007 ), with b = 1200 s/mm 2 , which was optimized for white matter. Seven interleaved non-diffusion-weighted b0 scans were also acquired. One additional b0 volume was acquired, covering the whole brain to assist co-registration of partial brain diffusion data to whole-brain functional MRI data (see below), which was necessary for tractography. Head motion- and eddy current-induced distortions were corrected and the diffusion tensor was then calculated on a pixel-by-pixel basis, using FSL tools ( http://www.fmrib.ox.ac.uk/fsl ).
Axial oblique, proton-density, dual echo, fast spin echo scans of the whole brain were carried out as previously described ( Jenkins et al. , 2010 a ).
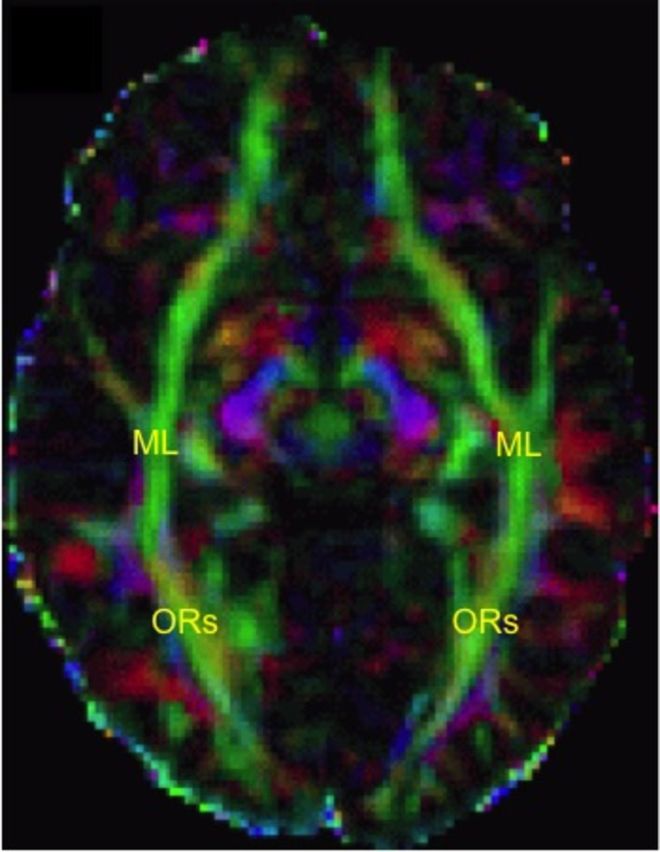
Processing of optic radiation images was as follows. Diffusion-weighted images: the optic radiations were reconstructed using the FSL probabilistic tractography algorithm ( http://www.fmrib.ox.ac.uk/fsl/fdt/fdt_probtrackx.html ). First level functional MRI contrast images for all subjects were combined and two spherical regions of interest of 3.5-mm radius were created centred on the global maximal coordinates for each lateral geniculate nucleus (MNI coordinates: right, 22 −24 −4; left, −22 −26 −4). Regions of interest underwent normalization to each subject’s native space, co-registration to each subject’s partial brain diffusion data, via the whole brain b0 intermediate step, and binarization. These regions of interest were then moved in each subject’s native diffusion space to sit 8–10 voxels laterally within the apex of Meyer’s loops. Visual confirmation that they were placed correctly was performed in each case and probabilistic tractography was performed from these seed points ( Jenkins et al. , 2010 a ). The reason why functional MRI seeds were averaged at the group level was that signal at the individual level was considered too variable, and tractography results would have been unreliable. The mean FA, AD and RD within the tractography-derived tract were obtained for each side, in each subject, at each time point. Because optic nerve fibres approximately hemi-decussate at the optic chiasm, DTI metrics for left and right optic radiation sides were averaged, after checking there were no significant differences between right and left hemispheres (data not shown).
Proton density images were used to obtain the whole brain and optic radiation lesion load.
Visual functional MRI task-dependent scans were used to define the seed points needed for tractography of the optic radiations.
Statistical analysis
There were three stages of analysis. First, evaluation of differences between patients and controls in optic radiations’ DTI and optic nerve measures, at baseline and over time was carried out. Differences at baseline were examined using multiple linear regression of the DTI or optic nerve variables as response variables, with a group indicator, age, and gender as covariates.
Longitudinal differences over time were examined with the measures of interest as response variables in linear mixed models with group, time and Group × Time interaction as explanatory variables, and with age and gender covariates. The possibility of non-linear trajectories was examined by including a quadratic term in time with corresponding group interaction. For changes in length of optic nerve lesion, optic radiation lesion load at baseline was added as covariate.
Second, we analysed the relationship between early optic nerve variables and later optic radiation variables. Multivariate multiple regression was used to simultaneously regress those optic radiation DTI variables that had shown change over time on baseline optic nerve area of affected eye, proton density–lesion length or Gd-enhanced lesion length, entered singly, with age, gender, baseline DTI and optic radiation lesion load as covariates. Models with baseline optic nerve area as explanatory variable were also adjusted for optic nerve area of the unaffected eye. Unless otherwise stated, all results refer to models adjusted for these covariates. Two advantages of the multivariate regression were: (i) the possibility of a single joint test for an optic nerve predictor to reduce multiple testing: only a significant single joint test, with associations all in the same direction, was taken as evidence that the optic nerve predictor was associated with overall damage to the optic radiation measures; and (ii) under missing-at-random (MAR) and multivariate normality assumptions, all available data points contributed to the model to reduce the potential bias from exclusion of patients without complete data on all variables.
Similar multivariate models were fitted for individual optic nerve variables measured at 3 and 6 months after the optic neuritis (also adjusting for age, gender, optic radiation lesion load at 3 or 6 months, respectively, and clinical variables also at 3 or 6 months) to determine temporal associations with optic radiation DTI variables at 1 year.
Finally, to investigate how optic nerve and optic radiation MRI metrics correlate with visual function, we performed two types of analyses, to assess: Statistical evidence was considered when P -value was < 0.05. Statistical analysis was conducted using Stata 13.1 (Stata Corporation). For the multivariate regressions the SEM (structural equation model) command was used with unstructured covariance and maximum likelihood with missing values.
The relationship between early optic nerve variables and visual function 1 year after the optic neuritis. Multivariate regression models similar to those described above were fitted. All 1-year visual measures (i.e. LogMAR, Humphrey, Colour vision, Sloan charts at 1.25%, 5%, and 25%) were response variables in simultaneously fitted regression models with baseline optic nerve explanatory variables entered singly; and with the following covariates: age, gender, baseline optic radiation lesion load, and baseline values of the visual response variable. Unless otherwise stated, all results refer to models adjusted for these covariates. Joint tests similar to those above were performed to reduce multiple testing. Similar models were fitted for optic nerve explanatory variables measured at 3 and 6 months after the optic neuritis. For these models, age, gender, optic radiation lesion load at 3 or 6 months respectively, depending on the model, and visual response variables at 3 or 6 months were used as covariates.
Cross-sectional associations between optic nerve, optic radiation and visual function variables at 1 year. Multivariate regression models (again similar to those described above) were fitted. All 1-year visual measures (i.e. LogMAR, Humphrey, Colour vision, Sloan charts at 1.25%, 5%, and 25%) were response variables in simultaneous regressions with 1-year optic nerve and optic radiation variables entered singly as explanatory variables. Models were adjusted for age and gender. Optic radiation lesion load at 1 year and visual function at baseline were explored as covariates.
Results
Twenty-eight patients with optic neuritis (23 females) with mean [standard deviation (SD)] age of 32.04 (6.53) years, and 10 healthy controls (eight females) with mean (SD) age of 30.90 (3.11) years were recruited. Median duration from symptom onset was 22 days (range 7–34). Only 25 patients (20 females) and eight control subjects (six females) had longitudinal data.
Differences between patients and controls at baseline and over time
After optic neuritis, the optic radiation FA decreased and RD increased over 1 year. Patients’ affected optic nerve areas also decreased over time. Tables 1 and 2 show the main characteristics of optic radiations and optic nerve variables at baseline and at each time point, in patients and controls.
Table 1.
Optic radiation variables at all time points
| Patients | Controls | |||||||
|---|---|---|---|---|---|---|---|---|
| Baseline | 3 months | 6 months | 12 months | Baseline | 3 months | 6 months | 12 months | |
| n scanned | 28 | 24 | 22 | 20 | 10 a | 8 | 8 | 8 |
| Average FA aMean (SD) | 0.361 (0.031) | 0.363 (0.034) | 0.350 (0.039) | 0.350 (0.038) | 0.356 (0.035) | 0.376 (0.047) | 0.365 (0.024) | 0.364 (0.028) |
| Average RD a (×10 −4 mm 2 /s), mean (SD) | 6.104 (0.495) | 6.167 (0.573) | 6.192 (0.522) | 6.476 (0.569) | 6.003 (0.340) | 5.695 (0.504) | 5.879 (0.279) | 5.814 (0.355) |
| Average AD a (×10 −4 mm 2 /s), mean (SD) | 10.783 (0.672) | 10.945 (0.708) | 10.675 (0.534) | 11.070 (0.776) | 10.465 (0.425) | 10.023 (0.297) | 10.305 (0.387) | 10.288 (0.334) |
| OR lesion load (mm 3 ), mean (SD) | 63.021 (117.159); | 67.925 (120.559); | 120.2 (195.737); | 131.52 (200.417); | - | - | - | - |
| Median (range) b | 3.5 (0–494.8) | 9.7 (0–376.1) | 34.75 (0–812.9) | 43.05 (0–796.1) | ||||
| n = 28 | n = 24 | n = 22 | n = 20 | |||||
a Average values from left and right optic radiations.
b Due to optic radiation lesion load being positively skewed, median (range) is reported instead of mean (SD).
c Although all 10 controls were scanned at baseline, optic radiation data were only available in eight (six female, two male).
OR = optic radiation.
Table 2.
Optic nerve variables at all time points in patients
| Patients | ||||
|---|---|---|---|---|
| Baseline | 3 months | 6 months | 12 months | |
| n scanned | 28 | 24 | 22 | 20 |
| Area of affected eye (mm 2 ) | 14.629 | 12.681 | 12.376 | 11.296 |
| Mean (SD) | (3.205) | (1.704) | (1.587) | (1.772) |
| Area of unaffected eye (mm 2 ) | 12.340 | 12.705 | 12.594 | 12.882 |
| Mean (SD) | (1.275) | (1.911) | (1.841) | (1.492) |
| Length of optic nerve lesion (mm) | 22.071 | 25.250 | 29.045 | 31.200 |
| Mean (SD) | (10.367) | (11.498) | (8.899) | (9.356) |
| Length of Gd enhancement (mm) | 23.538 | - | - | - |
| Mean (SD) a | (13.327) | |||
a The length of the Gd enhancement was only assessed at baseline.
Differences at baseline
There were no significant adjusted differences between patients’ and controls’ mean FA, RD, and AD in optic radiations: adjusted differences, i.e. patients’ minus controls’ measures, (95% CI) were: for FA: 0.007 (−0.021, 0.036), P = 0.595; RD: 0.141·10 −4 mm 2 /s (−0.270·10 −4 , 0.552·10 −4 ), P = 0.488 for RD; and AD: 0.402·10 −4 mm 2 /s (−9.492·10 −4 , 10.296·10 −4 ), P = 0.934.
Patients’ affected optic nerve areas were larger than controls’ areas: adjusted difference (95% CI): 1.801 mm 2 (0.097, 3.505), P = 0.039; patients’ unaffected optic nerve areas were slightly and non-significantly smaller than controls’ optic nerve areas by −0.488 mm 2 (−2.192, 1.216), P = 0.569; patients’ affected optic nerve areas were larger than patients’ unaffected nerve areas by 2.289 mm 2 (1.060, 3.517), P < 0.001.
Differences over time
For the optic radiations, average FA significantly decreased in patients over time [monthly rate of change (95% CI): −1.483·10 −3 FA units/month (−2.714·10 −3 , −0.251·10 −3 ), P = 0.018], whereas no significant longitudinal change occurred in controls [0.278·10 −3 (−1.457·10 −3 , 2.013·10 −3 ), P = 0.754], although patient versus control rate difference did not reach statistical significance ( P = 0.105) ( Fig. 1 A). Average RD significantly increased in patients [0.031·10 −4 mm 2 /s/month (0.012·10 −4 , 0.049·10 −4 ], P = 0.001], whereas no significant longitudinal change occurred in controls [−0.008·10 −4 mm 2 /s/month (−0.035·10 −4 , 0.018·10 −4 ), P = 0.549]. Additionally, for RD, the rate of change was significantly more positive in patients than in controls by 0.039·10 −4 mm 2 /s/month (0.006·10 −4 , 0.071·10 −4 ), P = 0.019 ( Fig. 1 B). There was no evidence of non-linear change over time for FA or RD. Finally, average AD in the optic radiation did not significantly change in patients [0.014·10 −4 mm 2 /s/month (−0.005·10 −4 , 0.034·10 −6 ), P = 0.155] or in controls [−0.003·10 −4 mm 2 /s/month (−0.033·10 −4 , 0.026·10 −4 ), P = 0.819] ( Fig. 1 C).
Figure 1.
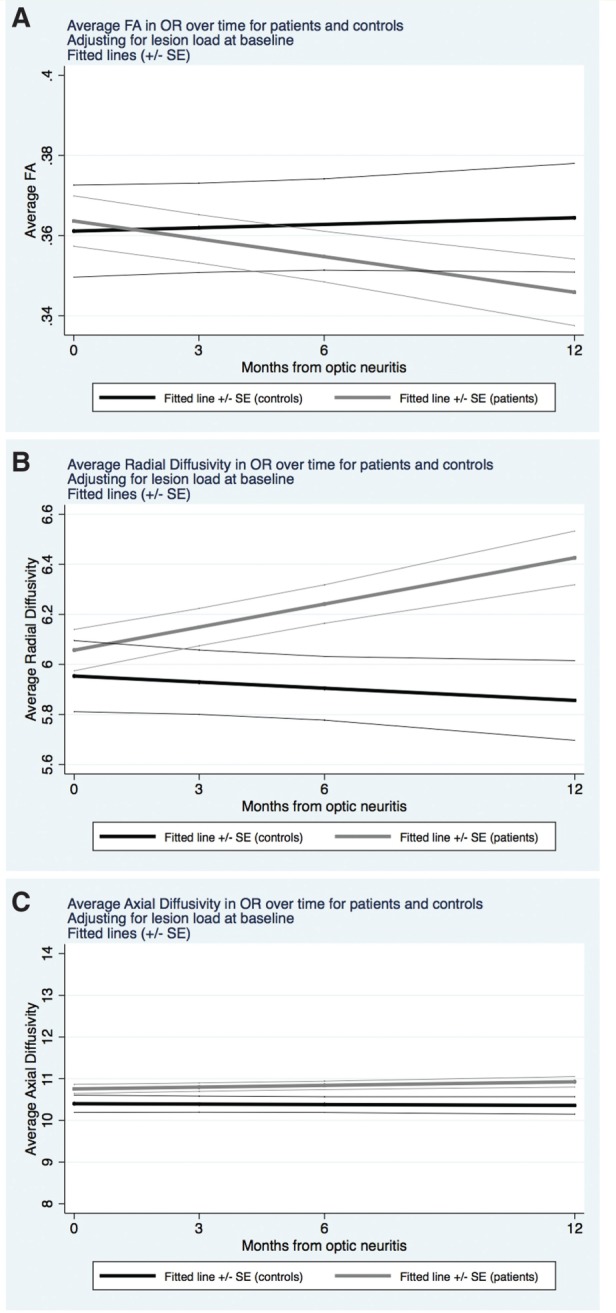
Changes over time in DTI measures in the optic radiations . Evolution over time of the DTI measures in the optic radiations over 1 year, after adjusting for optic radiation lesion load at baseline, in patients (grey) and controls (black). In A , fractional anisotropy (dimensionless units) significantly decreased over time in patients, whereas it did not significantly change in controls. In B , radial diffusivity (mm 2 /s × 10 −4 ) significantly increased in patients, whereas it did not significantly change in controls. In C , axial diffusivity (mm 2 /s × 10 −4 ) did not significantly change in patients or controls.
In patients, lesion load in the optic radiations (sum of left and right optic radiations) significantly increased over time [4.060 mm 3 /month (1.566, 6.554), P = 0.001]. For that reason, similar longitudinal (mixed-effects) models were created but adjusting for lesion load at each time point, not just at baseline. The results were similar to those reported when adjusting for baseline optic radiation lesion load ( Supplementary Table 1 ).
There was evidence of a non-linear decrease over time in the affected optic nerve area, with the rate of change levelling off from 6 to 12 months [regression coefficients (RCs) (95% CI): −0.563 mm 2 /month (−0.779, −0.348), P < 0.001; and 0.026 mm 2 /month 2 (0.009, 0.043), P = 0.002] ( Fig. 2 A). The unaffected optic nerve area in patients or optic nerve area of controls did not significantly change over time, either in a linear [RCs (95% CI): 0.046 mm 2 /month (−0.170, 0.261), P = 0.678; and 0.084 mm 2 /month (−0.279, 0.446), P = 0.651, respectively] or in a non-linear way ( P = 0.956 and P = 0.905, respectively). Optic nerve proton density-lesion length significantly increased over time in patients [RC (95% CI): 1.598 mm/month (0.795, 2.402), P < 0.001] and there was evidence of a negative non-linear component [RC (95% CI): −0.066 mm/month 2 (−0.129, −0.002), P = 0.042], i.e. the increase in change of lesion size slowed down towards the end of the follow-up ( Fig. 2 B).
Figure 2.
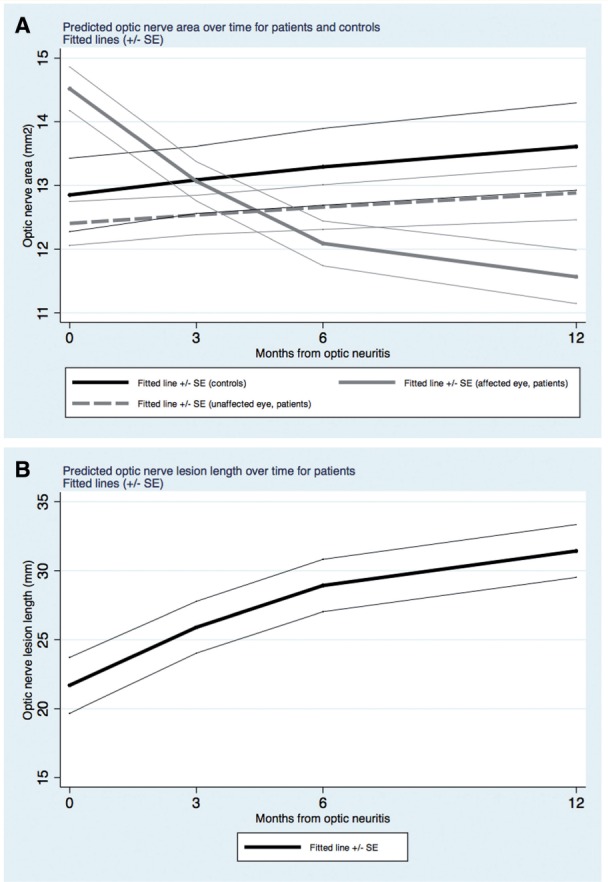
Evolution of optic nerve measures over time . ( A ) The evolution over time of optic nerve areas in patients and in controls. As can be seen, optic nerve areas of affected eyes in patients decreased over time in a non-linear manner. Optic nerve areas of unaffected eyes in patients were consistently smaller than those in controls, although the difference did not reach statistical significance. The monthly rates of change in optic nerve areas in controls and in patients’ unaffected eyes were not significantly different from zero. ( B ) The evolution over time of optic nerve lesion length in patients. As can be seen, optic nerve lesion length increased over time in a non-linear manner so that there is a levelling off towards the end of follow-up.
Finally, as expected, in patients, all visual outcomes of the affected eye improved over time, most of them showed a non-linear profile: a rapid initial improvement was followed by a plateau ( Supplementary Table 2 ).
During follow-up, 11 patients had a second relapse [nine females; mean age (SD): 32.273 years (7.964); median optic radiation lesion load at baseline (range): 102.8 mm 3 (0–494.8)], whereas 13 patients did not [11 females; mean age (SD): 30.846 years (5.145); median optic radiation lesion load at baseline (range): 0 mm 3 (0–107.2)]. In four patients, clinical follow-up information was not available. There were no differences in optic radiation FA, RD, or AD, between those who presented a second multiple sclerosis relapse during the follow-up and those who remained as clinically isolated syndromes, either at baseline [ P -values = 0.514 (FA), 0.093 (RD), and 0.883 (AD)] or at 1-year follow-up [ P -values = 0.121 (FA), 0.148 (RD), 0.510 (AD)].
Predicting late optic radiation DTI metrics from earlier optic nerve measures
Greater optic nerve atrophy 3 months after optic neuritis predicted lower optic radiation FA and higher optic radiation RD at 1-year.
Optic radiation FA and RD were entered into the multivariate analysis but not optic radiation AD as this did not show significant change over time. Smaller optic nerve area of the affected eye at 3 months predicted greater damage in the optic radiations at 1 year, i.e. lower FA [RC (95% CI): 0.535 FA units/mm 2 of optic nerve area (0.207, 0.863), P = 0.001] and greater RD [RC (95% CI): −0.401 mm 2 /s/mm 2 of optic nerve area (−0.762, −0.039), P = 0.030], after 1 year of having developed the optic neuritis (joint test P = 0.0069).
Although at 6 months of follow-up smaller optic nerve areas of the affected eye implied lower FA and greater RD at 1-year follow-up, these associations were not significant (joint test P = 0.5996). None of the inflammatory parameters of the optic nerve predicted damage in the optic radiations after 1 year of the optic neuritis. Table 3 shows the standardized regression coefficients obtained from multivariate analyses.
Table 3.
Prediction of optic radiation damage at 1-year follow-up with optic nerve measures at different time points
| Dependent variables | Joint test P -value | ||
|---|---|---|---|
| FA | RD (mm 2 /s) | ||
| Optic nerve measure a | Standardized regression coefficients (95% CI) from multivariate analyses | ||
| Affected optic nerve area at baseline | −0.081 | −0.147 | 0.2569 |
| (−0.336, 0.174) | (−0.513, 0.219) | ||
| Affected optic nerve area at 3 months | 0.535 | −0.401 | 0.0069 b |
| (0.207, 0.863) | (−0.762, −0.039) | ||
| Affected optic nerve area at 6 months | 0.256 | −0.347 | 0.5996 |
| (−0.268, 0.779) | (−1.243, 0.549) | ||
| Lesion length of affected optic nerve at baseline | 0.218 | −0.469 | 0.1058 |
| (−0.077, 0.513) | (−0.874, −0.063) | ||
| Lesion length of affected optic nerve at 3 months | −0.074 | 0.048 | 0.7985 |
| (−0.327, 0.179) | (−0.288, 0.384) | ||
| Lesion length of affected optic nerve at 6 months | 0.117 | −0.096 | 0.5610 |
| (−0.128, 0.361) | (−0.502, 0.310) | ||
| Gd-enhanced lesion length of affected optic nerve at baseline | 0.161 | −0.276 | 0.3860 |
| (−0.126, 0.449) | (−0.663, 0.112) | ||
a The predictors (optic nerve measures) shown in the table were tested individually (one at a time), together with age, gender, and optic radiation lesion load at corresponding time point, either baseline, 3-month follow-up, or 6-month follow-up.
b This was the only significant result and the effect of the predictor (affected eye’s area at 3 months) had effects on the dependent variables that went in the same biological direction.
Prediction of 1-year visual function
Table 4 shows the clinical measures at all time points, in patients.
Table 4.
Clinical variables at all time points in patients
| Clinical variables | Time point | |||||||
|---|---|---|---|---|---|---|---|---|
| Baseline | 3 months | 6 months | 12 months | |||||
| n = 28 | n = 24 | n = 23 | n = 24 | |||||
| Affected | Unaffected | Affected | Unaffected | Affected | Unaffected | Affected | Unaffected | |
| LogMAR scores | 0.719 | −0.049 | 0.164 | −0.032 | 0.109 | −0.040 | 0.091 | −0.051 |
| Mean (SD) | (0.694) | (0.103) | (0.351) | (0.136) | (0.252) | (0.109) | (0.220) | (0.078) |
| Humphrey scores | −19.510 | −6.096 | −8.221 | −5.007 | −7.849 | −5.001 | −7.219 | −5.110 |
| Mean (SD) | (9.672) | (1.561) | (3.307) | (1.750) | (2.846) | (1.380) | (2.515) | (1.285) |
| Colour vision scores | 24.354 | 10.361 | 15.071 | 10.750 | 14.743 | 10.865 | 14.221 | 11.617 |
| Mean (SD) | (9.914) | (2.852) | (6.206) | (2.763) | (5.893) | (3.137) | (4.549) | (2.459) |
| Sloan chart at 1.25% scores | 1.624 | 0.697 | 1.428 | 0.762 | 1.268 | 0.713 | 1.080 | 0.684 |
| Mean (SD) | (0.247) | (0.288) | (0.381) | (0.332) | (0.417) | (0.280) | (0.372) | (0.275) |
| Sloan chart at 5% scores | 1.297 | 0.364 | 0.767 | 0.374 | 0.632 | 0.317 | 0.605 | 0.333 |
| Mean (SD) | (0.520) | (0.324) | (0.441) | (0.305) | (0.392) | (0.192) | (0.332) | (0.212) |
| Sloan chart at 25% scores | 0.829 | 0.051 | 0.293 | 0.062 | 0.244 | 0.041 | 0.211 | 0.061 |
| Mean (SD) | (0.673) | (0.134) | (0.353) | (0.168) | (0.278) | (0.129) | (0.256) | (0.108) |
See main text for further explanations about visual function scores.
Prediction of 1-year visual function by earlier optic nerve variables
A longer Gd-enhanced optic nerve lesion length at baseline predicted worse overall clinical outcomes (for LogMAR, Humphrey, colour vision, Sloan charts at 1.25%, 5%, and 25%) at 1-year follow-up (joint test P = 0.0386). The standardized regression coefficients are shown in Table 5 . Greater optic nerve proton density-lesion length of the affected side at 3 and 6 months predicted worse clinical outcome (in LogMAR, Humphrey, colour vision, and Sloan charts at 1.25%, 5%, and 25%) at 1-year follow-up, after adjusting only for age and gender (joint test P = 0.0005 and P = 0.0292, respectively). However, these associations became non-significant (joint test P = 0.1591 and P = 0.4042, respectively) after adjusting for clinical measures and optic radiation lesion load at the time point of the predictor ( Table 5 ). Finally, for all these models, being female was associated with better visual function at 1 year (joint test P < 0.001), and worse visual function at baseline did not predict worse overall visual function at 1-year follow-up (joint test P = 0.1921). Age was not associated with visual function at 1-year follow-up ( Supplementary Table 3 shows the standardized regression coefficients for visual function at baseline, age and gender in models with only these predictors).
Table 5.
Prediction of clinical outcomes at 1-year follow-up with optic nerve measures at different time points
| Dependent variables | Joint test P -value | ||||||
|---|---|---|---|---|---|---|---|
| LogMAR | Humphrey | Colour vision | Sloan charts at 1.25% | Sloan charts at 5% | Sloan charts at 25% | ||
| Optic nerve measure a | Standardized regression coefficients (95% CI) from multivariate analyses | ||||||
| Affected optic nerve area at baseline | −0.257 (−0.655, 0.140) | 0.039 (−0.418, 0.496) | 0.283 (−0.052, 0.617) | 0.136 (−0.222, 0.495) | −0.122 (−0.505, 0.260) | −0.186 (−0.582, 0.210) | 0.0095 b |
| Affected optic nerve area at 3 months | −0.230 (−0.633, 0.173) | 0.216 (−0.107, 0.539) | −0.126 (−0.334, 0.083) | 0.174 (−0.213, 0.562) | 0.098 (−0.308, 0.504) | −0.138 (−0.545, 0.269) | 0.0006 b |
| Affected optic nerve area at 6 months | −0.020 (−0.193, 0.152) | 0.343 (0.013, 0.674) | −0.079 (−0.362, 0.205) | 0.136 (−0.200, 0.471) | 0.134 (−0.184, 0.452) | 0.042 (−0.219, 0.304) | 0.2280 |
| Lesion length of affected optic nerve at baseline | −0.116 (−0.506, 0.274) | −0.122 (−0.557, 0.312) | 0.268 (−0.183, 0.718) | 0.153 (−0.160, 0.466) | 0.185 (−0.142, 0.512) | 0.022 (−0.341, 0.386) | 0.0908 |
| Lesion length of affected optic nerve at 3 months | −0.007 (−0.342, 0.329) | −0.169 (−0.489, 0.152) | 0.032 (−0.180, 0.244) | 0.133 (−0.188, 0.454) | 0.242 (−0.059, 0.544) | 0.084 (−0.253, 0.421) | 0.1591 |
| Lesion length of affected optic nerve at 6 months | −0.013 (−0.135, 0.109) | −0.071 (−0.311, 0.169) | 0.128 (−0.069, 0.324) | 0.070 (−0.187, 0.327) | 0.089 (−0.157, 0.336) | 0.029 (−0.169, 0.227) | 0.4042 |
| Gd-enhanced lesion length of affected optic nerve at baseline | 0.205 (−0.152, 0.562) | −0.479 (−0.857, −0.102) | 0.584 (0.260, 0.907) | 0.104 (−0.217, 0.425) | 0.164 (−0.167, 0.496) | 0.206 (−0.138, 0.551) | 0.0386 c |
a The predictors (optic nerve measures) shown in the table were tested individually (one at a time), together with age, gender, and visual function and optic radiation lesion load at the same time point of the main predictor (i.e. optic nerve measure), either baseline, 3-month follow-up, or 6-month follow-up.
b Although the joint test shows a significant result (at 5% significance level, P < 0.05), the regression coefficients go in different ‘biological’ directions, so we have not considered this as a significant result.
c Here the joint test shows a significant result and the regression coefficients go in the same biological direction.
Associations between optic nerve, optic radiation variables and visual outcomes 1 year after optic neuritis
At 12 months after optic neuritis, greater optic nerve proton density-lesion lengths were associated with worse overall clinical outcome ( P = 0.0338). No optic radiation DTI metric was significantly associated with visual outcome at 1 year ( Table 6 ).
Table 6.
Associations between optic nerve and optic radiation variables and visual function at 1-year follow-up
| Dependent variables | Joint test P -value | ||||||
|---|---|---|---|---|---|---|---|
| LogMAR | Humphrey | Colour vision | Sloan charts at 1.25% | Sloan charts at 5% | Sloan charts at 25% | ||
| One-year measures a | Standardized regression coefficients (95% CI) from multivariate analyses | ||||||
| Affected optic nerve area | −0.080 (−0.718, 0.559) | −0.015 (−0.662, 0.632) | 0.154 (−0.471, 0.779) | 0.236 (−0.342, 0.815) | 0.194 (−0.430, 0.818) | −0.014 (−0.654, 0.626) | 0.1410 |
| Lesion length of affected optic nerve | 0.0442 (−0.343, 0.432) | −0.372 (−0.739, −0.004) | 0.434 (0.098, 0.770) | 0.114 (−0.237, 0.464) | 0.140 (−0.233, 0.513) | 0.069 (−0.310, 0.448) | 0.0338 b |
| Average FA | −0.281 (−0.980, 0.419) | −0.111 (−0.890, 0.668) | 0.034 (−0.992, 1.060) | −0.016 (−0.729, 0.698) | −0.205 (−0.857, 0.448) | −0.174 (−0.856, 0.508) | 0.1193 |
| Average RD | 0.101 (−0.350, 0.552) | −0.291 (−0.742, 0.161) | 0.143 (−0.407, 0.694) | −0.015 (−0.449, 0.418) | 0.023 (−0.391, 0.438) | −0.023 (−0.448, 0.402) | 0.0004 c |
| Average AD | 0.181 (−0.546, 0.907) | −0.373 (−1.086, 0.340) | 0.313 (−0.494, 1.119) | −0.105 (−0.711, 0.502) | −0.039 (−0.638, 0.560) | 0.012 (−0.623, 0.647) | 0.2043 |
a The predictors (optic nerve measures) shown in the table were tested individually (one at a time), together with age, gender, and visual function and optic radiation lesion load at the same time point of the main predictor (i.e. optic nerve measure), either baseline, 3-month follow-up, or 6-month follow-up.
b Here, all the coefficients pointed at the same biological direction and the joint test showed significant result at 5% significance level.
c Although the joint test showed a significant result, since the coefficients pointed at different biological directions, we ignored this result.
Discussion
In this longitudinal study, trans-synaptic degeneration occurring after an acute inflammatory insult was investigated by assessing microstructural changes in the optic radiations over 1 year following first episode acute optic neuritis. Our findings provide strong evidence of anterograde trans-synaptic degeneration in the visual pathway after optic neuritis because (i) optic radiation FA and RD demonstrate longitudinal degenerative changes over 12 months, even after adjusting for optic radiation lesion load; and (ii) after the acute optic nerve insult, smaller affected optic nerves at 3 months predict 12 month optic radiation FA and RD in a manner consistent with a trans-synaptic lag effect, again after adjusting for optic radiation lesion volume. We also found that better visual recovery after optic neuritis was associated with milder early inflammation of the optic nerve, whereas early optic nerve atrophy or greater optic radiation damage were not associated with the extent of visual recovery. We now discuss each of these findings and their implications in more detail.
After optic neuritis, there is progressive damage to the optic radiations that is independent of visible inflammation
This study shows that after optic neuritis there is progressive decrease in FA and increase in RD in the optic radiations that is independent of the presence of visible lesions in the same brain region.
FA reflects the degree of water diffusion anisotropy of a given tissue, that is, the degree of diffusion along the main direction of diffusion ( Pierpaoli and Basser, 1996 ). In our study, a progressive decrease in optic radiation FA implied that after the optic neuritis there was an increase in the ability of water molecules to diffuse in all spatial directions, instead of being restricted by the natural tissue boundaries such as axonal structures. This denotes progressive tissue damage in the optic radiations, as suggested by different ex vivo studies, where reduced FA can be associated with both demyelination ( Mottershead et al. , 2003 ; van Hecke et al. , 2009 ; Zollinger et al. , 2011 ), and axonal loss ( Renoux et al. , 2006 ). These results were supported by the presence of a progressive increase in RD in optic neuritis patients, implying a gradual increase in the ability of water molecules to diffuse across axonal fibres, reflecting either demyelination ( Klawiter et al. , 2011 ; Zollinger et al. , 2011 ) or axonal damage ( DeBoy et al. , 2007 ; Klawiter et al. , 2011 ). Previous studies have also reported increases in optic radiation RD in demyelination/optic neuritis ( Reich et al. , 2009 ; Li et al. , 2011 ; Kolbe et al. , 2012 a ; Rocca et al. , 2013 ). Of note, the estimated rates of change in diffusion properties of the optic radiations and the difference between patients and controls in these rates of change remained unaltered after adjusting for optic radiation lesion load, making it very unlikely that optic radiation lesions have a significant biological influence. Hence, our reported changes in optic radiation FA and RD probably reflect true microstructural changes most likely due to anterograde trans-synaptic degeneration, which could be one of the pathological substrates of the damage in normal-appearing brain tissue, at very early stages of multiple sclerosis ( Fernando et al. , 2005 ). In fact, although there may be an association between greater visible inflammation and more important damage in the normal-appearing brain tissue, this damage cannot only be explained by visible lesions, implying that other degenerative mechanisms are probably involved ( Fernando et al. , 2005 ).
Trans-synaptic degeneration has been proposed as a mechanism of axonal and neuronal damage in many diseases of the CNS, including multiple sclerosis ( Rocca et al. , 2013 ). It results from deafferentation across a synapse ( Ghetti et al. , 1972 ; Ghetti and Wisniewski, 1972 ), and histopathological studies have shown that after the damage (or destruction) of pre-synaptic neuron, both presynaptic axon terminal and postsynaptic dendrite are engulfed by astrocytes ( Ghetti and Wisniewski, 1972 ). Following this, myelinated postsynaptic axons start to show Wallerian degeneration ( Ghetti et al. , 1972 ). The observed longitudinal changes in optic radiation FA and RD in our optic neuritis patients are consistent with this mechanism.
After optic neuritis we did not observe significant changes in optic radiation AD over time. This is consistent with some previous studies ( Li et al. , 2011 ; Raz et al. , 2015 ) but not others, which have reported increases in optic radiation AD ( Reich et al. , 2009 ). Both increases ( Reich et al. , 2009 ; Zollinger et al. , 2011 ) and decreases ( DeBoy et al. , 2007 ; Kolbe et al. , 2012 a ) for AD in demyelination have been reported, hence an overall change in AD may reflect a balance between competing influences making pathological inferences difficult to interpret. Also, previous studies have tended to be cross-sectional, performed in patients with established multiple sclerosis and/or optic neuritis. As a result, optic radiation AD measurements may have been influenced by other, more chronic factors related to the underlying disease that would not have had time to affect the measurements in our study of incident optic neuritis. Additionally, it should be noted that the diffusion tensor is an approximation of the complex microstructure determining magnetic resonance signal in the presence of diffusion weighting. Therefore it is possible that the diffusion tensor does not capture damage along and across the main fibres of the optic radiations because the same damage blurs the true directions of the fibres ( Wheeler-Kingshott and Cercignani, 2009 ; Wheeler-Kingshott et al. , 2012 ). Another explanation for the non-significant AD change in our study could be simply lack of power due to inadequate sample size or measurement noise.
Early optic nerve atrophy after optic neuritis predicts more marked diffusion changes in the optic radiations
The proposed trans-synaptic mechanism of brain damage after optic neuritis is reinforced by the finding, in patients, of an association between smaller optic nerve areas of affected eyes 3 months after optic neuritis, and greater damage in the optic radiations 1 year after the optic neuritis, reflected by a greater decrease in FA, and greater increase in RD. At baseline assessment, the affected optic nerve areas were significantly larger than those of the unaffected and controls, explained by acute optic nerve swelling secondary to inflammation. As inflammation subsides, the affected optic nerve areas experienced an initial reduction in size—that slowed down in later months—and by 12 months the affected optic nerve areas were smaller than the unaffected and control eyes, implying neuroaxonal loss or optic nerve atrophy ( Trip et al. , 2006 ). Patients with optic neuritis with greater optic nerve axonal loss at 3 months (relatively early after the acute insult) developed greater damage in the optic radiations at 12 months, supporting the presence of trans-synaptic degeneration. Importantly, these associations were present after adjusting for the optic radiation lesion load, again suggesting a degree of independence between visible white matter inflammation and microstructural changes in the optic radiations after the optic neuritis.
Damage in optic radiations after optic neuritis suggesting anterograde trans-synaptic degeneration has been described by some authors ( Ciccarelli et al. , 2005 ; Korsholm et al. , 2007 ; Kolbe et al. , 2012 a ), but not others. A recent cross-sectional study did not show any correlation between RNFL thickness and optic radiation damage in a cohort of 17 patients with optic neuritis ( Raz et al. , 2015 ). Notably, our longitudinal study conveys a temporal association between optic nerve and optic radiation structure further supporting trans-synaptic degeneration.
Better visual recovery after optic neuritis correlates with milder early inflammation of the optic nerve
Longer baseline Gd-enhanced lesion length was associated with poorer visual function at 12 months, adjusting for optic radiation lesion volume, age, gender, and baseline visual scores. Also, longer optic nerve lesions (measured on proton density MRI) at 3 and 6 months also predicted worse overall clinical outcome at 1 year, although this became non-significant when adjusting for visual scores and optic radiation lesion load, at both 3 and 6 months. Finally, at 1-year follow-up greater optic nerve proton density-lesion length, probably reflecting greater local secondary degeneration, of either Wallerian or retrograde type, was associated with worse overall clinical outcome, after adjusting for age, gender, and optic radiation lesion load. These results are consistent with previous studies and reflect that the immediate mechanism of visual impairment after an optic neuritis and its recovery are mainly related to local changes within the optic nerve, such as swelling, which may compress optic nerve axons ( Hickman et al. , 2004 ). Thus, those patients with smaller proton density–lesion lengths at 1 year also had better visual outcomes. Remarkably, those patients with smaller optic nerve areas at any time of the follow-up, however, did not have a worse visual outcome, in line with previous studies that suggested the presence of redundancy of tissue or remodelling of function within the optic nerve ( Hickman et al. , 2004 ). Of note, in a previous analysis of our data, when a more conventional regression-type statistical approach was conducted, we did not find a significant association between acute structural measures of the optic nerve and visual function at 12 months ( Jenkins et al. , 2010 b ). In the present study, we adopted a multivariate approach with a multiple imputation method to account for missing data. Although multivariate approaches are generally more conservative and only the most robust associations are detected, the fact that they can also account for missing data can increase the power to detect significant associations ( Abdel-Aziz et al. , 2015 ). This probably explains the discrepancy between the two analyses.
In our study, none of the optic radiation metrics were significantly associated with visual outcomes at 1 year. Other authors have reported some correlations between optic radiation changes and visual function after optic neuritis ( Reich et al. , 2009 ). However, these correlations had been observed in patients with established multiple sclerosis, probably reflecting a longstanding impact of optic radiation damage on visual function ( Reich et al. , 2009 ). Instead, our study was carried out in a population selected for having recently suffered an acute optic neuritis as CIS, and therefore with practically no disease duration, meaning that a hypothetical impact of optic radiations on visual function might not have had enough time to develop. Besides, the results are not consistent across studies ( Kolbe et al. , 2012 b ), and the role on visual function of post-geniculate nucleus damage following optic neuritis needs still to be confirmed.
Neither poorer vision at baseline nor age predicted worse overall visual outcome at 1 year (as shown in Supplementary Table 3 ). Interestingly, males showed a clear poorer overall visual outcome at 1-year follow-up, as previously described ( Costello et al. , 2012 , 2015 ; Malik et al. , 2014 ). However, further research is required to determine the causes of this gender difference.
In our study, 11 patients converted to clinically definite multiple sclerosis during the follow-up, whereas 13 patients did not. Remarkably, in spite of those who presented a second relapse having higher optic radiation lesion loads at baseline than those who did not, the baseline values of the diffusion metrics in the optic radiations were very similar for the two groups. This not only suggests a relative independence of visible inflammation and diffusivity metrics, but also reinforces the main message of our paper, where we show that over time there is a progressive damage in the optic radiations that seems to be independent of visible inflammation, and which seems to be reflecting a trans-synaptic degeneration.
Although our study has a longitudinal design that allowed us to model the evolution of changes over time in the optic radiations and determine their associations with anterior visual pathway structure, there are additional points to consider. We did not apply lesion masks to the optic radiations when obtaining the optic radiation diffusion metrics. Of note, when we designed this study, we thought that the assessment of the parts of the white matter tracts where lesions were nested could also be of interest, as they could also provide important information on tissue microstructure. Additionally, even if we had masked the lesions, we would still not have been able to exclude the local effect of visible lesions on the optic radiations through Wallerian degeneration.
However, to ensure that our results were not just driven by optic radiation lesions, we adjusted for the optic radiation lesion loads, as performed by other authors ( Balk et al. , 2015 ), at baseline and over the follow-up period. Both the change in optic radiation diffusion metrics in patients with optic neuritis over time and the association between smaller optic nerve at 3 months and greater optic radiation damage at 1-year follow-up remained significant. We also carried out post hoc analyses in which we reran the models described in the first stage of our study but excluded patients with highest optic radiation lesion loads. Namely, we reran these models excluding patients with optic radiation lesion loads ≥392 ml (90th percentile of optic radiation lesion load at 12 months), and in a separate model excluding patients with optic radiation lesion loads ≥172 ml (75th percentile of optic radiation lesion load at 12 months). In these two analyses, patients—unlike controls—again showed a significant decrease in FA and a significant increase in RD, as with the original analysis of the whole cohort. In addition, neither the direction nor the magnitude of the regression coefficients for FA and RD changed substantially (data not shown). Similarly, when we reran the models of the second stage of our analysis using only these subsamples with lower optic radiation lesion loads, the results still remained significant, i.e. smaller optic nerve areas at 3 months significantly predicted lower optic radiation FA and higher optic radiation RD at 1-year follow-up (data not shown).
Besides, as other authors have also shown, in our study the proportion of the tract volume occupied by lesions was very small, i.e. <3%, meaning that the potential impact of these lesions on the diffusion measures was probably negligible. In fact, at baseline, where some of the optic neuritis patients already showed white matter lesions in the optic radiations, the values of optic radiation FA, RD, and AD were very similar in patients and controls (none of the comparisons were statistically significant), again implying that the impact of lesions on the averaged optic radiation diffusivity metrics was minimal.
Finally, even if the results of the first stage of our analysis, i.e. the presence of changes in optic radiation diffusion metrics over time after optic neuritis, could potentially have been influenced by optic radiation lesional diffusivity or could have reflected a global progressive neurodegenerative phenomenon, the results of the second part of the analysis, i.e. smaller optic nerve areas predict worse optic radiation FA and RD independently of optic radiation lesion load, still provide robust longitudinal evidence for anterograde trans-synaptic degeneration. Of course, it may well be that newer diffusion-related techniques such as Neurite Orientation Dispersion and Density Imaging (NODDI) ( Zhang et al. , 2012 ; Grussu et al. , 2015 ) will provide better understanding of microstructural changes underlying brain damage. Future studies using this and other techniques highly sensitive to tissue microstructure, and focusing on not only the optic radiations, but also on other white matter tracts not related to visual system, could further improve our knowledge of trans-synaptic degeneration.
Furthermore, our multivariate analysis assumes that the directional characteristics of the dependent variables behave in a biologically congruent manner. This is likely to be appropriate for both the DTI metrics, where FA and RD are known to reflect two aspects of the same process, i.e. the diffusion of water molecules in a given tissue, and the clinical variables, which improved over time in a similar non-linear way ( Supplementary Table 2 ). This suggests that our (conservative) approach of considering as significant only those associations that showed a similar biological direction was appropriate. With this approach, the risk of type I error was smaller than adopting other statistical approaches, hence ensuring that only the most robust associations were reported.
In conclusion, our study provides longitudinal evidence of damage occurring in the optic radiations following optic neuritis, which is independent of white matter inflammation and more pronounced in patients with signs of post-acute optic nerve atrophy. This is strongly supportive of anterograde trans-synaptic degeneration. The lack of association between optic radiation structural metrics and visual outcomes implies that local optic nerve factors played a greater role in this cohort, and perhaps for this relationship our study was underpowered. Future studies could investigate the clinical consequences of the post-synaptic changes that occur after optic neuritis, and whether they are due to the accumulation of structural brain damage or whether they are better explained by a disruption of brain structural connectivity secondary to axonal damage. Also, future trials using neuroprotective agents could evaluate the downstream effects on optic radiation structure and whether optic radiation damage could be ameliorated by early intervention to prevent optic nerve atrophy.
Supplementary Material
Acknowledgements
The authors thank the participants of the study, and Dr G. Plant for clinical input.
Funding
The NMR unit (current Queen Square MS centre) where this work was performed is supported by grants from the Multiple Sclerosis Society of Great Britain and Northern Ireland, Philips Healthcare, and supported by the University College London/University College London Hospitals National Institute for Health Research (UCL/UCLH NIHR), Biomedical Research Centre (BRC). C. Tur has received a post-doctoral research ECTRIMS fellowship (2015). The MS Society of Great Britain and Northern Ireland provided a charity research grant which was used to fund this study (T.M. Jenkins grant 815/04).
Supplementary material
Supplementary material is available at Brain online.
Glossary
Abbreviations
- AD
axial diffusivity
- DTI
diffusion tensor imaging
- FA
fractional anisotropy
- RD
radial diffusivity
References
- Abdel-Aziz K, Schneider T, Solanky BS, Yiannakas MC, Altmann DR, Wheeler-Kingshott CA, et al. . Evidence for early neurodegeneration in the cervical cord of patients with primary progressive multiple sclerosis . Brain 2015. ; 138 ( Pt 6 ): 1568 – 82 . [DOI] [PMC free article] [PubMed] [Google Scholar]
- Audoin B, Fernando KT, Swanton JK, Thompson AJ, Plant GT, Miller DH . Selective magnetization transfer ratio decrease in the visual cortex following optic neuritis . Brain 2006. ; 129 ( Pt 4 ): 1031 – 9 . [DOI] [PubMed] [Google Scholar]
- Balk LJ, Steenwijk MD, Tewarie P, Daams M, Killestein J, Wattjes MP, et al. . Bidirectional trans-synaptic axonal degeneration in the visual pathway in multiple sclerosis . J Neurol Neurosurg Psychiatry 2015. ; 86 : 419 – 24 . [DOI] [PubMed] [Google Scholar]
- Basser PJ, Mattiello J, LeBihan D . Estimation of the effective self-diffusion tensor from the NMR spin echo . J Magn Reson B 1994. ; 103 : 247 – 54 . [DOI] [PubMed] [Google Scholar]
- Beaulieu C . The basis of anisotropic water diffusion in the nervous system: a technical review . NMR Biomed 2002. ; 15 : 435 – 55 . [DOI] [PubMed] [Google Scholar]
- Ciccarelli O, Toosy AT, Hickman SJ, Parker GJ, Wheeler-Kingshott CA, Miller DH, et al. . Optic radiation changes after optic neuritis detected by tractography-based group mapping . Hum Brain Mapp 2005. ; 25 : 308 – 16 . [DOI] [PMC free article] [PubMed] [Google Scholar]
- Cook PA, Symms M, Boulby PA, Alexander DC . Optimal acquisition orders of diffusion-weighted MRI measurements . J Magn Reson Imaging 2007. ; 25 : 1051 – 8 . [DOI] [PubMed] [Google Scholar]
- Costello F, Hodge W, Pan YI, Burton JM, Freedman MS, Stys PK, et al. . Sex-specific differences in retinal nerve fiber layer thinning after acute optic neuritis . Neurology 2012. ; 79 : 1866 – 72 . [DOI] [PMC free article] [PubMed] [Google Scholar]
- Costello F, Pan YI, Yeh EA, Hodge W, Burton JM, Kardon R . The temporal evolution of structural and functional measures after acute optic neuritis . J Neurol Neurosurg Psychiatry 2015. ; 86 : 1369 – 73 . [DOI] [PubMed] [Google Scholar]
- DeBoy CA, Zhang J, Dike S, Shats I, Jones M, Reich DS, et al. . High resolution diffusion tensor imaging of axonal damage in focal inflammatory and demyelinating lesions in rat spinal cord . Brain 2007. ; 130 ( Pt 8 ): 2199 – 210 . [DOI] [PubMed] [Google Scholar]
- Farnsworth D . The Farnsworth-Munsell 100-hue and dichotomous tests for color vision . J Opt Soc Am 1943. ; 33 : 568 – 78 . [Google Scholar]
- Fernando KT, Tozer DJ, Miszkiel KA, Gordon RM, Swanton JK, Dalton CM, et al. . Magnetization transfer histograms in clinically isolated syndromes suggestive of multiple sclerosis . Brain 2005. ; 128 ( Pt 12 ): 2911 – 25 . [DOI] [PubMed] [Google Scholar]
- Ferris FL, III, Kassoff A, Bresnick GH, Bailey I . New visual acuity charts for clinical research . Am J Ophthalmol 1982. ; 94 : 91 – 6 . [PubMed] [Google Scholar]
- Gabilondo I, Martinez-Lapiscina EH, Martinez-Heras E, Fraga-Pumar E, Llufriu S, Ortiz S, et al. . Trans-synaptic axonal degeneration in the visual pathway in multiple sclerosis . Ann Neurol 2014. ; 75 : 98 – 107 . [DOI] [PubMed] [Google Scholar]
- Ghetti B, Horoupian DS, Wisniewski HM . Transsynaptic response of the lateral geniculate nucleus and the pattern of degeneration of the nerve terminals in the rhesus monkey after eye enucleation . Brain Res 1972. ; 45 : 31 – 48 . [DOI] [PubMed] [Google Scholar]
- Ghetti B, Wisniewski HM . On degeneration of terminals in the cat striate cortex . Brain Res 1972. ; 44 : 630 – 5 . [DOI] [PubMed] [Google Scholar]
- Grussu F, Schneider T, Zhang H, Alexander DC, Wheeler-Kingshott CA . Neurite orientation dispersion and density imaging of the healthy cervical spinal cord in vivo . Neuroimage 2015. ; 111 : 590 – 601 . [DOI] [PubMed] [Google Scholar]
- Hickman SJ, Brex PA, Brierley CMH, Silver NC, Barker GJ, Scolding NJ, et al. . Detection of optic nerve atrophy following a single episode of unilateral optic neuritis by MRI using a fat-saturated short-echo fast FLAIR sequence . Neuroradiology 2001. ; 43 : 123 – 8 . [DOI] [PubMed] [Google Scholar]
- Hickman SJ, Brierley CM, Brex PA, MacManus DG, Scolding NJ, Compston DA, et al. . Continuing optic nerve atrophy following optic neuritis: a serial MRI study . Mult Scler 2002. ; 8 : 339 – 42 . [DOI] [PubMed] [Google Scholar]
- Hickman SJ, Toosy AT, Jones SJ, Altmann DR, Miszkiel KA, MacManus DG, et al. . A serial MRI study following optic nerve mean area in acute optic neuritis . Brain 2004. ; 127 ( Pt 11 ): 2498 – 505 . [DOI] [PubMed] [Google Scholar]
- Jenkins T, Ciccarelli O, Toosy A, Miszkiel K, Wheeler-Kingshott C, Altmann D, et al. . Dissecting structure-function interactions in acute optic neuritis to investigate neuroplasticity . Hum Brain Mapp 2010a. ; 31 : 276 – 86 . [DOI] [PMC free article] [PubMed] [Google Scholar]
- Jenkins TM, Ciccarelli O, Atzori M, Wheeler-Kingshott CA, Miller DH, Thompson AJ, et al. . Early pericalcarine atrophy in acute optic neuritis is associated with conversion to multiple sclerosis . J Neurol Neurosurg Psychiatry 2011. ; 82 : 1017 – 21 . [DOI] [PubMed] [Google Scholar]
- Jenkins TM, Toosy AT, Ciccarelli O, Miszkiel KA, Wheeler-Kingshott CA, Henderson AP, et al. . Neuroplasticity predicts outcome of optic neuritis independent of tissue damage . Ann Neurol 2010b. ; 67 : 99 – 113 . [DOI] [PubMed] [Google Scholar]
- Klawiter EC, Schmidt RE, Trinkaus K, Liang HF, Budde MD, Naismith RT, et al. . Radial diffusivity predicts demyelination in ex vivo multiple sclerosis spinal cords . Neuroimage 2011. ; 55 : 1454 – 60 . [DOI] [PMC free article] [PubMed] [Google Scholar]
- Kolbe S, Bajraszewski C, Chapman C, Nguyen T, Mitchell P, Paine M, et al. . Diffusion tensor imaging of the optic radiations after optic neuritis . Hum Brain Mapp 2012a. ; 33 : 2047 – 61 . [DOI] [PMC free article] [PubMed] [Google Scholar]
- Kolbe SC, Marriott M, Walt A, Fielding J, Klistorner A, Mitchell PJ, et al. . Diffusion tensor imaging correlates of visual impairment in multiple sclerosis and chronic optic neuritis . Invest Ophthalmol Vis Sci 2012b. ; 53 : 825 – 32 . [DOI] [PubMed] [Google Scholar]
- Korsholm K, Madsen KH, Frederiksen JL, Skimminge A, Lund TE . Recovery from optic neuritis: an ROI-based analysis of LGN and visual cortical areas . Brain 2007. ; 130 ( Pt 5 ): 1244 – 53 . [DOI] [PubMed] [Google Scholar]
- Li M, Li J, He H, Wang Z, Lv B, Li W, et al. . Directional diffusivity changes in the optic nerve and optic radiation in optic neuritis . Br J Radiol 2011. ; 84 : 304 – 14 . [DOI] [PMC free article] [PubMed] [Google Scholar]
- Malik MT, Healy BC, Benson LA, Kivisakk P, Musallam A, Weiner HL, et al. . Factors associated with recovery from acute optic neuritis in patients with multiple sclerosis . Neurology 2014. ; 82 : 2173 – 9 . [DOI] [PMC free article] [PubMed] [Google Scholar]
- Mottershead JP, Schmierer K, Clemence M, Thornton JS, Scaravilli F, Barker GJ, et al. . High field MRI correlates of myelin content and axonal density in multiple sclerosis–a post-mortem study of the spinal cord . J Neurol 2003. ; 250 : 1293 – 301 . [DOI] [PubMed] [Google Scholar]
- Optic Neuritis Study Group . The clinical profile of optic neuritis. Experience of the optic neuritis treatment trial . Arch Ophthalmol 1991. ; 109 : 1673 – 8 . [DOI] [PubMed] [Google Scholar]
- Pierpaoli C, Basser PJ . Toward a quantitative assessment of diffusion anisotropy . Magn Reson Med 1996. ; 36 : 893 – 906 . [DOI] [PubMed] [Google Scholar]
- Plummer DL . DispImage: un mezzo di analisi e presentazione per iconografia medica [DispImage: a display and analysis tool for medical images] . Riv Neuroradiol 1992. ; 5 : 489 – 95 . [Google Scholar]
- Raz N, Bick AS, Ben-Hur T, Levin N . Focal demyelinative damage and neighboring white matter integrity: an optic neuritis study . Mult Scler 2015. ; 21 : 562 – 71 . [DOI] [PubMed] [Google Scholar]
- Reich DS, Smith SA, Gordon-Lipkin EM, Ozturk A, Caffo BS, Balcer LJ, et al. . Damage to the optic radiation in multiple sclerosis is associated with retinal injury and visual disability . Arch Neurol 2009. ; 66 : 998 – 1006 . [DOI] [PMC free article] [PubMed] [Google Scholar]
- Renoux J, Facon D, Fillard P, Huynh I, Lasjaunias P, Ducreux D . MR diffusion tensor imaging and fiber tracking in inflammatory diseases of the spinal cord . AJNR Am J Neuroradiol 2006. ; 27 : 1947 – 51 . [PMC free article] [PubMed] [Google Scholar]
- Rocca MA, Mesaros S, Preziosa P, Pagani E, Stosic-Opincal T, Dujmovic-Basuroski I, et al. . Wallerian and trans-synaptic degeneration contribute to optic radiation damage in multiple sclerosis: a diffusion tensor MRI study . Mult Scler 2013. ; 19 : 1610 – 17 . [DOI] [PubMed] [Google Scholar]
- Smith KJ, McDonald WI . The pathophysiology of multiple sclerosis: the mechanisms underlying the production of symptoms and the natural history of the disease . Philos Trans R Soc Lond B Biol Sci 1999. ; 354 : 1649 – 73 . [DOI] [PMC free article] [PubMed] [Google Scholar]
- Toosy AT, Hickman SJ, Miszkiel KA, Jones SJ, Plant GT, Altmann DR, et al. . Adaptive cortical plasticity in higher visual areas after acute optic neuritis . Ann Neurol 2005. ; 57 : 622 – 33 . [DOI] [PubMed] [Google Scholar]
- Toosy AT, Mason DF, Miller DH . Optic neuritis . Lancet Neurol 2014. ; 13 : 83 – 99 . [DOI] [PubMed] [Google Scholar]
- Trip SA, Schlottmann PG, Jones SJ, Li WY, Garway-Heath DF, Thompson AJ, et al. . Optic nerve atrophy and retinal nerve fibre layer thinning following optic neuritis: evidence that axonal loss is a substrate of MRI-detected atrophy . Neuroimage 2006. ; 31 : 286 – 93 . [DOI] [PubMed] [Google Scholar]
- van Hecke W, Nagels G, Emonds G, Leemans A, Sijbers J, van Goethem J, et al. . A diffusion tensor imaging group study of the spinal cord in multiple sclerosis patients with and without T2 spinal cord lesions . J Magn Reson Imaging 2009. ; 30 : 25 – 34 . [DOI] [PubMed] [Google Scholar]
- Wheeler-Kingshott CA, Cercignani M . About “axial” and “radial” diffusivities . Magn Reson Med 2009. ; 61 : 1255 – 60 . [DOI] [PubMed] [Google Scholar]
- Wheeler-Kingshott CA, Ciccarelli O, Schneider T, Alexander DC, Cercignani M . A new approach to structural integrity assessment based on axial and radial diffusivities . Funct Neurol 2012. ; 27 : 85 – 90 . [PMC free article] [PubMed] [Google Scholar]
- Zhang H, Schneider T, Wheeler-Kingshott CA, Alexander DC . NODDI: practical in vivo neurite orientation dispersion and density imaging of the human brain . Neuroimage 2012. ; 61 : 1000 – 16 . [DOI] [PubMed] [Google Scholar]
- Zollinger LV, Kim TH, Hill K, Jeong EK, Rose JW . Using diffusion tensor imaging and immunofluorescent assay to evaluate the pathology of multiple sclerosis . J Magn Reson Imaging 2011. ; 33 : 557 – 64 . [DOI] [PMC free article] [PubMed] [Google Scholar]
Associated Data
This section collects any data citations, data availability statements, or supplementary materials included in this article.