Abstract

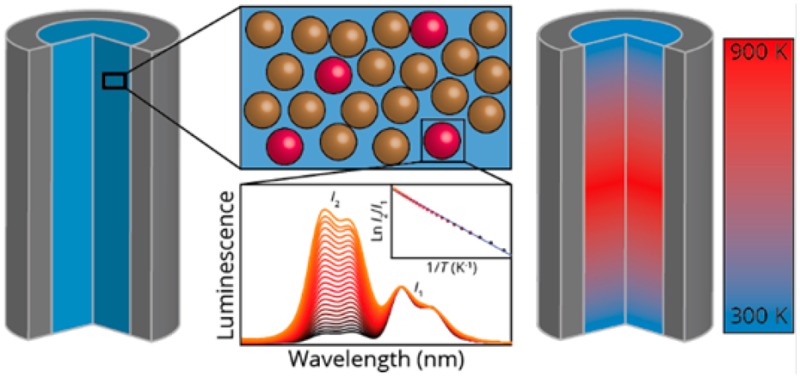
Bandshape luminescence thermometry during in situ temperature measurements has been reported by preparing three catalytically relevant systems, which show temperature-dependent luminescence. One of these systems was further investigated as a showcase for application. Microcrystalline NaYF4 doped with Er3+ and Yb3+ was mixed with a commercial zeolite H-ZSM-5 to investigate the Methanol-to-Hydrocarbons (MTH) reaction, while monitoring the reaction products with online gas chromatography. Due to the exothermic nature of the MTH reaction, a front of increased temperature migrating down the fixed reactor bed was visualized, showing the potential for various applications of luminescence thermometry for in situ measurements in catalytic systems.
Keywords: bandshape luminescence thermometry, in situ temperature measurements, methanol-to-hydrocarbons, upconversion, lanthanides, luminescence
To optimize the activity, selectivity, and stability of catalytic reactions, it is important to optimize parameters such as reaction temperature. However, interparticle heterogeneities and local gradients in the reactor due to exothermal or endothermal processes can result in lower or higher catalyst performances and even reactor runaways.1 Although the local temperature profile is very important for catalytic performance in view of the Arrhenius equation, local temperature fluctuations are still difficult to analyze properly. To investigate the local temperature fluctuations, it is important to have a thermometry technique, which is noninvasive and has a high spatial and temporal resolution.
Bandshape luminescence thermometry2,3 is a promising method to locally measure temperatures noninvasively. This technique exploits two thermally coupled emitting states, which show temperature-dependent luminescence upon excitation because of a Boltzmann distribution of the emitting states. A great advantage of this technique is that it is based on the intensity ratio of emission from two states and is therefore independent of probe concentration or fluctuations in the excitation or light collection efficiency.
Bandshape luminescence thermometry has already been investigated thoroughly for bioimaging application using lanthanide doped organic complexes.4 By incorporating lanthanide ions, for example, Er3+, in inorganic (nano)crystals,5 the temperature range has been expanded,6,7 resulting in a wider range of applications eligible for luminescence thermometry.8,9
To understand the performance of a catalyst, it is important to investigate it under working conditions, resulting in an active field of catalyst research. In situ measurements are a powerful tool to expand our knowledge of catalytic systems. The simultaneous evaluation of the catalyst itself and the reaction products via, for example, gas chromatography (GC), can also give mechanistic insight in catalyst reactions and related deactivation pathways.
Previous in situ measurements to visualize a temperature gradient along a catalyst bed have been performed with either IR-thermography,10,11 NMR-thermometry,12 or using multiple thermocouples13 to monitor the temperature at different heights in a catalyst bed. For IR-thermography and NMR-thermometry, the resolution is limited typically to the mm range. Furthermore, the data interpretation for NMR-thermometry can be both cumbersome and dependent on the concentration of the probed species, while the interpretation of IR-thermography might become difficult if light absorbing species are present in the reactor. The use of thermocouples also yields a very limited spatial resolution and the noninvasiveness of the technique cannot be guaranteed. Hence, there is clear room for improved reactor and catalyst particle thermometry.
In this work, we demonstrate the potential for luminescence thermometry as an in situ measurement technique during catalytic processes. Therefore, three different systems have been prepared, all with different length scales to enable thermometry with varying spatial resolution. SEM micrographs of microcrystalline NaYF4 of ca. 5–20 μm (a), 50 nm NaYF4 nanoparticles (NPs) deposited on a Al2O3 support (b) and finally a photograph of NaYF4 NPs incorporated in extrudates (c) are shown in Figure 1. The NPs have a NaYF4 core of ca. 20 nm and a SiO2 shell to prevent sintering of particles and therefore increase the thermal stability. In all cases the NaYF4 was doped with Er3+ and Yb3+, resulting in characteristic temperature-dependent luminescence.14,15
Figure 1.
SEM micrographs of microcrystalline NaYF4 (a), NaYF4 nanoparticles (NPs) deposited on Al2O3 (b), and a photo of extrudates containing NaYF4 NPs (c). The insets show the temperature-dependent luminescence of the systems as discussed in the Supporting Information.
Luminescence studies showed temperature-dependent luminescence behavior for all three samples upon upconversion excitation14 at 980 nm, as shown in the insets of Figure 1. Here, the log of the intensity ratio of the two emitting states (4S3/2 and 2H11/2 excited state) is plotted vs reciprocal temperature. The linear fits are used to determine the reaction temperature from a spectral output with an accuracy of 1 to 5 K. A more detailed presentation of the luminescence studies can be found in our earlier work15 and Figure S1 in the Supporting Information (SI).
To further investigate the applicability of the systems, the microcrystalline NaYF4 was used as a showcase during the Methanol-to-Hydrocarbons (MTH) reaction by mixing it with a commercial, solid catalyst, zeolite H-ZSM-5, in a fixed bed reactor.
The NaYF4:Er,Yb in the reactor could be excited, using a fiber probe and temperature-dependent luminescence spectra were collected with the same fiber probe from different heights in the catalyst bed during the reaction. The reaction temperature was calculated from the luminescence output over the course of the reaction. It was shown that the local temperature during in situ measurements can be measured very accurately in a noninvasive manner.
The setup used during these experiments is shown in Figure S2. In MTH, after a short induction time, 100% of the methanol is converted into a wide variety of hydrocarbons with dimethyl ether (DME) as intermediate product (according to the simplified reaction of the MTH process: 2 CH3OH ⇄ CH3OCH3 + H2O → Light olefins + H2O).
Under the current reaction conditions (discussed in SI), using H-ZSM-5 (Si/Al = 25) as catalyst, the main products of this reaction are propylene, ethylene, and C4 olefins as was measured with online GC (Figure S3).
Extensive research has been done on the mechanism of this MTH process and the hydrocarbon pool mechanism is currently the most widely accepted reaction mechanism.16−18 The conversion of methanol into light olefins is exothermic, and the ΔH of the formation of typical reaction products, e.g., ethylene and propylene is −11 and −42 kJ mol–1, respectively.19 The methanol is introduced at the top of the reactor and fully converted in the top of the catalyst bed. Therefore, it is expected that the heat production is initially the highest at the top of the catalyst bed. Due to coke deposition, the catalyst deactivates over time,20−23 resulting in a longer path length of the methanol before it reaches active sites to do the conversion. In this way, only a small part of the bed moving down through the reactor is active toward methanol conversion. The combination of the exothermic nature of the reaction and the deactivation of the catalyst results in a heat front in the catalyst bed that shifts from top to bottom over time.
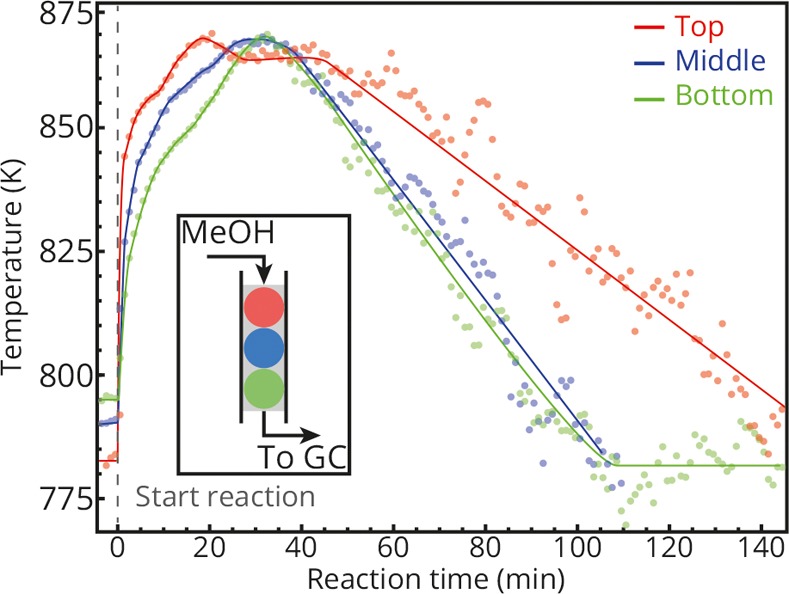
The three temperature profiles that were measured at the top, middle and bottom of the catalyst bed during the MTH reaction are shown in Figure 2. A trend-line is drawn through the data points to guide the eye. The temperature uncertainty24 of the technique is very low at the start of the reaction (0.3 K) and increases over time due to reduced signal toward ca. 22 K between 110 and 140 min.
Figure 2.

Observed temperatures over time determined by luminescence thermometry at the top (red), middle (blue), and bottom (green) of a fixed bed reactor.
Note that before the reaction starts, the temperatures are different at the top, middle and bottom of the reactor. This is most likely due to the relatively cold (473 K) gases, which are introduced to the fixed bed via the top. This phenomenon has also been observed by Yarulina and co-workers.13
At all three positions, we see a rapid increase of temperature upon starting the reaction. The temperature at the top spikes first, followed by a temperature maximum in the middle and afterward a temperature maximum at the bottom of the reactor. At the conditions used, the reaction is operating at 100% methanol conversion for 400 min, while the temperature at the bottom of the reactor is at its maximum around 30 min.
In the recent work of Yarulina et al.,13 the gradual deactivation of the catalyst bed is aligned with the temperature maxima at different heights in the reactor bed. When the regions in the reactor are nicely separated, the position, where methanol is converted, moves down after deactivation of the top of the reactor. A decrease in methanol conversion occurs when the deactivation front reaches the bottom of the catalyst bed. However, in comparison to the work of Yarulina et al., the results in Figure 2 were obtained with higher flow speeds and a relatively short reactor bed. Therefore, in this case, the active regions in the reactor bed are not separated and the temperature front is not aligned with the deactivation of the reactor. The three successive temperature maxima from top to bottom can be explained as a gradual activation of the catalyst bed. After this gradual activation, indicated by the three spikes in temperature that were shown in Figure 2, the temperature starts to decrease over the whole reactor. The temperature decrease is the largest for the bottom and middle of the reactor, while the top of the reactor stays warmer for a longer period. After 140 min of reaction, the temperature at all different points in the reactor is similar to the initial temperature before the reaction.
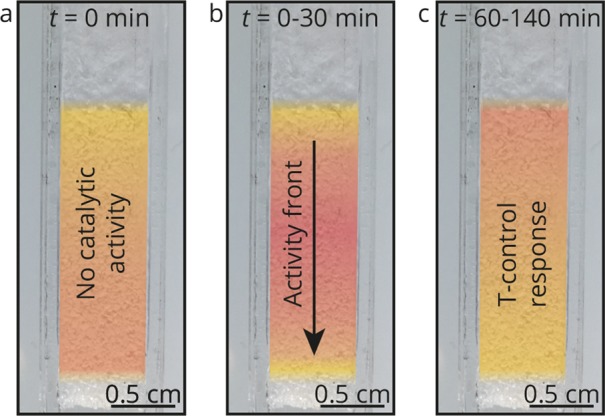
During the reaction, the temperature of the reactor is controlled by a thermocouple inside the oven. One explanation for the decrease after ca. 30 min is that the thermocouple feedback reduces the reactor heater power output after the fast temperature increase due to the exothermic reactions taking place. Because there is still more methanol converted at the top of the reactor than at the rest of the reactor, the top part cools down slower compared to the middle and bottom part as shown in Figure 3.
Figure 3.

Temperature profiles of the reactor at t = 0 min (a), t = 0–30 min (b), and t = 60–140 min (c).
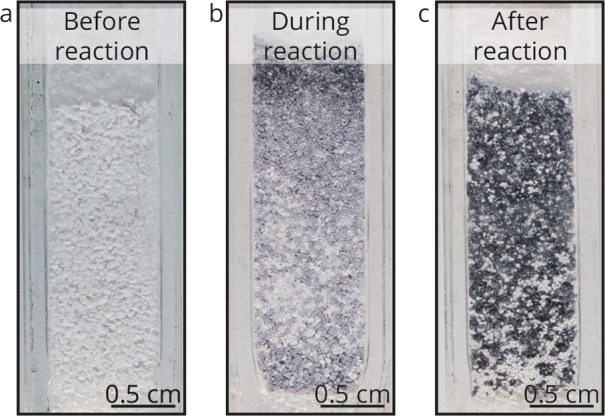
From Figure 4, it can be seen that during the reaction, the catalyst particles become darker due to coke deposition. This effect starts at the top of the reactor, and after the reaction, the catalyst is completely coked. It is very interesting to see that the coke deposition only occurs at the zeolite particles; the temperature probes are not affected by the coke deposition and stay white, showing their inertness toward reactive gases. Despite the fact that the coke deposition on the catalyst particles absorbs the luminescence from the temperature probes, which severely reduces the luminescence intensity during experiments, it was still possible to measure sufficient luminescence output and calculate temperatures inside the reactor.
Figure 4.

Photographs of the reactor before (a), during (t = 120 min, b), and after the reaction (t = 400 min, c).
The measured temperature front which moves over the reactor is consistent with literature and the observations of the coke deposition during the reaction. This experiment shows the potential of luminescence thermometry to measure the temperature in catalytic reactions with a noninvasive probing technique.
Although the potential of luminescence thermometry has been demonstrated with these experiments, the microcrystalline temperature probes with a final size of 150–425 μm may have limited applicability in other experimental setups due to the size constraints. To ensure the applicability of luminescence thermometry in a broader range of catalytic systems, it is possible to prepare different temperature probe particles that can be embedded in or placed on different support materials, as shown in Figure 1.
Many different catalytic reactions exploit NP catalysts to increase the surface to volume ratio. In most cases, the catalyst NPs are supported on an inorganic material to increase their mechanical and thermal stability and to prevent activity loss of the catalyst due to sintering of the NPs. A widely used support, Al2O3 is shown in the SEM image in Figure 1b. In order to measure the temperature at the surface of the support, it is possible to deposit NaYF4:Er,Yb@SiO2 core/shell NPs (zoom-in) and subsequently measure the temperature-dependent luminescence (inset), which is similar to the temperature-dependent luminescence observed in Figure 1a. The NPs used in these extrudates were prepared as discussed in earlier work.15 To prevent sintering of the NPs at elevated temperatures, the particles are coated with a silica shell.25 This ensures thermal stability up to at least 900 K.
For larger-scale reactors, using bigger catalyst bodies, like extrudates, is more suitable to prevent a pressure drop in the reactor bed. Figure 1c shows a photograph of extrudates with NaYF4:Er,Yb@SiO2 core/shell NPs incorporated that can be added to a reactor system to locally measure the temperature in a larger reactor bed. These mm-sized extrudates show green upconversion luminescence upon excitation with a 980 nm laser source, which is temperature-dependent (inset) similar to the luminescence shown in Figure 1a,b.
By expanding the system from the microcrystalline NaYF4:Er,Yb in the showcase MTH reaction to NPs, which can be incorporated into supported systems or extrudates, the potential of luminescence thermometry has been greatly increased. By combining the luminescence thermometry with a confocal microscope with spectral output, the spatial resolution can be enhanced to the submicrometer regime enabling to investigate temperature heterogeneities at all different length scales.
In conclusion, using temperature-dependent luminescence of NaYF4:Er,Yb crystallites, the temperature was probed over the course of a catalytic reaction at different heights in a reactor bed. The obtained results show a clear potential for luminescence thermometry for noninvasive in situ temperature measurements. Using the luminescence output upon excitation of the temperature probes inside a working reactor, the temperatures were determined at three different heights. For the MTH process, it was shown that the introduction of the methanol leads to an increased temperature due to the exothermic nature of the MTH reaction and revealed differences in the time-dependent temperature profiles at different heights in the reactor.
By decreasing the size of the temperature probes from micro- to nanoparticles, it is possible to incorporate the temperature probes in other catalyst particles, for example, extrudates or other type of catalyst bodies, and therefore increase the range of catalytic reactions that can be probed.
Until now, temperature heterogeneities at the submicrometer level are still poorly understood. By combining the temperature-dependent luminescence with confocal microscopy, for example, it should be possible to make temperature maps with spatial resolutions in the submicrometer regime.
Acknowledgments
The authors acknowledge the assistance of Gareth Whiting during the preparation of the extrudates. This work was supported by the Netherlands Center for Multiscale Catalytic Energy Conversion (MCEC), an NWO Gravitation program funded by the Ministry of Education, Culture and Science of the government of The Netherlands
Supporting Information Available
The Supporting Information is available free of charge on the ACS Publications website at DOI: 10.1021/acscatal.7b04154.
Experimental Section, a detailed description of the temperature-dependent luminescence characterization (Figure S1), an image of the setup used during these experiments (Figure S2), and the products obtained during the MTH reaction as determined with online GC (Figure S3) (PDF)
Author Contributions
§ (R.G.G., A.-E.N.) These authors contributed equally.
The authors declare no competing financial interest.
Supplementary Material
References
- Hwang S.; Smith R. Optimum Reactor Design in Methanation Processes with Nonuniform Catalysts. Chem. Eng. Commun. 2009, 196, 616–642. 10.1080/00986440802484465. [DOI] [Google Scholar]
- McLaurin E. J.; Bradshaw L. R.; Gamelin D. R. Dual-Emitting Nanoscale Temperature Sensors. Chem. Mater. 2013, 25, 1283–1292. 10.1021/cm304034s. [DOI] [Google Scholar]
- Jaque D.; Vetrone F. Luminescence Nanothermometry. Nanoscale 2012, 4, 4301–4326. 10.1039/c2nr30764b. [DOI] [PubMed] [Google Scholar]
- Rao X.; Song T.; Gao J.; Cui Y.; Yang Y.; Wu C.; Chen B.; Qian G. A highly Sensitive Mixed Lanthanide Metal-Organic Framework Self-Calibrated Luminescent Thermometer. J. Am. Chem. Soc. 2013, 135, 15559–15564. 10.1021/ja407219k. [DOI] [PubMed] [Google Scholar]
- Shen J.; Sun L.; Yan C.-H. Luminescent Rare Earth Nanomaterials for Bioprobe Applications. Dalton Trans. 2008, 9226, 5687–5697. 10.1039/b805306e. [DOI] [PubMed] [Google Scholar]
- Li D.; Wang Y.; Zhang X.; Yang K.; Liu L.; Song Y. Optical Temperature Sensor through Infrared Excited Blue Upconversion Emission in Tm3+/Yb3+ Codoped Y2O3. Opt. Commun. 2012, 285, 1925–1928. 10.1016/j.optcom.2011.12.075. [DOI] [Google Scholar]
- Heyes A.; Seefeldt S.; Feist J. P. Two-Colour Phosphor Thermometry for Surface Temperature Measurement. Opt. Laser Technol. 2006, 38, 257–265. 10.1016/j.optlastec.2005.06.012. [DOI] [Google Scholar]
- Vetrone F.; Naccache R.; Zamarrón A.; Juarranz de la Fuente A.; Sanz-Rodríguez F.; Martinez Maestro L.; Martín Rodriguez E.; Jaque D.; García Solé J.; Capobianco J. A. Temperature Sensing Using Fluorescent Nanothermometers. ACS Nano 2010, 4, 3254–3258. 10.1021/nn100244a. [DOI] [PubMed] [Google Scholar]
- Shinde S. L.; Nanda K. K. Wide-Range Temperature Sensing using Highly Sensitive Green-Luminescent ZnO and PMMA-ZnO Film as a Non-Contact Optical Probe. Angew. Chem. 2013, 125, 11535–11538. 10.1002/ange.201302449. [DOI] [PubMed] [Google Scholar]
- Kimmerle B.; Grunwaldt J. D.; Baiker A.; Glatzel P.; Boye P.; Stephan S.; Schroer C. G. Visualizing a Catalyst at Work during the Ignition of the Catalytic Partial Oxidation of Methane. J. Phys. Chem. C 2009, 113, 3037–3040. 10.1021/jp810319v. [DOI] [Google Scholar]
- Simeone M.; Salemme L.; Allouis C.; Volpicelli G. Temperature Profile in a Reverse Flow Reactor for Catalytic Partial Oxidation of Methane by Fast IR Imaging. AIChE J. 2008, 54, 2689–2698. 10.1002/aic.11565. [DOI] [Google Scholar]
- Koptyug I. V.; Khomichev A. V.; Lysova A. A.; Sagdeev R. Z. Spatially Resolved NMR Thermometry of an Operating Fixed-Bed Catalytic Reactor. J. Am. Chem. Soc. 2008, 130, 10452–10453. 10.1021/ja802075m. [DOI] [PubMed] [Google Scholar]
- Yarulina I.; Kapteijn F.; Gascon J. The Importance of Heat Effects in the Methanol to Hydrocarbons Reaction over ZSM-5: On the Role of Mesoporosity on Catalyst Performance. Catal. Sci. Technol. 2016, 6, 5320–5325. 10.1039/C6CY00654J. [DOI] [Google Scholar]
- Menyuk N.; Dwight K.; Pierce J. W. NaYF4: Yb,Er - An Efficient Upconversion Phosphor. Appl. Phys. Lett. 1972, 21, 159–161. 10.1063/1.1654325. [DOI] [Google Scholar]
- Geitenbeek R.; Prins P. T.; Albrecht W.; van Blaaderen A.; Weckhuysen B. M.; Meijerink A. NaYF4:Er3+,Yb3+/SiO2 Core/Shell Upconverting Nanocrystals for Luminescence Thermometry up to 900 K. J. Phys. Chem. C 2017, 121, 3503–3510. 10.1021/acs.jpcc.6b10279. [DOI] [PMC free article] [PubMed] [Google Scholar]
- Olsbye U.; Svelle S.; Bjorgen M.; Beato P.; Janssens T. V.W.; Joensen F.; Bordiga S.; Lillerud K. P. Conversion of Methanol to Hydrocarbons: How Zeolite Cavity and Pore Size Controls Product Selectivity. Angew. Chem., Int. Ed. 2012, 51, 5810–5831. 10.1002/anie.201103657. [DOI] [PubMed] [Google Scholar]
- Ilias S.; Bhan A. Mechanism of the Catalytic Conversion of Methanol to Hydrocarbons. ACS Catal. 2013, 3, 18–31. 10.1021/cs3006583. [DOI] [Google Scholar]
- Hemelsoet K.; Van der Mynsbrugge J.; De Wispelaere K.; Waroquier M.; Van Speybroeck V. Unraveling the Reaction Mechanisms Governing Methanol-to-Olefins Catalysis by Theory and Experiment. ChemPhysChem 2013, 14, 1526–1545. 10.1002/cphc.201201023. [DOI] [PubMed] [Google Scholar]
- Kumar P.; Thybaut J. W.; Svelle S.; Olsbye U.; Marin G. B. Single-Event Microkinetics for Methanol to Olefins on H-ZSM-5. Ind. Eng. Chem. Res. 2013, 52, 1491–1507. 10.1021/ie301542c. [DOI] [Google Scholar]
- Mores D.; Stavitski E.; Kox M. H. F.; Kornatowski J.; Olsbye U.; Weckhuysen B. M. Space- and Time-Resolved in-situ Spectroscopy on the Coke Formation in Molecular Sieves: Methanol-To-Olefin Conversion over H-ZSM-5 and H-SAPO-34. Chem. - Eur. J. 2008, 14, 11320–11327. 10.1002/chem.200801293. [DOI] [PubMed] [Google Scholar]
- Schulz H. “Coking” of Zeolites during Methanol Conversion: Basic Reactions of the MTO-, MTP- and MTG Processes. Catal. Today 2010, 154, 183–194. 10.1016/j.cattod.2010.05.012. [DOI] [Google Scholar]
- Bleken F. L.; Barbera K.; Bonino F.; Olsbye U.; Lillerud K. P.; Bordiga S.; Beato P.; Janssens T. V. W.; Svelle S. Catalyst Deactivation by Coke Formation in Microporous and Desilicated Zeolite H-ZSM-5 during the Conversion of Methanol to Hydrocarbons. J. Catal. 2013, 307, 62–73. 10.1016/j.jcat.2013.07.004. [DOI] [Google Scholar]
- Olsbye U.; Svelle S.; Lillerud K. P.; Wei Z. H.; Chen Y. Y.; Li J. F.; Wang J. G.; Fan W. B. The Formation and Degradation of Active Species during Methanol Conversion over Protonated Zeotype Catalysts. Chem. Soc. Rev. 2015, 44, 7155–7176. 10.1039/C5CS00304K. [DOI] [PubMed] [Google Scholar]
- Wang Z.; Ananias D.; Carné-Sánchez A.; Brites C. D. S.; Imaz I.; Maspoch D.; Rocha J.; Carlos L. D. Lanthanide-Organic Framework Nanothermometers Prepared by Spray-Drying. Adv. Funct. Mater. 2015, 25, 2824–2830. 10.1002/adfm.201500518. [DOI] [Google Scholar]
- Koole R.; van Schooneveld M. M.; Hilhorst J.; de Mello Donegá C.; Hart D. C. ʼt; van Blaaderen A.; Vanmaekelbergh D.; Meijerink A. On the Incorporation Mechanism of Hydrophobic Quantum Dots in Silica Spheres by a Reverse Microemulsion Method. Chem. Mater. 2008, 20, 2503–2512. 10.1021/cm703348y. [DOI] [Google Scholar]
Associated Data
This section collects any data citations, data availability statements, or supplementary materials included in this article.


