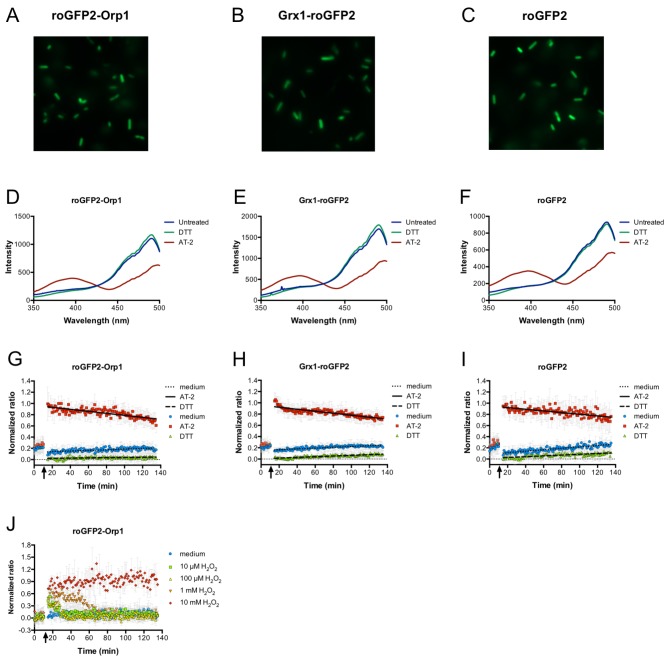
Figure 1. Expression of genetically encoded redox probes in E. coli.
Fluorescence microscopy reveals uniform expression of roGFP2-based probes (fused to Orp1 and Grx1 and unfused probe) from a plasmid in the cytoplasm of E. coli (A–C). The probes’ response to the strong thiol reductant DTT and the strong thiol oxidant AT-2 could be measured in a fluorescence spectrophotometer by monitoring the characteristic excitation spectra (D–F). A normalized ratio of the intensity of fluorescence at 405 and 488 nm excitation allowed for a time-course measurement of the probes’ oxidation in response to DTT and AT-2 treatment in a 96-well plate reader. The arrows indicate the time point of addition of the oxidant and reductant. Medium served as a control (G–I). The level of oxidation caused by hydrogen peroxide in the hydrogen peroxide-sensitive probe roGFP2-Orp1 expressed in E. coli can be followed in a plate reader. The arrow indicates the addition of hydrogen peroxide at the concentrations indicated (J).

