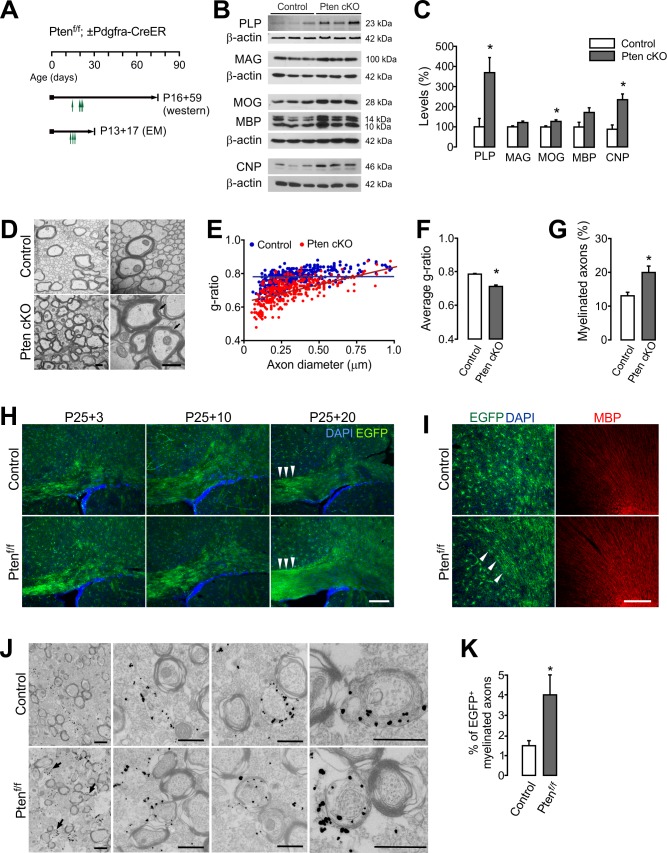
Figure 4. OPC-specific Pten ablation promotes new myelination.
(A) Experimental scheme for 4HT into Ptenf/f ± Pdgfra-CreER mice, and for mouse sampling for western blot analysis (B,C) and EM analyses (D –G). For western blot analysis, 4HT was injected into Ptenf/f (control) and Pdgfra-CreER; Ptenf/f mice at P14, P20 (twice), and P21 (1 mg per injection, a total of 4 mg), and the mice were sampled at P75. For EM, A single dose 4HT was injected at P13, 15, and 17 (a total of 3 mg), and the mice were sampled at P30. (B) Western blot analysis of cortical lysates for myelin proteins of control and OPC-targeted Pten cKO mice (P14 +61). (C) Quantification of the levels of PLP, MAG, MOG, MBP and CNP in the western blot (B). n = 3 mice per group. (D) Representative electron micrograph (EM) of the CC of the control and Pten cKO mice (P13 +17). Arrows indicate thickened myelin in Pten cKO mice. Scale bar, 500 nm. (E) Scatter plot of g-ratios. More than 100 myelinated axons per mouse were analyzed. (F) Average g-ratio. (G) Percentage of myelinated axons was increased in Pten cKO mice. More than 700 axons were analyzed for myelination per mouse. n = 3 mice per group for (D - G). (H, I) Fluorescence images of EGFP+ cells in the CC (G) and CTX (H) of Pdgfra-CreER; R26-mEGFP;±Ptenf/f mice. 4HT (1 mg per injection, two injections per day) was injected at P25 and P26 (a total of 4 mg), and the mice were killed 3, 10, or 20 days later. Arrowheads indicate increased EGFP+ slender processes, reminiscent of bundles of myelinated fibers in Pten cKO mice (P25 +20). Scale bar, 100 µm. (J) Immuno-EM of anti-EGFP immuno-gold particles in the CC of Pdgfra-CreER; R26-mEGFP; ±Ptenf/f mice (P20 +21). Arrows indicate EGFP+ newly formed immature myelin sheaths. Scale bar, 500 nm. (K) Percentage of EGFP+ myelinated axons increased at P20 +21. n = 3 mice per group. Data are represented as mean ±S.E.M. *p<0.05. Unpaired Student's t-test. The numerical data for the graphs are available in Figure 4—source data 1. Original western images are available in Figure 4—source data 2.

