

Supplemental Digital Content is available in the text
Keywords: cardiac output, comparison measurement, methodology
Abstract
The Bland–Altman (BA) and percentage error (PE) methods have been previously described to assess the agreement between 2 methods of medical or laboratory measurements. This type of approach raises several problems: the BA methodology constitutes a subjective approach to interchangeability, whereas the PE approach does not take into account the distribution of values over a range. We describe a new methodology that defines an interchangeability rate between 2 methods of measurement and cutoff values that determine the range of interchangeable values. We used a simulated data and a previously published data set to demonstrate the concept of the method. The interchangeability rate of 5 different cardiac output (CO) pulse contour techniques (Wesseling method, LiDCO, PiCCO, Hemac method, and Modelflow) was calculated, in comparison with the reference pulmonary artery thermodilution CO using our new method. In our example, Modelflow with a good interchangeability rate of 93% and a cutoff value of 4.8 L min−1, was found to be interchangeable with the thermodilution method for >95% of measurements. Modelflow had a higher interchangeability rate compared to Hemac (93% vs 86%; P = .022) or other monitors (Wesseling cZ = 76%, LiDCO = 73%, and PiCCO = 62%; P < .0001). Simulated data and reanalysis of a data set comparing 5 CO monitors against thermodilution CO showed that, depending on the repeatability of the reference method, the interchangeability rate combined with a cutoff value could be used to define the range of values over which interchangeability remains acceptable.
1. Introduction
Before purchasing and using a new device, clinicians need to know the degree of interchangeability in order to determine whether the new device can be interchanged with the gold standard and to specify the measurement range over which a new device can be applied. Over the last 30 years, >28,000 studies have used Bland–Altman (BA) methodology[1] to compare the values of physiological or laboratory parameters measured by 2 different methods. Unfortunately, the BA methodology is unable to answer these 2 questions, as interchangeability is not evaluated and is left to the discretion of the person interpreting the data. Critchley proposed a percentage error (PE) in the context of cardiac output (CO) monitoring,[2] but the PE approach does not take into account the distribution of interchangeable pairs of measurements over a range.
A recent meta-analysis showed that completely noninvasive technologies did not reach an acceptable level of agreement and were not interchangeable in terms of the PE.[3] The authors claimed that non-normal distributed biases were potentially present and could alter the results. However, no solution was provided to improve the method used to compare 2 methods of measurement.
In this work, we describe the limitations of previous methods and demonstrate the advantages of a new, simple method using the repeatability of the reference method (RM) to objectively calculate the interchangeability rate between 2 methods of measurement. We used a simulated data set to demonstrate the accuracy of our methodology to define interchangeability rate and to define the range of values over which measurements are interchangeable. Clinical utility was demonstrated for CO measurements because CO measurement during the perioperative period may decrease both morbidity and length of hospital stay and has been recommended in high-risk surgical patients.[4–7] Assessing quality of measurement should be the first step of evaluation of a CO monitor.[8] CO measurement with pulse contour analysis is a widely used, continuous, minimally invasive, operator-independent, and cost-effective technique, which could be helpful to assess changes in CO.[9] Therefore, CO values obtained by 5 arterial pulse contour techniques (Wesseling method, LiDCO, PiCCO, Hemac method, and Modelflow) were compared to the reference bolus thermodilution technique (previously published data set[10]). In this study, we assessed the interchangeability rate and, if possible, the range of CO measurements over which devices can be interchangeable with cold bolus thermodilution.
2. Methods
We developed this new method to answer limitations of previous methods and to know the degree of interchangeability in order to determine whether a new device can replace the gold standard and to specify the measurement range over which a new device can be applied.
The primary endpoint was to define the concept of the method that was described in the first part of the method section. Then, we describe how was tested the application of the new method by using 2 data sets. A simulated data set was used to demonstrate the accuracy of our methodology to define interchangeability rate and to define the range of values over which measurements are interchangeable. Clinical utility was demonstrated by assessing interchangeability rate of CO values obtained by 5 arterial pulse contour techniques (Wesseling method, LiDCO, PiCCO, Hemac method, and Modelflow) compared to the reference bolus thermodilution technique (previously published data set[10]).
2.1. Proposed method to assess interchangeability by defining the interchangeable status of each pair of measurements
2.1.1. Limitations of previous methods used to compared 2 method of measurments
The BA plot was used to overcome the limitations of the correlation coefficient.[11–13] The BA method indicates the bias of measurement, corresponding to the mean difference between 2 measurements and the limits of agreement, expressed as bias ±1.96 × standard deviation of these differences.[1,11] However, the BA method constitutes a subjective approach to interchangeability. The PE approach has been used to determine whether or not a method of measurement is interchangeable with an RM.[2] PE corresponds to the ratio between 1.96 × standard deviation of the difference and the mean of the data set. Neither BA method nor PE approach does take into account the range and distribution of interchangeable pairs of measurements over a range. BA and PE approaches do not specify the interchangeability rate, nor the range over which a device is interchangeable with another device using a calculated cutoff.
2.1.2. Interchangeable status of each pair of measurements
Our method is not based on graphical representation but on a very simple concept: the difference between pairs of measurements should be less than that expected by the repeatability of the RM over a given range. The 2 measurements become interchangeable when the observed difference is less than or equal to the maximum acceptable difference at that given range. For each individual pair of measurements, the maximum difference is dependent on the observed values (tested method [TM] and RM) and the coefficient of repeatability of the RM (RCRM) and is calculated by the following formula[1]: 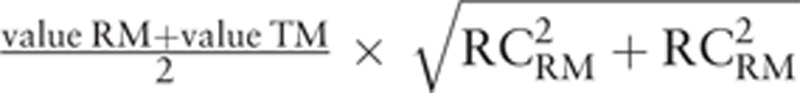 (Repeatability
 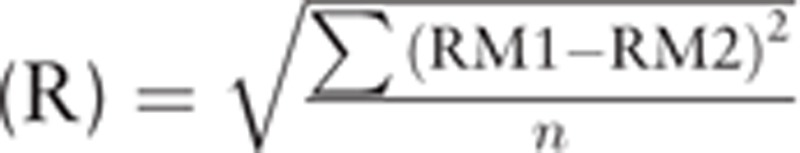 ; repeatability coefficient
 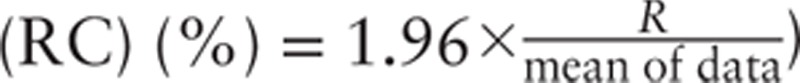 ). Each pair of measurements can therefore be easily classified as interchangeable or noninterchangeable. Interchangeability rate can be easily calculated by the ratio between number of interchangeable pair of measurements and the total number of pair of measurements. Moreover, as the status of each pair of measurements is known, cutoff values can be used to determine the range of values over which the 2 devices can be considered to be interchangeable (95% confidence interval [CI]).
2.1.3. Calculation of a cutoff to define the interchangeability range
Before determining the cutoff, the average of paired measurements was calculated and these values were sorted in ascending order. The average inclusion rate for the whole dataset was then calculated. Data points with the lowest average value were then deleted and the average inclusion rate was calculated. The process continued for as long as the inclusion rate was less than the targeted inclusion rate (95% in our case). The lowest value for which the inclusion rate was greater than or equal to 95% was defined as the interchangeability cutoff value. The median cutoff value and a percentile-based 95% CI were calculated using Jackknife methodology.[14]
2.1.4. Graphical representation
Using trigonometry, we have investigated the relationship between X/Y plot and Bland and Altman representation to see if graphical representation adds different informations. Graphical representation of interchangeability sectors was determined in both graphs.
2.2. Data sets and statistical analysis
2.2.1. Simulated data set
R Software version 3.0.3 (www.r-project.org) was used to simulate 300 data points in 3 ranges of values (2.5, 5, and 8 units). One hundred values for each of the 3 ranges were simulated using 3 multivariate normal distributions as follows:  The variance–covariance matrices were chosen so that the dispersion of values was higher for values in the ranges of 2.5 and 8 units compared to values in the range of 5 units. The R script is available in Appendix 3.
2.2.2. Original data of de Wilde comparing different CO devices with an RM
The study design has been previously published.[10] Briefly, 24 consecutive patients were included prior to cardiac surgery at Leiden University Medical Center (The Netherlands) from February 1992 to June 1996. CO measurements by 5 different arterial pulse contour techniques using an arterial catheter (Wesseling's method, LiDCO, PiCCO, Hemac method, and Modelflow), routinely performed in cardiac surgery patients, were simultaneously recorded during pulmonary artery thermodilution (bolus injection of 10 ml iced dextrose 5% solution at 4–7°C) as RM. Measurements were performed at different predefined time-points: 3 minutes after induction of anesthesia, immediately after sternotomy, after opening the pericardium, just before and just after cardiopulmonary bypass, after sternal fixation, after completion of surgery, and after drug dose changes.
After local ethics committee approval (Leiden University Medical Center ethics committee), written informed consent was obtained from all patients on the day before surgery. Inclusion criteria were coronary surgery with cardiopulmonary bypass, with no congestive heart failure or concomitant valvular heart disease. The study was conducted in accordance with the STROBE Statement.[15]
2.2.3. Statistical analysis
Inclusion rate was defined as the percentage of pair of measurements for which the absolute difference between the 2 devices was less than 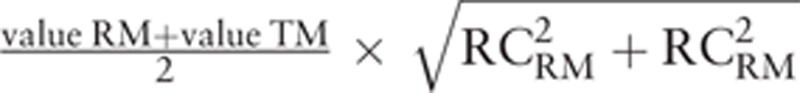 . Inclusion rate, expressed as number (percentage), was considered to be excellent (≥95%), good (≥ 90%), poor (75-90%) or not clinically relevant (<75%), depending on its value.
Interchangeability ranges were also determined by using the cutoff for which more than 95% of the points are interchangeable.
2.2.4. Interchangeability curves according to the range:
For each pair of measurements, the mean value of the 2 measurements was calculated and these values were then sorted in ascending order. Using 100 bootstrap replications and the 30 pairs of measurements with the smallest values, mean and standard error were calculated for the inclusion rate. Then, after excluding the first patient with the smallest value, the inclusion rate for the next 30 patients was then calculated. The process was continued for as long as the 30 patients with the highest value were selected. Finally, the inclusion rate was plotted as a function of the range with a 95% CI.
Global percentages of interchangeability were compared using large sample normal theory. A 2-sided P-value <.05 was considered for statistical significance.
Statistical analyses were performed using Excel version 14.4.8 (Microsoft Corporation, Redmond, WA), and R software version 3.0.3 (www.r-project.org).
To facilitate the use of our method we provide all data, methods, formulae and R scripts that are available in Appendices 1 2, and 3. Researchers can easily copy and paste their own values (reference and TM), put the RC in a specified excel box and collect the interchangeable status of every pair of measurement.
3. Results
3.1. Relationship between BA and X/Y graphical representations and angular sectors of interchangeability
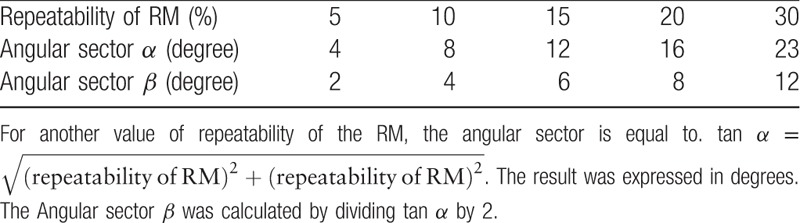
By investigating our new method, we found that BA and X/Y graphical representations are trigonometrically related and both representations provide the same type of information. Using the repeatability of the RM, an angular sector of interchangeability can be calculated for both the BA representation (Fig. 1A) and the X/Y plot (Fig. 1B). Table 1 depicts the radial sectors α and β of interchangeability according to the repeatability of the RM.
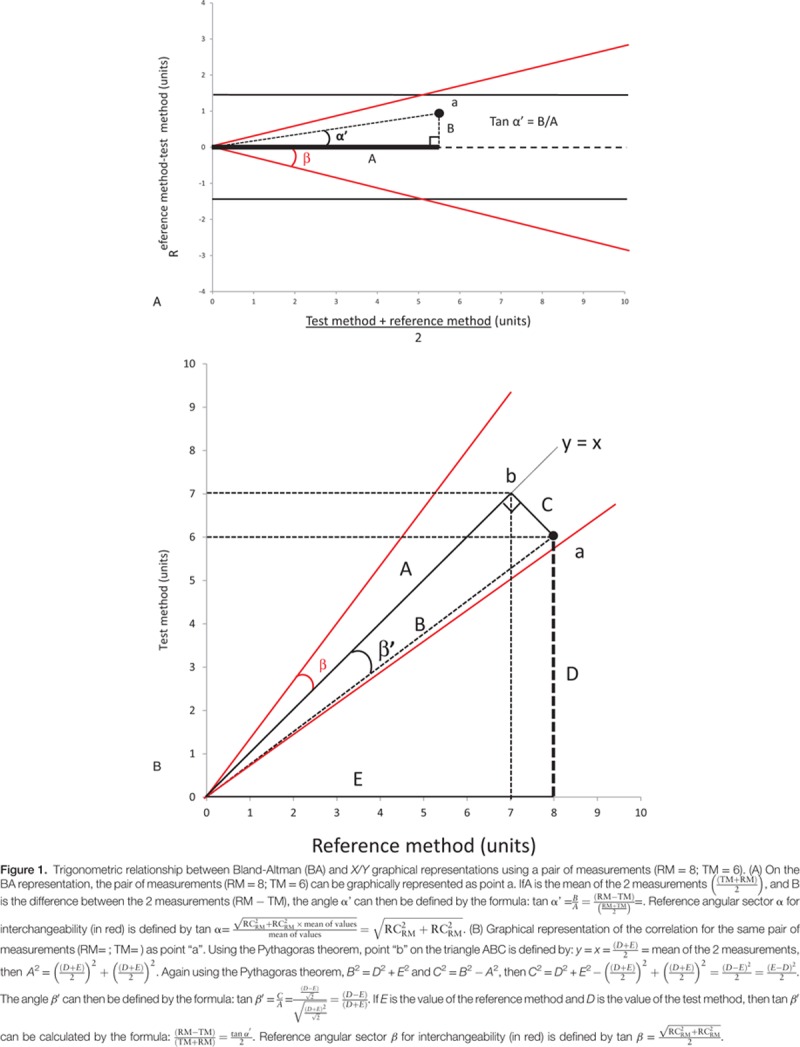
Table 1.
Relationships between the repeatability of the reference method and the corresponding reference radial sectors α and β for interchangeability.
3.2. Simulated data
After exclusion of 3 data points corresponding to negative values of the averaged measurement, the 297 simulated data points are presented in Figure 2A, showing bias and limits of agreement according to the BA method (grey lines). A wide distribution of the variable was observed, ranging from 0.42 to 10.66 units; the mean value of both methods was 5.23 units, and the bias and limits of agreement were 0.02 units and ±1.70 units, respectively. The PE was 32%, indicating the absence of interchangeability according to Critchley when the coefficient of repeatability of the RM was 20%.[2,16] Using the same coefficient of repeatability and after correcting the differences with the bias, our method classified each pair of measurements as interchangeable (green) or non-interchangeable (red) (Fig. 2A). However, our method showed that some data points could lie within the theoretical limits of interchangeability at the low range (or high range) when they were excluded from (or included in) the angular sector of interchangeability (Fig. 2A). Figure 2B,C depict interchangeability using a X/Y plot or a range-based interchangeability rate. The level of interchangeability between the 2 methods was identical between the various graphical representations for these simulated data points. This method provides interesting new information: the interchangeability rate was 87% with a cutoff value of 5.42 ± 2.67 units, defining a 95% interchangeability rate between the 2 methods above this value. All data and calculations are available in Appendix 2, .
Figure 2.
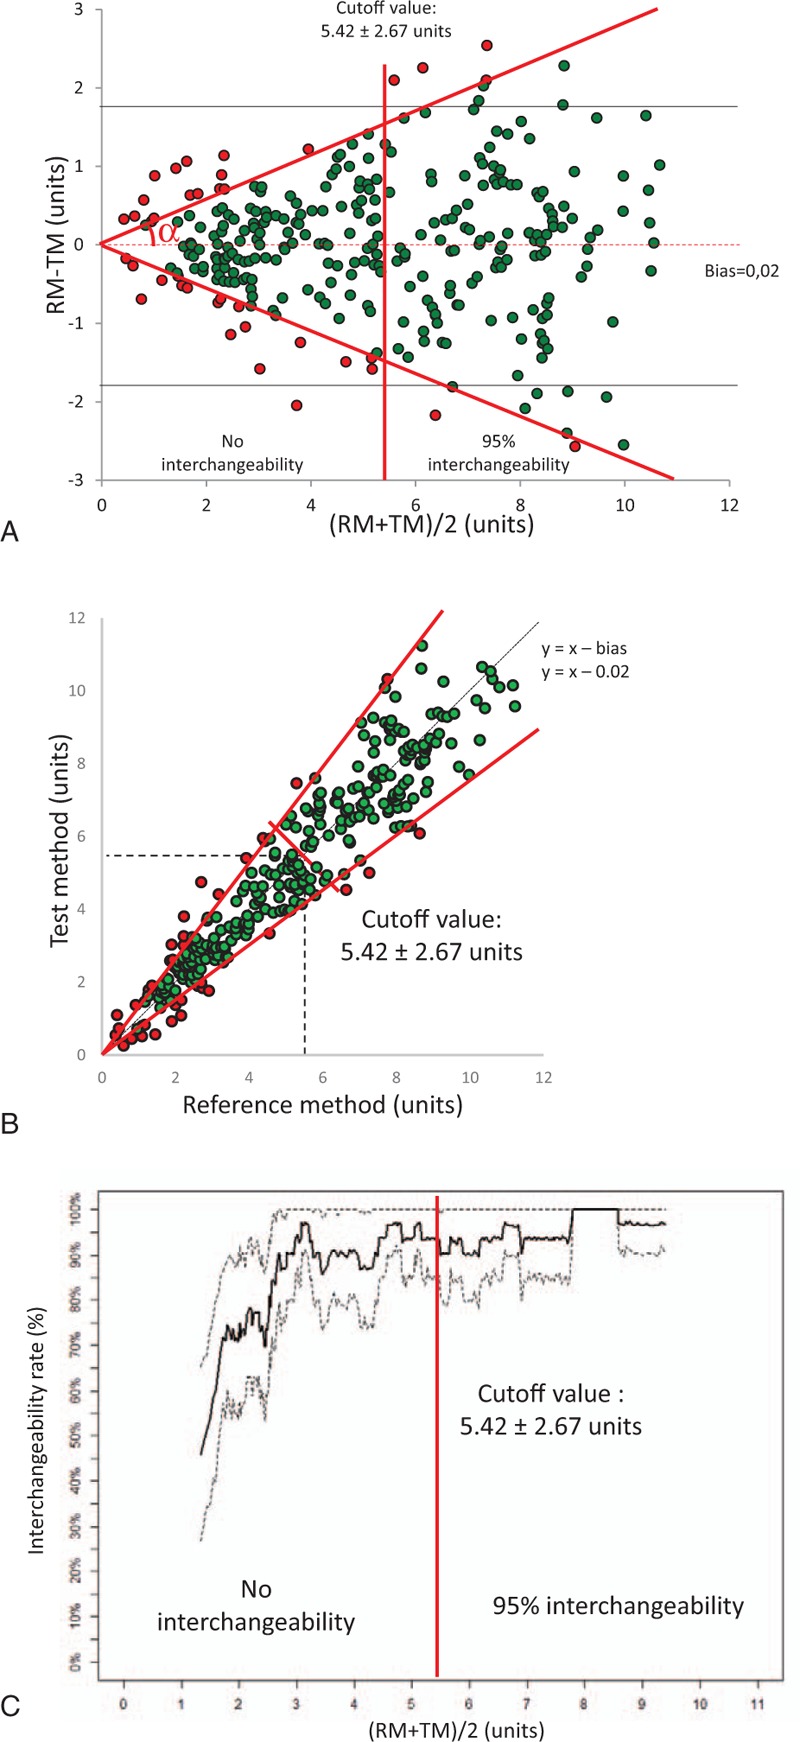
Graphical representations of range-based interchangeability rate between 2 methods of measurements for an RM with a coefficient of repeatability of 20% (Simulated data). (A) Bland–Altman (BA) graphical representation. The limits of agreements (1.70 units)(dark lines) and the bias (0.02 units) (red dashed line) are completed with an angular sector α of interchangeability (tan α =  ) (red line) and the cutoff of interchangeability (using the calculated cutoff value = 5.42 ± 2.67 units). Interchangeable points and non-interchangeable points are depicted in green or red, respectively (N = 297 simulated data points). (B) Correlation graphical representation. The line of equality minus the bias (dark line) is completed by the angular sector β (red line) and the line of interchangeability and by the cutoff of interchangeability (red line [using the calculated cutoff value = 5.42 ± 2.67 units]). (C) Ranged based interchangeability rate according to the range. The cutoff of the interchangeability line is shown in red (using the calculated cutoff value = 5.42 ± 2.67 units).
3.3. Reanalysis of the original data from Robert B.P. de Wilde
Original data based on comparison of CO measurements provided by 5 different devices and Swan Ganz catheter are presented in Figure 3.[10] A total of 199 hemodynamic time points were recorded. The repeatability of the RM was 10% with 3 cold thermodilution boli, as previously described.[16] A cutoff value of 3.8±0.7 L min−1 can be determined for Modelflow. As shown in Figure 4, Modelflow shows good interchangeability, while the other pulse contour devices have a poor interchangeability (Hemac or Wesseling's cZ) or are not clinically relevant (LiDCO or PiCCO). Modelflow has a higher interchangeability rate than Hemac (∗P = .022) and the other devices (∗∗∗P < .0001) (Fig. 4). All data and calculations are available in Appendix 3.
Figure 3.
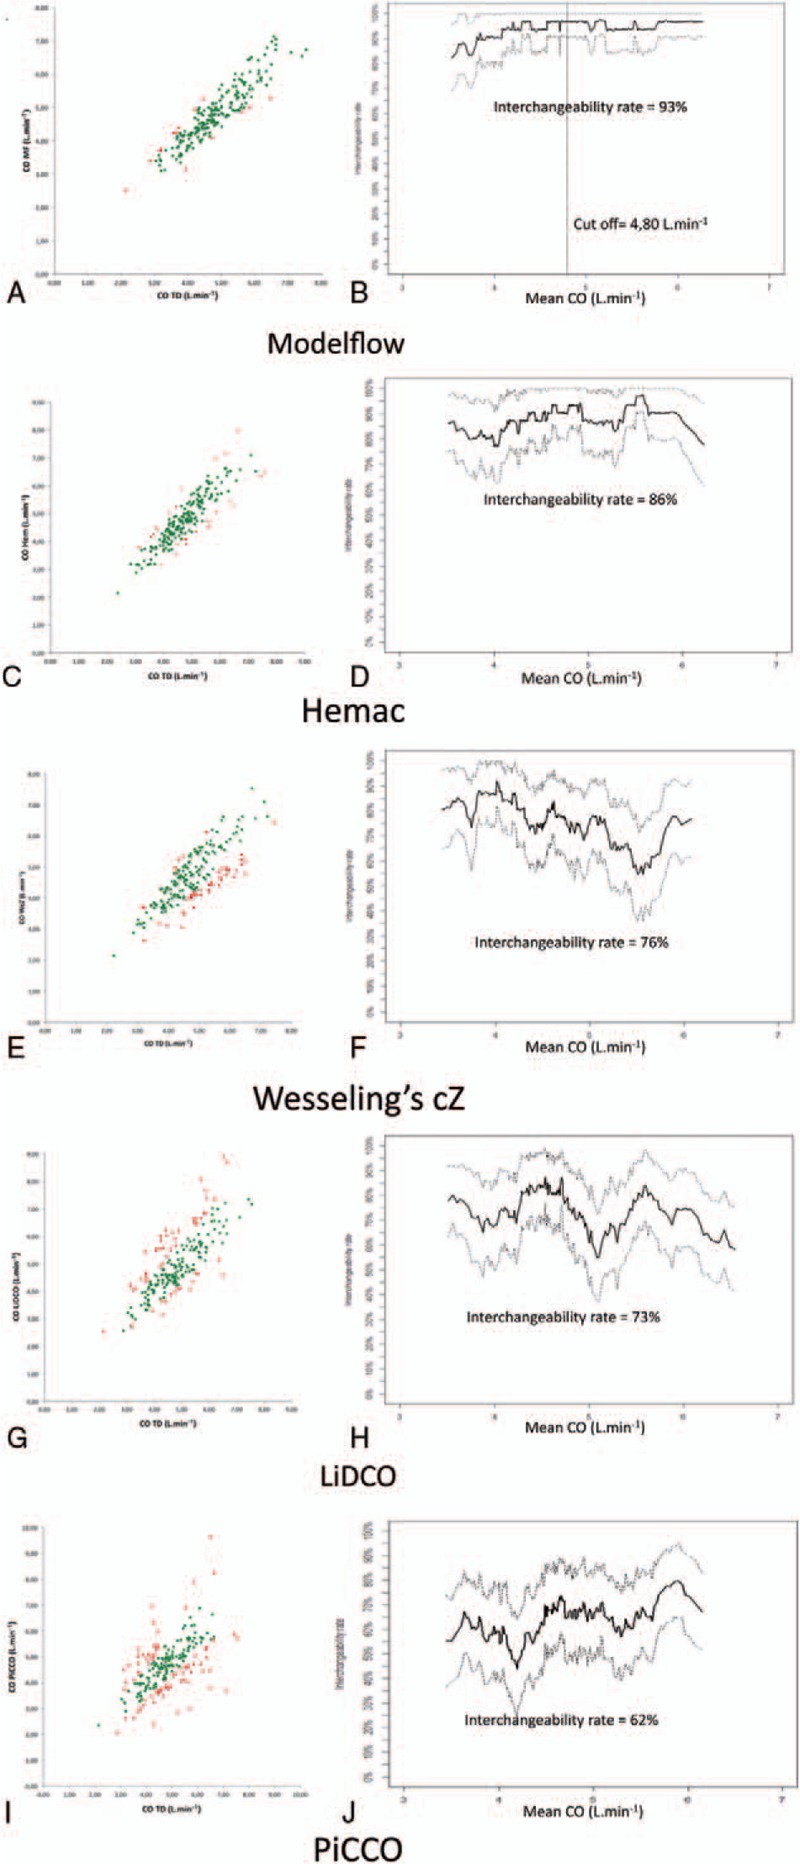
X/Y plot and interchangeability rate over the range for Modelflow (A and B), Hemac (C and D), Wesseling cZ (E and F), LiDCO (G and H) and PiCCO (I and J), respectively. Interchangeable pairs of measurements are shown in green and non-interchangeable pairs of measurements are shown in red. (n = 199 measurement for each monitor).
Figure 4.
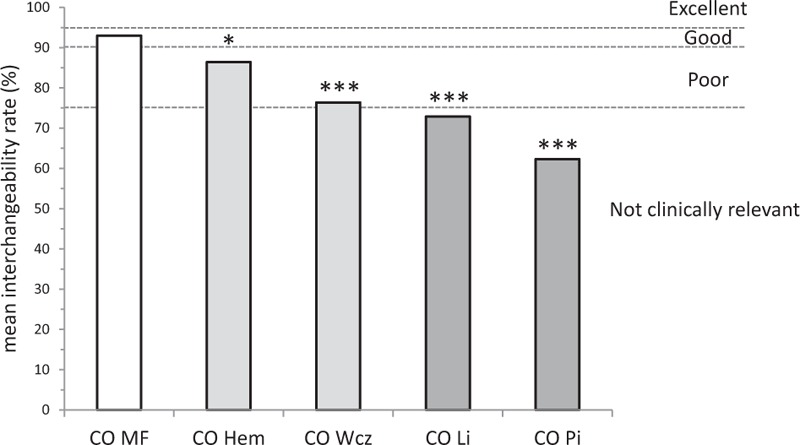
Comparison between interchangeability rate of the 5 pulse contour monitors. Modelflow had the highest interchangeability rate compared to Hemac (∗P = .022) and other devices (∗∗∗P < .0001). Dotted lines show the limits for excellent (≥95%), good (≥90%), poor (75-90%), or not clinically relevant (<75%) interchangeability rates.
4. Discussion
The interchangeability method is based on 3 simple steps: interchangeability status of each pair of measurements according to the repeatability of measurements of the RM (or inclusion in the angular sector of interchangeability); interchangeability rate, and a calculated cutoff value for interchangeability if overall interchangeability is not reached. Using this new methodology, among the 5 pulse contour devices tested in the cardiac surgery setting, only Modelflow was interchangeable with thermodilution, with a calculated cutoff value.
The original BA method,[1] subsequently completed by the PE formula,[2] are not sufficient to define interchangeability according to the range of values. This limitation has been highlighted in previous studies, but no solution has been provided.[17] Columb proposed the agreement tolerability interval ratio, which partially decreases the interpretation bias.[18] However, the tolerability interval is defined subjectively and does not take the ranges of values into account. Others have proposed to calculate each bias and limits of agreement by different level of range to see the impact on the range of the data set.[19,20] These studies show that bias and limits of agreement could be different over the range. But “slices of range” were defined subjectively and whether or not the limits of agreement are acceptable remains a matter of opinion. The PE[2] could present the same limitation and must be interpreted cautiously according to the range of measurements. One study has recently emphasized that the PE may vary as a function of variations in CO range.[21] The new method proposed here overcomes these limitations. Our method has the advantage to be distribution-free unlike Bland & Altman's or PE method, which assume a normal distribution for the differences between the test and RM. Knowledge of the interchangeability status of each pair of measurement simplifies the determination of a cutoff ensuring interchangeability for a more limited range. This complementary statistical analysis could be added to recent guidelines for reporting reliability and agreement studies.[22]
The major advantage of the interchangeability method is that it does not depend on the correlation or mean difference between the 2 methods of measurement. As the BA and X/Y graphical representations are trigonometrically related, both representations provide the same type of information. In contrast with the previous BA approach,[1] the present study shows that the graphical relationship between RM and TM could be a simple tool to assess the interchangeability using this method. The BA plot was used to overcome the limitation of the correlation coefficient.[11] As the proposed method is based on the individual status of each pair of measurements, it is also independent of the correlation coefficient. Finally, this method can be used regardless of the type of graphical representation obtained with the same results. However, as measurement errors may be observed in all studies, and as we did not know whether the RM or the test method is accurate, it seems preferable to consider bias as the origin of the angular sector.
The clinical or laboratory tolerance could be defined a priori, and could change the cutoff value. For example, when one “less invasively device” could replace another device with good interchangeability (defined as ≥90%), the clinician may accept this low risk of error according to the better benefit/risk balance. Moreover, when a clinical situation leads to values situated outside of the interchangeability range of one device, then the clinician might need to reconsider the choice of device used to obtain the measurements. Especially, if the RM has a RC inferior to the TM, values provided by the TM that are out of the interchangeability interval could have an increase probability to be wrong values. The decision to change the device during a procedure at bedside, the CI of the cutoff value must be small to be clinically relevant. In daily practice, this method can provide information by which one device could replace another one and the range of values inside the 2 devices are interchangeable. Given that, clinicians should use the new device with caution, if values are outside the interchangeability interval. Devices with a limited range of application could be of low interest for clinician.
For researchers, the gold standard should be used as RM. Unfortunately, even in recent studies, the RM used is sometimes less accurate than the TM.[23] If a new method is proposed as RM, the first step of the method is to know the RC over a large range of values.
Certain limitations of this method must be addressed. We did not assess the linearity of repeatability according to the range. The “distribution” of repeatability may be neither normal nor linear depending on the range. If some methods of measurement have a fixed absolute repeatability rather than a relative (proportional) repeatability, RC will change according to the range of values. We chose a fixed a priori repeatability of 20% for our simulated data set and we used a repeatability of 10% for thermodilution.[16] As suggested by others, the repeatability of thermodilution could be not linear.[19,24] When the CO is high, area under the curve of temperature is small and the error of measurement is greater.[24] Given such nonlinear repeatability, figures should probably indicate the error of thermodilution with curvilinear curve and not straight lines. Further studies should consider the possibility that repeatability may change over a range and evaluate the repeatability of measurements at least for the range of the study.
Studies comparing 2 sets of measurements might consider repeating measurements for each patient. The proposed method could be adapted to repeated measurements. This new method must be validated in large-scale comparison studies.
The proposed method can be generalized to all studies comparing 2 methods of measurement whenever the repeatability of the RM is known.
In conclusion, interchangeability assessment could be a simple, objective method to compare measurements obtained by 2 methods. Our method highlighted the limited information provided by BA method and Critchley analysis. The method proposed here is able to quantify the interchangeability rate, determine a cutoff value that could be used to define the range of values over which interchangeability remains acceptable and compare interchangeability rates between different devices. The information provided by this method is not subjective and the distribution of interchangeability is known over the range of the data set.
Acknowledgments
The authors thanks Yazine Mahjoub, MD, PhD; Pierre-Grégoire Guinot, MD; and Hervé Dupont, MD, PhD, for critically reviewing our method, allowing improvement of its applicability.
Supplementary Material
Supplementary Material
Supplementary Material
Footnotes
Abbreviations: BA = Bland–Altman, CI = confidence interval, CO = cardiac output, PE = percentage error, R = repeatability, RC = repeatability coefficient, RM = reference method, TM = tested method.
The authors declare no conflict of interest.
Supplemental Digital Content is available for this article.
References
- [1].Bland JM, Altman DG. Statistical methods for assessing agreement between two methods of clinical measurement. Lancet 1986;1:307–10. [PubMed] [Google Scholar]
- [2].Critchley LA, Critchley JA. A meta-analysis of studies using bias and precision statistics to compare cardiac output measurement techniques. J Clin Monit Comput 1999;15:85–91. [DOI] [PubMed] [Google Scholar]
- [3].Joosten A, Desebbe O, Suehiro K, et al. Accuracy and precision of non-invasive cardiac output monitoring devices in perioperative medicine: a systematic review and meta-analysis†. Br J Anaesth 2017;118:298–310. [DOI] [PubMed] [Google Scholar]
- [4].Hamilton MA, Cecconi M, Rhodes A. A systematic review and meta-analysis on the use of preemptive hemodynamic intervention to improve postoperative outcomes in moderate and high-risk surgical patients. Anesth Analg 2011;112:1392–402. [DOI] [PubMed] [Google Scholar]
- [5].Soni N. British Consensus Guidelines on Intravenous Fluid Therapy for Adult Surgical Patients (GIFTASUP): Cassandra's view. Anaesthesia 2009;64:235–8. [DOI] [PubMed] [Google Scholar]
- [6].Vallet B, Blanloeil Y, Cholley B, et al. Guidelines for perioperative haemodynamic optimization. Ann Fr Anesth Reanim 2013;32:e151–8. [DOI] [PubMed] [Google Scholar]
- [7].Pearse RM, Harrison DA, MacDonald N, et al. OPTIMISE Study Group Effect of a perioperative, cardiac output-guided hemodynamic therapy algorithm on outcomes following major gastrointestinal surgery: a randomized clinical trial and systematic review. JAMA 2014;311:2181–90. [DOI] [PubMed] [Google Scholar]
- [8].Biais M, Lanchon R, Lefrant JY. Accuracy of a cardiac output monitor: is it a relevant issue without an adequate therapeutic algorithm? Anaesth Crit Care Pain Med 2016;35:243–4. [DOI] [PubMed] [Google Scholar]
- [9].Peyton PJ, Chong SW. Minimally invasive measurement of cardiac output during surgery and critical care: a meta-analysis of accuracy and precision. Anesthesiology 2010;113:1220–35. [DOI] [PubMed] [Google Scholar]
- [10].de Wilde RB, Schreuder JJ, van den Berg PC, et al. An evaluation of cardiac output by five arterial pulse contour techniques during cardiac surgery. Anaesthesia 2007;62:760–8. [DOI] [PubMed] [Google Scholar]
- [11].Bland JM, Altman DG. Measuring agreement in method comparison studies. Stat Methods Med Res 1999;8:135–60. [DOI] [PubMed] [Google Scholar]
- [12].Bland JM, Altman DG. A note on the use of the intraclass correlation coefficient in the evaluation of agreement between two methods of measurement. Comput Biol Med 1990;20:337–40. [DOI] [PubMed] [Google Scholar]
- [13].Altman DG, Bland JM. Measurement in medicine: the analysis of method comparison studies. Statistician 1983;32:307–17. [Google Scholar]
- [14].Efron B, Stein C. The Jacknife estimate of variance. Ann Statist 1981;9:586–96. [Google Scholar]
- [15].von Elm E, Altman DG, Egger M, et al. The Strengthening the Reporting of Observational Studies in Epidemiology (STROBE) statement: guidelines for reporting observational studies. Lancet 2007;370:1453–9. [DOI] [PubMed] [Google Scholar]
- [16].Jansen JR, Schreuder JJ, Settels JJ, et al. An adequate strategy for the thermodilution technique in patients during mechanical ventilation. Intensive Care Med 1990;16:422–5. [DOI] [PubMed] [Google Scholar]
- [17].Preiss D, Fisher J. A measure of confidence in Bland-Altman analysis for the interchangeability of two methods of measurement. J Clin Monit Comput 2008;22:257–9. [DOI] [PubMed] [Google Scholar]
- [18].Columb MO. Clinical measurement and assessing agreement. Curr Anesth Crit Care 2008;19:328–9. [Google Scholar]
- [19].Lefrant JY, Bruelle P, Ripart J, et al. Cardiac output measurement in critically ill patients: comparison of continuous and conventional thermodilution techniques. Can J Anaesth 1995;42:972–6. [DOI] [PubMed] [Google Scholar]
- [20].Feldman JM. Is it a bird? Is it a plane? The role of patient monitors in medical decision making. Anesth Analg 2009;108:707–10. [DOI] [PubMed] [Google Scholar]
- [21].Yang XX, Critchley LA, Rowlands DK, et al. Systematic error of cardiac output measured by bolus thermodilution with a pulmonary artery catheter compared with that measured by an aortic flow probe in a pig model. J Cardiothorac Vasc Anesth 2013;27:1133–9. [DOI] [PubMed] [Google Scholar]
- [22].Kottner J, Audige L, Brorson S, et al. Guidelines for Reporting Reliability and Agreement Studies (GRRAS) were proposed. J Clin Epidemiol 2011;64:96–106. [DOI] [PubMed] [Google Scholar]
- [23].Le Manach Y, Collins GS. Disagreement between cardiac output measurement devices: which device is the gold standard? Br J Anaesth 2016;116:451–3. [DOI] [PubMed] [Google Scholar]
- [24].Renner LE, Morton MJ, Sakuma GY. Indicator amount, temperature, and intrinsic cardiac output affect thermodilution cardiac output accuracy and reproducibility. Crit Care Med 1993;21:586–97. [DOI] [PubMed] [Google Scholar]
Associated Data
This section collects any data citations, data availability statements, or supplementary materials included in this article.