Abstract
Acoustofluidics has a strong pedigree in microscale manipulation, with particle and cell separation and patterning arising from acoustic pressure gradients. Acoustic waveguides are a promising candidate for localizing force fields in microfluidic devices, for which computational modelling is an important design tool. Meshed finite element analysis is a popular approach for this, yet its computation time increases rapidly when complex geometries are used, limiting its usefulness. Here, we present an analytical model of the acoustic pressure field in a microchannel arising from a surface acoustic wave (SAW) boundary condition that computes in milliseconds and provide the simulation code in the supplementary material. Unlike finite element analysis, the computation time of our model is independent of microchannel or waveguide shape, making it ideal for designing and optimising microscale waveguide structures. We provide experimental validation of our model with cases including near-field acoustic patterning of microparticles from a travelling SAW and two-dimensional patterning from a standing SAW and explore the design of waveguides for localised particle or cell capture.
I. INTRODUCTION
Non-contact cell manipulation in microchannels is a central component of on-chip systems for medical diagnostics1–3 and autologous cell therapies,4 inter alia. Of the current non-contact techniques available (including optical tweezers,5,6 dielectrophoresis,7–9 magnetophoresis,10,11 and hydrodynamics12–14), acoustofluidics offers a promising combination of versatility and biocompatibility. There are many examples of cell and microparticle manipulation using standing acoustic waves generated in resonating microchannels,15–20 standing21–26 and travelling27–29 surface acoustic waves (SAWs) coupled from an underlying substrate, and secondary acoustic forces generated near oscillating bubbles.30–33
A common disadvantage of these examples is the pervasiveness of the acoustic field. Collins et al. recently demonstrated one-cell-per-well 2D patterning, where red blood cells and lymphocytes were patterned in a grid within a fluidic channel;34 such ubiquitous patterning is useful in many cases, but localised acoustic fields are beneficial for single cell manipulation and arrangement of cell ensembles. Several strategies exist for localising and shaping acoustic fields, including focused,35–37 pulsed,23 and non-coherent SAWs,38 holographic39–41 and metamaterial42,43 structures, and waveguides.43,44 Whereas holographic structures seek to shape an acoustic field via phase modulation, waveguides modulate amplitude by generating regions that are either acoustically active or inactive. Furthermore, the application of acoustic holograms is limited by the dimensions of the phase-modifying elements, which set an upper limit in the useable frequency range (several MHz for 3D-printed holograms in water39). Microfabrication is not a feasible approach for holograms owing to the use of thickness variations to generate phase shifts. Planar waveguides, on the other hand, can be readily microfabricated, potentially on the underside of disposable fluidic chips,27 offering the possibility of higher spatial resolution patterns.
Designing waveguides to produce a desired acoustic field is a challenge that can be met in one of two ways: extensive experimental trial-and-error or computational modelling. Finite element method (FEM) analysis is typically used for acoustofluidic simulations;44–51 however, its computation time can range from seconds to hours depending on the complexity and computational resources available. These timescales limit the usefulness of FEM for design optimisation, which may require thousands of iterations. A rapid and mesh-free analytical model will be a valuable design tool for customised acoustic waveguides. Such tools have been developed for phase modulation,39 where a pixel grid of phase shifts is calculated at a source plane (i.e., a hologram) that produces a desired amplitude profile in a distant image plane; the field at the hologram is propagated to the image plane using the angular spectrum method.52 However, tools for designing amplitude modulation (i.e., binary waveguides) are less well developed.
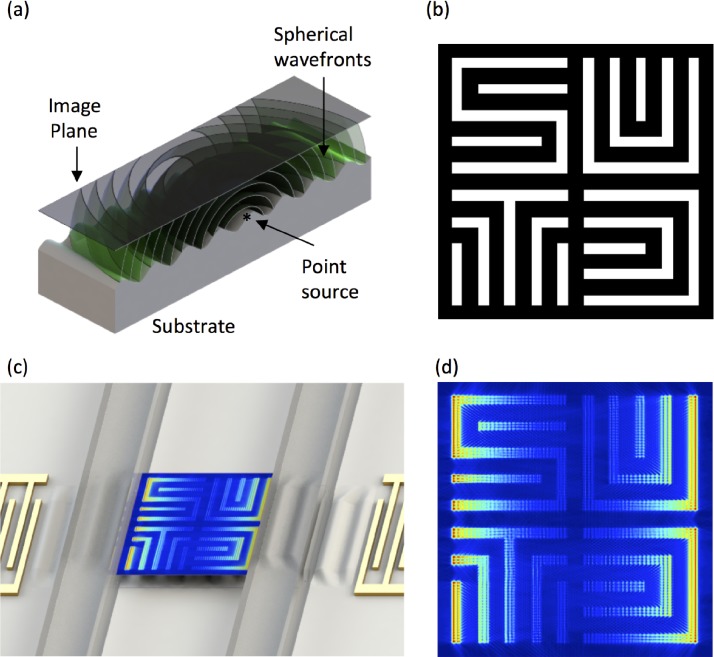
Here, we present an analytical model of a pressure field at an image plane for a given acoustic source and waveguide/channel geometries (for the full code, please see supplementary material). Our model is based on the Huygens-Fresnel principle that any point on a plane wave is a point source of spherical waves (illustrated in Fig. 1). By treating every point on the substrate/fluid interface as a point source, the pressure at any point in the liquid is the sum of spherical waves at that point. This simplistic approach avoids the use of perturbation theory,53 does not require consideration of the liquid between the source and image planes, and the lack of meshing allows us to model complex features with minimal impact on computation time. We explore this concept in detail using the specific example of near-field particle patterning by travelling SAWs54 and standing SAWs. We then explore a range of waveguide designs using our model and make comparison with recently published results.44
FIG. 1.
Conceptual illustration of (a) spherical waves generated at a point source (*) on a SAW device propagating towards an image plane. (b) An example waveguide (white regions are acoustically active). (c) An illustration of the pressure field, ⟨P⟩, in a PDMS channel arising from a standing SAW coupled through the waveguide in (b) and an enlarged image of the pressure field in (c). Both (b) and (d) measure 15 λSAW × 15 λSAW.
II. DETAILS OF THE ANALYTICAL MODEL
A. Concept of model
The pressure in a liquid channel is defined as the sum of spherical waves arising from perturbations at the liquid/substrate interface (source plane) in the XY plane, as illustrated in Fig. 1(a). The pressure is found at an image plane in XY, which can be scanned through the height of the channel (Z) to build a 3D pressure map. The source and image planes are discretised into pixel grids, where each pixel in the source plane is a point source of spherical waves. Given the ubiquitous use of polydimethylsiloxane (PDMS) microchannels with SAW devices, we assume a PDMS channel here. The comparable acoustic impedances of PDMS and water give rise to a reflected wave with only 4% of the incident amplitude,36 so reflections are ignored here in the interest of simplicity.
B. Boundary condition (BC)
We consider the surface normal component of the substrate velocity as the boundary condition (BC) for acoustic coupling into the liquid; for a standing SAW beneath a liquid channel on 128-YX lithium niobate, this has been reported previously45 and is given (in the frequency domain) by
| (1) |
where ω is the angular frequency, k is the wave number, W is the liquid channel length in X, d0 is the displacement amplitude (set to unity), and Cd = 2063 m−1 is the decay coefficient given in Ref. 45. The time parameter is omitted as the solution is found in the frequency domain, from which a time-averaged solution is calculated. The two terms in parenthesis represent forward and backward propagating travelling waves, so travelling wave boundary conditions can be applied by removing the counter-propagating term in Eq. (1). The waveguide is defined as a binary, black-and-white image (white for acoustically active regions), which is used to set the BC to zero outside of the active region.
C. Spherical wave propagation
The dimensionless spherical wave function (SWF) defines the spatial periodicity of a spherical pressure wave in a liquid and is given by
| (2) |
where is the acoustic velocity in the liquid and R is the distance from a spherical wave point source. The inverse-square relationship between the intensity and the distance means that the pressure amplitude decays linearly with R, which we replace with R + 1 to normalise the SWF to unity at the interface (where R = 0).
D. Pressure calculation
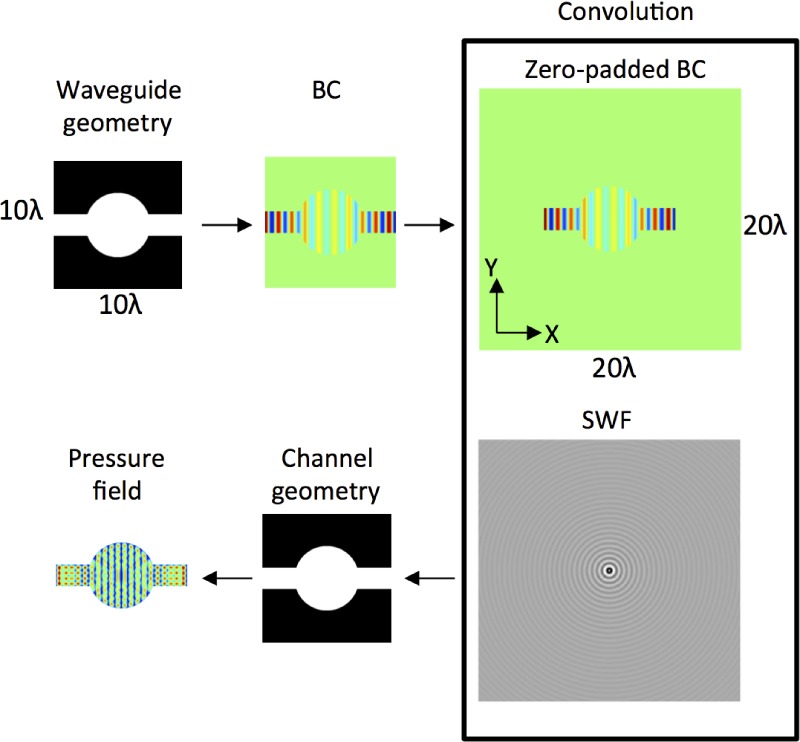
The pressure field is obtained via a convolution of Eqs. (1) and (2); in other words, the pressure at any point is the sum of all spherical waves emanating from the boundary. The simulation process is outlined in Fig. 2. First, the waveguide and channel geometries are defined as separate binary, black-and-white images; white regions correspond to acoustically active regions in the waveguide and liquid regions in the microchannel. The waveguide and channel geometries can differ, as we show later. Next, the SWF is defined, which is twice the size of the simulation domain, with R = 0 at the centre, as shown in Fig. 2. The BC is then zero-padded to the size of the SWF, and the two are convolved via multiplication in frequency space to give the pressure in the liquid regions of the microchannel, i.e.,
| (3) |
This approach is analogous to wave propagation using the angular spectrum method.52 Finally, the time-averaged pressure amplitude, ⟨P⟩, is given by
| (4) |
where is the complex conjugate of P. By calculating the pressure field in successive XY planes, we construct a 3D map of the pressure field, from which we can visualise ZX and YX slices.
FIG. 2.
Outline of the analytical model: a waveguide geometry defines the acoustic source area for the boundary condition, which is convolved with a SWF to give the pressure field, ⟨P⟩, in the region defined by the channel geometry. In this example, the boundary condition is a standing SAW in X.
III. MATERIALS AND METHODS
A. SAW device fabrication
Interdigital transducers (IDTs), composed of 150 nm aluminium (conductive) and 10 nm chromium (adhesion) layers, were patterned on a piezoelectric 128° Y-cut, X-propagating lithium niobate (LiNbO3) substrate, with the entire surface overlaid with a 400 nm SiO2 passivation layer. These IDTs, with the pitch equal to λSAW, were oriented such that the SAW propagated in the preferred (high coupling coefficient) X direction. The distance between periodic features in each IDT determines the resonant frequency and the resultant SAW wavelength. IDTs with λSAW = 80 μm and λSAW = 40 μm were used here, where a signal generator (Tektronix AFG3102C) applied the appropriate frequency for each wavelength (49 MHz and 96 MHz, respectively).
B. Microfluidic device
Channel features were defined via conventional soft-lithography in PDMS and were bonded to the SAW device after exposing both surfaces to an air plasma (Harrick Plasma PDC-32G; 1000 mTorr, 18 W). Each channel design incorporated an air chamber over the IDTs to minimize SAW attenuation, with only a 50-μm-wide PDMS wall defining the channel boundaries. Similar attenuation-minimising device setups have been demonstrated elsewhere.23,55–57
Fluorescent particles, with a diameter of either 1 μm or 2 μm, were mixed in a 0.2% v/v solution to visualize the acoustic field. Larger 2 μm particles were used to observe the weaker force gradients in the lateral (Y) direction in Fig. 5(a), as the acoustic force scales with the cube of the particle diameter when it is substantially smaller than the acoustic wavelength.28,35,58 Either zero or low flow (0.1 μl/min) conditions [Figs. 4(a) and 5(a), respectively] were used.
FIG. 5.
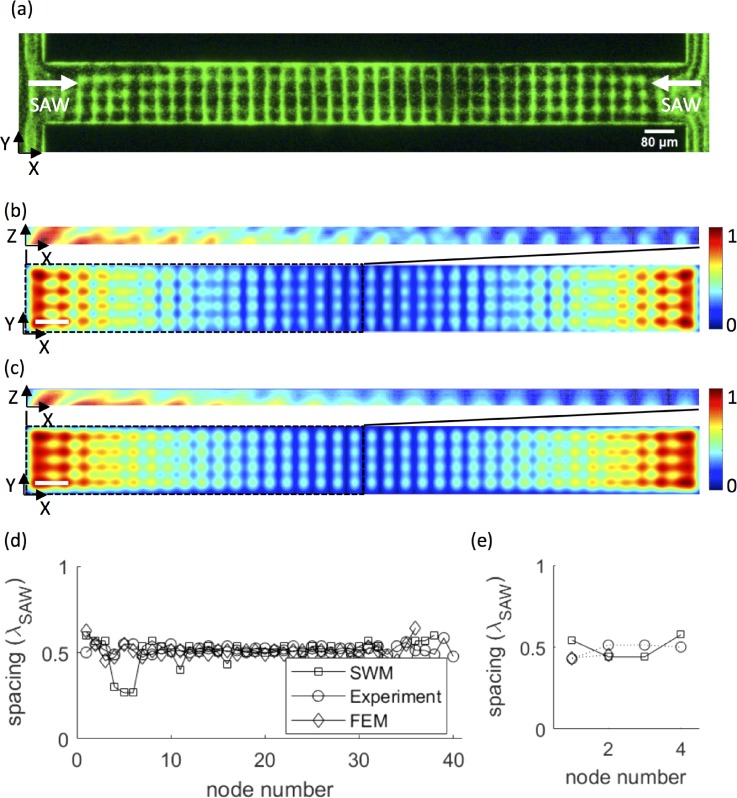
(a) Experimental image of microbead alignment in a confined microchannel (channel width = 2 λSAW) under the action of a standing SAW in X. Simulated normalised pressure fields, ⟨P⟩, are shown in the XY and XZ planes (for the left half of the channel in the XY plane) of an equivalent liquid channel (measuring 20λSAW in X, 2λSAW in Y, and 20 μm in Z; scale bars are one acoustic wavelength) obtained using (b) the spherical wave model and (c) finite element analysis. Simulation results are shown in the XY plane at a height of 15 μm above the substrate, corresponding to the height of pressure nodes in the channel. The spacings between adjacent nodes in X and Y are plotted in (d) and (e).
FIG. 4.
C. Computational modelling
The analytical modelling, Eqs. (1)–(4), was performed using MATLAB (R2017a) on a Dell Latitude laptop with an Intel Core i5 Dual Core 2.4 GHz processor and 8 GB RAM. As a benchmark comparison, FEM modelling was performed using COMSOL Multiphysics (V5.0) on a Dell Precision T1650 workstation with two Intel Xeon Quad Core 3.5 GHz processors and 32 GB RAM.
FEM analysis was used to find the pressure field in a water-filled channel for two different boundary conditions. In the first case, a travelling SAW (λSAW = 40 μm) was applied to a channel measuring 8 λSAW × 7 λSAW × 20 μm in X, Y, and Z. In the second case, a standing SAW (λSAW = 80 μm) was applied to a channel measuring 20 λSAW × 2 λSAW × 20 μm in X, Y, and Z. In both cases, a water impedance boundary condition was applied to all boundaries (except at the acoustic source) to ensure no reflections. A free tetrahedral mesh was used with six mesh elements per λSAW, following a mesh convergence study (data not shown) according to Ref. 48.
IV. RESULTS AND DISCUSSION
A. Convergence analysis
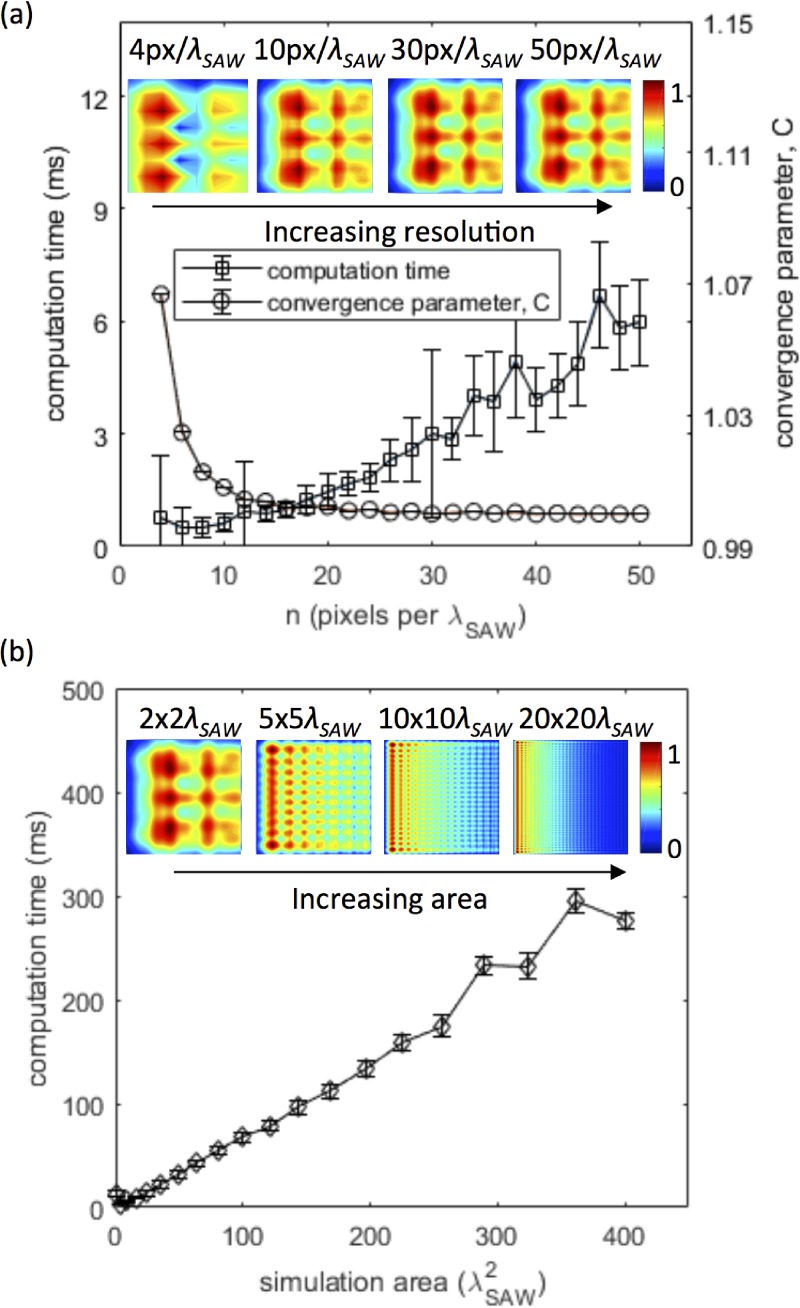
Convergence was determined using a test channel geometry measuring 2 λSAW in both X and Y subjected to a travelling SAW propagating in X. For each pixel resolution, n, a convergence parameter, C, was defined as the fractional change in pressure in the Y direction (at the first pressure node in X), relative to the highest pixel resolution (n = 50 pixels per λSAW)
| (5) |
The computation time and C are plotted in Fig. 3(a). The simulation is converged at a resolution of 30 pixels per λSAW, as a further increase in resolution yields . The effect of simulation size on computation time is plotted in Fig. 3(b); the computation time ranged from several–tens of milliseconds for channel areas from 4–100 λSAW2.
FIG. 3.
(a) Plots of computation time (squares) and convergence parameter, C, (circles) vs resolution for a 2 × 2λ simulation area; insets show the pressure field for 4, 10, 30, and 50 pixels per λ as examples. (b) Plots of computation time as a function of the simulation area at a converged resolution of 30 px per λ; insets show example normalised pressure fields, ⟨P⟩, for square simulation domains measuring 2 × 2, 5 × 5, 10 × 10, and 20 × 20λ, corresponding to areas of 4, 25, 100 and 400 λ2, respectively.
B. Experimental validation
Devendran et al. recently demonstrated stable particle patterning extending several wavelengths from the channel wall under the action of a travelling SAW.54 These patterns arose from the interaction of plane waves coupled from the SAW with spherical waves emanating from the channel wall. We use this near-field acoustic patterning as an exemplar to show that our analytical model can accurately predict the observed particle patterns faster than equivalent FEM analysis.
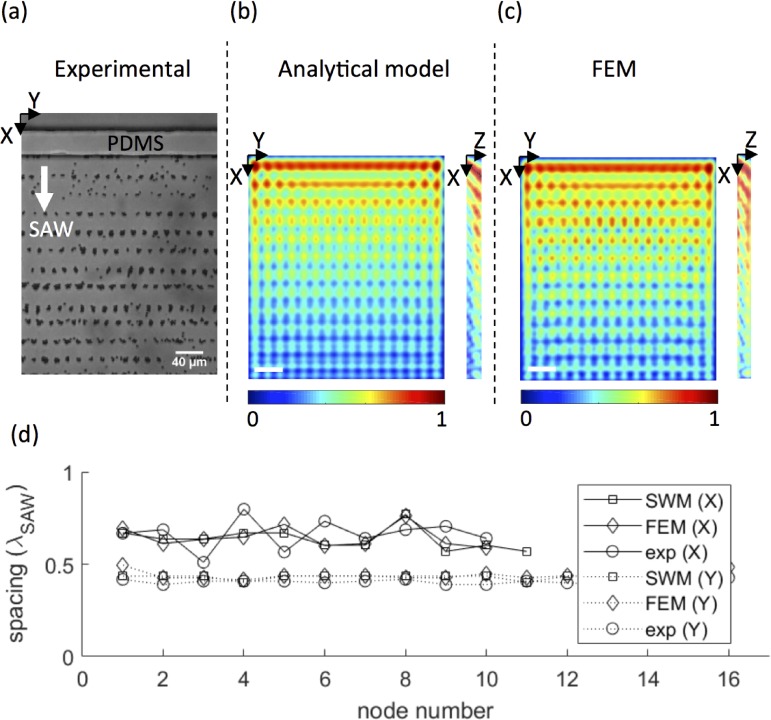
A bright-field micrograph of 2-μm-diameter beads aligned adjacent to a PDMS wall using a travelling SAW (λSAW = 40 μm) is shown in Fig. 4(a) (Multimedia view). This SAW wavelength corresponds to a fluid wavelength λf = 15.3 μm. Under SAW excitation, particles form lines parallel to the channel wall, which further coalesce laterally into clusters to form a two-dimensional pattern with no observable acoustic streaming effects (Video 1 in the supplementary material); this lateral periodicity is a result of the Huygens-Fresnel principle applied to a finite transducer aperture. The clusters in adjacent lines are not aligned because of the varying flow profile across the channel, and a non-uniform particle distribution prior to alignment resulted in smaller particle clusters close to the channel wall. The periodicities in the X and Y directions were obtained from Fig. 4(a) using Image J and are given in Table I. An equivalent channel geometry measuring 360 μm (8 λSAW) × 280 μm (7 λSAW) × 20 μm in X, Y, and Z was simulated using our analytical model and finite element analysis, for which pressure fields are plotted in the XY and XZ planes in Figs. 4(b) and 4(c). The pressures in the XY planes were evaluated 5 μm above the substrate, coinciding with the location of pressure nodes in the XZ plane. Particles are expected to coalesce at local pressure minima, and the simulated pressure fields show excellent qualitative agreement with the observed particle patterns. The periodicities in X and Y are given in Table I for both models and are consistent with experimentally determined values. Remarkably, on the same workstation (Dell Precision T1650), our analytical model (with 30 pixels per λSAW) obtained the 2D solution 658-times faster than FEM (with 6 elements per λSAW) and the 3D solution 177-times faster.
TABLE I.
Periodicities in X and Y, determined from intensity profiles in Figs. 4 and 5 for travelling and standing wave boundary conditions.
| Boundary condition | Orientation | Experimental periodicity | SWM periodicity | FEM periodicity |
|---|---|---|---|---|
| Travelling wave | X | (26.5 ± 3.3) μm | (25.6 ± 2.2) μm | (26.0 ± 2.4) μm |
| (0.66 ± 0.08) λSAW | (0.64 ± 0.06) λSAW | (0.65 ± 0.06) λSAW | ||
| Y | (16.2 ± 0.4) μm | (17.2 ± 0.2) μm | (17.6 ± 0.8) μm | |
| (0.40 ± 0.01) λSAW | (0.43 ± 0.01) λSAW | (0.44 ± 0.02) λSAW | ||
| Standing wave | X | (41.6 ± 1.8) μm | (39 ± 8) μm | (40 ± 3) μm |
| (0.52 ± 0.02) λSAW | (0.5 ± 0.1) λSAW | (0.51 ± 0.04) λSAW | ||
| Y | (39 ± 3) μm | (40 ± 4) μm | (35.2 ± 0.8) μm | |
| (0.49 ± 0.04) λSAW | (0.50 ± 0.06) λSAW | (0.44 ± 0.01) λSAW |
Next, we consider the near-field effect arising from a standing SAW in X (λSAW = 80 μm) when a liquid is confined within a channel measuring 1700 μm (21.25 λSAW) in X and 160 μm (2 λSAW) in Y. The corresponding liquid wavelength is λf = 30.5 μm. Fluorescent, 1-μm-diameter beads were expelled from pressure anti-nodes to form the 2D grid shown in Fig. 5(a), for which periodicities in X and Y are given in Table I. An equivalent liquid channel measuring 1600 μm (20 λSAW) × 160 μm (2 λSAW) × 20 μm in X, Y, and Z was simulated using our analytical model and finite element analysis. The simulated pressure fields in XY and XZ are plotted in Figs. 5(b) and 5(c); the XY plane was evaluated 15 μm above the surface to give a clear view of the spatial variation is pressure, as the pressure nodes extended throughout the channel height. Periodicities in the X and Y directions are given for both models in Table I and again agree very well with the observed particle patterning. On the same workstation (Dell Precision T1650), our analytical model (with 30 pixels per λSAW) obtained the 2D solution 259-times faster than FEM (with 6 elements per λSAW) and the 3D solution 61-times faster.
C. Waveguide design
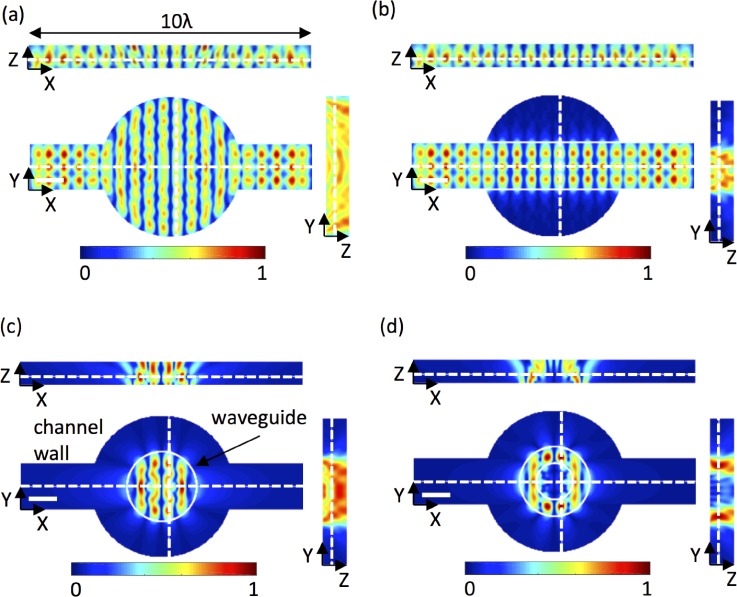
To demonstrate the versatility of our model, a moderately complex channel geometry was chosen (a cylindrical chamber in a rectangular channel) and simulated for a standing SAW in X with four different acoustic source areas: the entire channel geometry, a rectangular waveguide beneath the main rectangular channel, a 3-λSAW-diameter circular waveguide in the centre of the channel, and a torus waveguide with an outer diameter equal to 3 λSAW and an inner diameter equal to 1.5 λSAW. The increasing design complexity of these examples did not affect the computation time; the only demand of increasing complexity is a sufficient pixel size to adequately resolve the geometry. Pressure fields in the XY, YZ, and XZ planes are shown in Fig. 6.
FIG. 6.
Simulated normalised pressure fields, ⟨P⟩, in the XY, XZ, and YZ planes in a micro-reactor channel layout for a standing SAW in X, with acoustic coupling: (a) across the entire channel, (b) through a rectangular waveguide, (c) through a circular waveguide, and (d) through a torus waveguide. Solid white lines indicate the waveguide geometry, dotted white lines indicate the locations of the XY, XZ, and ZX slices, and the scale bars are one acoustic wavelength, λ = 60 μm.
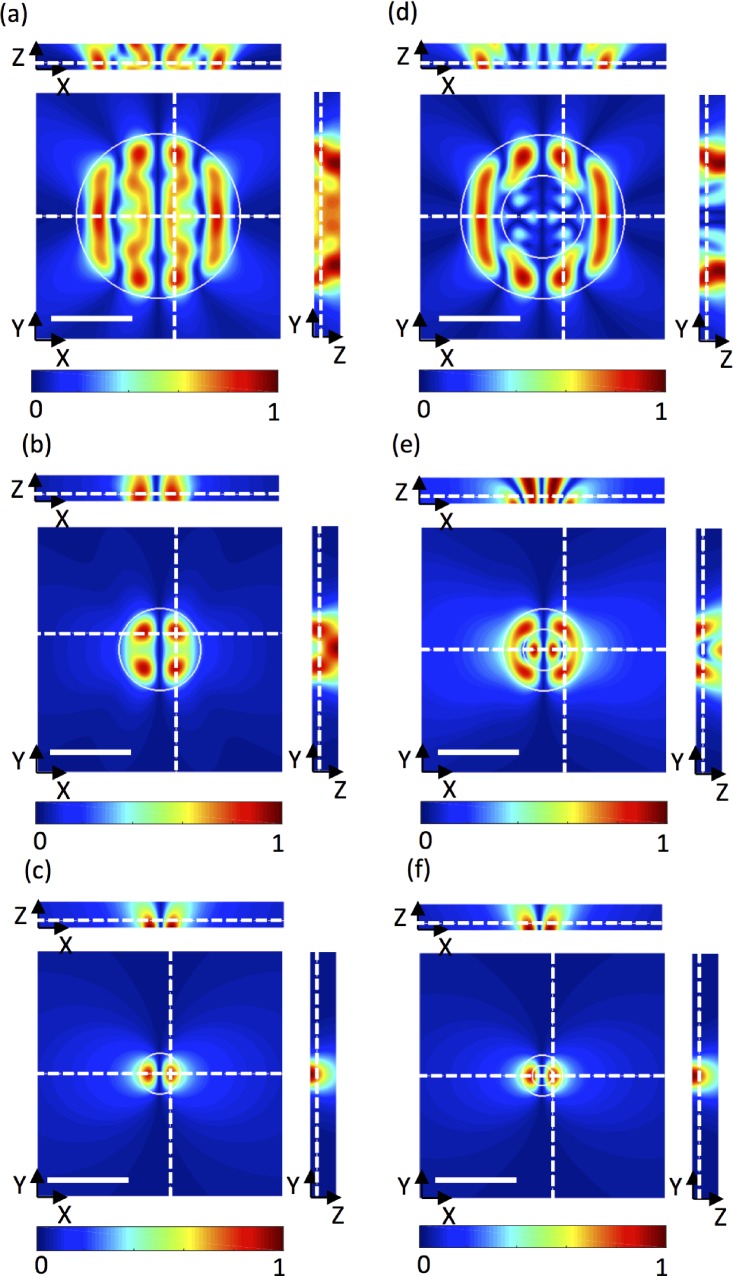
Finally, we model cylindrical waveguides with diameter ϕ and centred on a standing SAW node, with comparable conditions to experimental and FEM results reported elsewhere.44 In a physical system, these can be realized using a channel-based pillar element that couples substrate vibrations into the liquid domain.27,59,60 These waveguides are important because they permit highly localized actuation in channel sub-elements and are a promising avenue for selective cell and particle manipulation. Pressure fields in the XY, XZ, and YZ planes are given in Figs. 7(a)–7(c) for waveguide diameters, ϕ, of 0.5 λSAW, λSAW, and 2 λSAW. The locations of XY and ZX slices are indicated by dotted white lines, and the waveguides are outlined with a solid white line in the XY plane. In all cases, the periodicity of the standing SAW is evident in the resulting pressure nodes separated in X. Additionally, a lateral periodicity is evident for owing to the near field effect at the edge of the waveguide, which gives rise to increasingly complex pressure fields as the diameter increases. These results are consistent with previous FEM simulations and particle alignment experiments.44
FIG. 7.
Simulated normalised pressure fields, ⟨P⟩, in the XY, XZ, and YZ planes for a 1D (horizontal) standing SAW coupled through cylindrical waveguides with diameters of (a) 2λSAW, (b) λSAW, and (c) 0.5λSAW. The liquid channel measures 3λ in X and Y and 20 μm in Z, and scale bars are one acoustic wavelength, λ = 60 μm. A torus waveguide was used in (d-f) with an inner diameter equal to half the outer diameter. The waveguide geometry is highlighted by a solid white line, and the locations of the planes evaluated are indicated with dotted white lines.
As a final highlight of the advantage of our model, the above waveguides were replaced with hollow cylinders with an inner diameter equal to half the outer diameter, for which pressure fields are shown in Figs. 7(d)–7(f). Not surprisingly, features much smaller than λSAW have a negligible effect on the resulting pressure field; however, at larger feature sizes, small variations in waveguide geometry profoundly affect the pressure field and highlight the need for careful design of waveguides for shaping acoustic fields. Based on these results, toroidal waveguide structures, specifically those with internal diameters on the order of λSAW or larger, are promising candidates for localized microfluidic trapping and patterning activities.
V. CONCLUSION
Here, we present a rapid and meshless analytical model of the pressure field in a liquid channel based on the principle of spherical wave propagation. This model provides qualitative field analysis for arbitrary fluidic channel and waveguide geometries. Showing the versatility of this model, we recover not only the expected conventional 0.5 λSAW standing wave periodicity but also recently reported near-field evanescent patterning.35 The simulated pressure fields show excellent qualitative and quantitative agreement with near-field patterning using both travelling and standing SAWs. Furthermore, our model vastly out-performed equivalent FEM simulations, offering several orders-of-magnitude faster computation times owing, in part, to the need for more elements in the FEM model than pixels in our analytical model to obtain convergence. Importantly, choosing a sufficient Z resolution (i.e., enough XY slices to resolve field gradients in the Z direction) allows comparable 3D field visualisation to FEM approaches, and, since full phase information is retained, the time evolution of the fully developed acoustic field can be animated. Whilst we simulate a SAW as the actuation method in this work, this model can also be applied to bulk wave systems with appropriate boundary conditions.
This tool can readily model localised acoustic fields from waveguides, simply by defining the source area from which spherical waves are emitted, without negatively affecting computation time. The resulting pressure fields are consistent with recently reported FEM and experimental results of similar waveguides.44 Compared to meshed FEM simulations, our method enables the modelling of pressure field distributions in milliseconds rather than minutes or hours and without the need for complex and expensive modelling software. In the future, this will also permit the implementation of a rapid iterative design process for refined acoustofluidic manipulation.
VI. SUPPLEMENTARY MATERIAL
See supplementary material for the full MATLAB code.
ACKNOWLEDGMENTS
This work was supported by Singapore Ministry of Education Academic Research Fund Tier 2 (T2MOE1603) awarded to Y.A. We would like to thank Professor Adrian Neild and Dr. Citsabehsan Devendran from the Monash Institute of Medical Engineering at Monash University for valuable discussions on the numerical treatment of near-field acoustofluidic phenomena.
References
- 1. Jung W., Han J., Choi J. W., and Ahn C. H., “ Point-of-care testing (POCT) diagnostic systems using microfluidic lab-on-a-chip technologies,” Microelectron. Eng. 132, 46–57 (2015). 10.1016/j.mee.2014.09.024 [DOI] [Google Scholar]
- 2. Chen J., Li J., and Sun Y., “ Microfluidic approaches for cancer cell detection, characterization, and separation,” Lab Chip 12, 1753 (2012). 10.1039/c2lc21273k [DOI] [PubMed] [Google Scholar]
- 3. Zarei M., “ Advances in point-of-care technologies for molecular diagnostics,” Biosens. Bioelectron. 98, 494–506 (2017). 10.1016/j.bios.2017.07.024 [DOI] [PubMed] [Google Scholar]
- 4. Smith A. J., O'Rorke R. D., Kale A., Rimsa R., Tomlinson M. J., Kirkham J., Davies A. G., Wälti C., and Wood C. D., “ Rapid cell separation with minimal manipulation for autologous cell therapies,” Sci. Rep. 7, 41872 (2017). 10.1038/srep41872 [DOI] [PMC free article] [PubMed] [Google Scholar]
- 5. Zhang H. and Liu K.-K., “ Optical tweezers for single cells,” J. R. Soc. Interface 5, 671–690 (2008). 10.1098/rsif.2008.0052 [DOI] [PMC free article] [PubMed] [Google Scholar]
- 6. Ramser K. and Hanstorp D., “ Optical manipulation for single-cell studies,” J. Biophotonics 3, 187–206 (2010). 10.1002/jbio.200910050 [DOI] [PubMed] [Google Scholar]
- 7. Gascoyne P. R. C. and Vykoukal J., “ Particle separation by dielectrophoresis,” Electrophoresis 23, 1973–1983 (2002). [DOI] [PMC free article] [PubMed] [Google Scholar]
- 8. Morgan H., Hughes M. P., and Green N. G., “ Separation of submicron bioparticles by dielectrophoresis,” Biophys. J. 77, 516–525 (1999). 10.1016/S0006-3495(99)76908-0 [DOI] [PMC free article] [PubMed] [Google Scholar]
- 9. Gascoyne P. R. C., Noshari J., Anderson T. J., and Becker F. F., “ Isolation of rare cells from cell mixtures by dielectrophoresis,” Electrophoresis 30, 1388–1398 (2009). 10.1002/elps.200800373 [DOI] [PMC free article] [PubMed] [Google Scholar]
- 10. Liu C., Stakenborg T., Peeters S., and Lagae L., “ Cell manipulation with magnetic particles toward microfluidic cytometry,” J. Appl. Phys. 105, 102014 (2009). 10.1063/1.3116091 [DOI] [Google Scholar]
- 11. Plouffe B. D., Murthy S. K., and Lewis L. H., “ Fundamentals and application of magnetic particles in cell isolation and enrichment: A review,” Rep. Prog. Phys. 78, 16601 (2015). 10.1088/0034-4885/78/1/016601 [DOI] [PMC free article] [PubMed] [Google Scholar]
- 12. Narayanamurthy V., Nagarajan S., Khan A. Y. F., Samsuri F., and Sridhar T. M., “ Microfluidic hydrodynamic trapping for single cell analysis: Mechanisms, methods and applications,” Anal. Methods 9, 3751–3772 (2017). 10.1039/C7AY00656J [DOI] [Google Scholar]
- 13. Karimi A., Yazdi S., and Ardekani A. M., “ Hydrodynamic mechanisms of cell and particle trapping in microfluidics,” Biomicrofluidics 7, 021501 (2013). 10.1063/1.4799787 [DOI] [PMC free article] [PubMed] [Google Scholar]
- 14. Hajba L. and Guttman A., “ Circulating tumor-cell detection and capture using microfluidic devices,” Trends Anal. Chem. 59, 9–16 (2014). 10.1016/j.trac.2014.02.017 [DOI] [Google Scholar]
- 15. Leibacher I., Reichert P., and Dual J., “ Microfluidic droplet handling by bulk acoustic wave (BAW) acoustophoresis,” Lab Chip 15, 2896–2905 (2015). 10.1039/C5LC00083A [DOI] [PubMed] [Google Scholar]
- 16. Antfolk M., Magnusson C., Augustsson P., Lilja H., and Laurell T., “ Acoustofluidic, label-free separation and simultaneous concentration of rare tumor cells from white blood cells,” Anal. Chem. 87, 9322–9328 (2015). 10.1021/acs.analchem.5b02023 [DOI] [PubMed] [Google Scholar]
- 17. Karlsen J. T., Su H., Bruus H., Voldman J., and Augustsson P., “ Iso-acoustic focusing of cells for size-insensitive acousto-mechanical phenotyping,” Nat. Commun. 7, 11556 (2016) 10.1038/ncomms11556. [DOI] [PMC free article] [PubMed] [Google Scholar]
- 18. Ahmed D., Baasch T., Blondel N., Läubli N., Dual J., and Nelson B. J., “ Neutrophil-inspired propulsion in a combined acoustic and magnetic field,” Nat. Commun. 8, 770 (2017). 10.1038/s41467-017-00845-5 [DOI] [PMC free article] [PubMed] [Google Scholar]
- 19. Mishra P., Hill M., and Glynne-Jones P., “ Deformation of red blood cells using acoustic radiation forces,” Biomicrofluidics 8, 034109 (2014). 10.1063/1.4882777 [DOI] [PMC free article] [PubMed] [Google Scholar]
- 20. Christakou A. E., Ohlin M., Önfelt B., and Wiklund M., “ Ultrasonic three-dimensional on-chip cell culture for dynamic studies of tumor immune surveillance by natural killer cells,” Lab Chip 15, 3222–3231 (2015). 10.1039/C5LC00436E [DOI] [PubMed] [Google Scholar]
- 21. O'Rorke R., Wood C., Walti C., Evans S. D., Davies A. G., and Cunningham J. E., “ Acousto-microfluidics: Trapping and transporting microbubbles using surface acoustic waves,” in IEEE International Ultrasonics Symposium (2012). [Google Scholar]
- 22. Wood C. D., Cunningham J. E., O'Rorke R., Wälti C., Linfield E. H., Davies A. G., and Evans S. D., “ Formation and manipulation of two-dimensional arrays of micron-scale particles in microfluidic systems by surface acoustic waves,” Appl. Phys. Lett. 94, 054101 (2009). 10.1063/1.3076127 [DOI] [Google Scholar]
- 23. Collins D. J., Devendran C., Ma Z., Ng J. W., Neild A., and Ai Y., “ Acoustic tweezers via sub-time-of-flight regime surface acoustic waves,” Sci. Adv. 2, e1600089 (2016). 10.1126/sciadv.1600089 [DOI] [PMC free article] [PubMed] [Google Scholar]
- 24. Tian L., Martin N., Bassindale P. G., Patil A. J., Li M., Barnes A., Drinkwater B. W., and Mann S., “ Spontaneous assembly of chemically encoded two-dimensional coacervate droplet arrays by acoustic wave patterning,” Nat. Commun. 7, 13068 (2016). 10.1038/ncomms13068 [DOI] [PMC free article] [PubMed] [Google Scholar]
- 25. Bernard I., Doinikov A. A., Marmottant P., Rabaud D., Poulain C., and Thibault P., “ Controlled rotation and translation of spherical particles or living cells by surface acoustic waves,” Lab Chip 17, 2470–2480 (2017). 10.1039/C7LC00084G [DOI] [PubMed] [Google Scholar]
- 26. Collins D. J., Alan T., and Neild A., “ Particle separation using virtual deterministic lateral displacement (vDLD),” Lab Chip 14, 1595–1603 (2014). 10.1039/C3LC51367J [DOI] [PubMed] [Google Scholar]
- 27. Ma Z., Collins D. J., and Ai Y., “ Detachable acoustofluidic system for particle separation via a traveling surface acoustic wave,” Anal. Chem. 88, 5316–5323 (2016). 10.1021/acs.analchem.6b00605 [DOI] [PubMed] [Google Scholar]
- 28. Ma Z., Collins D. J., Guo J., and Ai Y., “ Mechanical properties based particle separation via traveling surface acoustic wave,” Anal. Chem. 88, 11844–11851 (2016). 10.1021/acs.analchem.6b03580 [DOI] [PubMed] [Google Scholar]
- 29. Behrens J., Langelier S., Rezk A. R., Lindner G., Yeo L. Y., and Friend J. R., “ Microscale anechoic architecture: Acoustic diffusers for ultra low power microparticle separation via traveling surface acoustic waves,” Lab Chip 15, 43–46 (2015). 10.1039/C4LC00704B [DOI] [PubMed] [Google Scholar]
- 30. Rogers P. and Neild A., “ Selective particle trapping using an oscillating microbubble,” Lab Chip 11, 3710–3715 (2011). 10.1039/c1lc20459a [DOI] [PubMed] [Google Scholar]
- 31. Xu Y., Hashmi A., Yu G., Lu X., Kwon H. J., Chen X., and Xu J., “ Microbubble array for on-chip worm processing,” Appl. Phys. Lett. 102, 023702 (2013). 10.1063/1.4788677 [DOI] [Google Scholar]
- 32. Faridi M. A., Ramachandraiah H., Iranmanesh I., Grishenkov D., Wiklund M., and Russom A., “ MicroBubble activated acoustic cell sorting,” Biomed. Microdevices 19, 23 (2017). 10.1007/s10544-017-0157-4 [DOI] [PMC free article] [PubMed] [Google Scholar]
- 33. Wang C., Jalikop S. V., and Hilgenfeldt S., “ Size-sensitive sorting of microparticles through control of flow geometry,” Appl. Phys. Lett. 99, 034101 (2011). 10.1063/1.3610940 [DOI] [Google Scholar]
- 34. Collins D. J., Morahan B., Garcia-Bustos J., Doerig C., Plebanski M., and Neild A., “ Two-dimensional single-cell patterning with one cell per well driven by surface acoustic waves,” Nat. Commun. 6, 8686 (2015). 10.1038/ncomms9686 [DOI] [PMC free article] [PubMed] [Google Scholar]
- 35. Collins D. J., Ma Z., and Ai Y., “ Highly localized acoustic streaming and size-selective submicrometer particle concentration using high frequency microscale focused acoustic fields,” Anal. Chem. 88, 5513–5522 (2016). 10.1021/acs.analchem.6b01069 [DOI] [PubMed] [Google Scholar]
- 36. Collins D. J., Neild A., and Ai Y., “ Highly focused high-frequency travelling surface acoustic waves (SAW) for rapid single-particle sorting,” Lab Chip 16, 471–479 (2016). 10.1039/C5LC01335F [DOI] [PubMed] [Google Scholar]
- 37. Riaud A., Baudoin M., Matar O. B., Becerra L., and Thomas J., “ Selective manipulation of microscopic particles with precursor swirling Rayleigh waves,” Phys. Rev. Appl. 7, 024007 (2017). 10.1103/PhysRevApplied.7.024007 [DOI] [Google Scholar]
- 38. Ng J. W., Devendran C., and Neild A., “ Acoustic tweezing of particles using decaying opposing travelling surface acoustic waves (DOTSAW),” Lab Chip 17, 3489–3497 (2017) 10.1039/C7LC00862G. [DOI] [PubMed] [Google Scholar]
- 39. Melde K., Mark A. G., Qiu T., and Fischer P., “ Holograms for acoustics,” Nature 537, 518–522 (2016). 10.1038/nature19755 [DOI] [PubMed] [Google Scholar]
- 40. Marzo A., Seah S. A., Drinkwater B. W., Sahoo D. R., Long B., and Subramanian S., “ Holographic acoustic elements for manipulation of levitated objects,” Nat. Commun. 6, 8661 (2015). 10.1038/ncomms9661 [DOI] [PMC free article] [PubMed] [Google Scholar]
- 41. Franklin A., Marzo A., Malkin R., and Drinkwater B. W., “ Three-dimensional ultrasonic trapping of micro-particles in water with a simple and compact two-element transducer,” Appl. Phys. Lett. 111, 094101 (2017). 10.1063/1.4992092 [DOI] [Google Scholar]
- 42. Memoli G., Caleap M., Asakawa M., Sahoo D. R., Drinkwater B. W., and Subramanian S., “ Metamaterial bricks and quantization of meta-surfaces,” Nat. Commun. 8, 14608 (2017). 10.1038/ncomms14608 [DOI] [PMC free article] [PubMed] [Google Scholar]
- 43. Wilson R., Reboud J., Bourquin Y., Neale S. L., Zhang Y., and Cooper J. M., “ Phononic crystal structures for acoustically driven microfluidic manipulations,” Lab Chip 11, 323–328 (2011). 10.1039/C0LC00234H [DOI] [PubMed] [Google Scholar]
- 44. Bian Y., Guo F., Yang S., Mao Z., Bachman H., Yang S., Liqiang T., Bin R., Gong J., and Guo X., “ Acoustofluidic waveguides for localized control of acoustic wavefront in microfluidics,” Microfluid. Nanofluid. 21, 132 (2017). 10.1007/s10404-017-1971-y [DOI] [PMC free article] [PubMed] [Google Scholar]
- 45. Devendran C., Albrecht T., Brenker J., Alan T., and Neild A., “ The importance of travelling wave components in standing surface acoustic wave (SSAW) systems,” Lab Chip 16, 3756–3766 (2016). 10.1039/C6LC00798H [DOI] [PubMed] [Google Scholar]
- 46. Hu H., Zhou L., Awadallah A., Xin W., and States U., “ Numerical study of acoustophoretic motion of particles in a PDMS microchannel driven by surface acoustic waves,” Lab Chip 15, 2700–2709 (2015) 10.1039/C5LC00231A. [DOI] [PMC free article] [PubMed] [Google Scholar]
- 47. Bruus H., Muller P., Barnkob R., and Jensen M., see http://static1.comsol.nl/offers/conference2012papers/papers/file/id/13794/file/bruus_abstract.pdf for “ COMSOL analysis of acoustic streaming and microparticle acoustophoresis,” in Proceedings of the 2012 COMSOL Conference, Milano (2012), pp. 2–5. [Google Scholar]
- 48. Muller P. B., Barnkob R., Jensen M. J. H., and Bruus H., “ A numerical study of microparticle acoustophoresis driven by acoustic radiation forces and streaming-induced drag forces,” Lab Chip 12, 4617 (2012). 10.1039/c2lc40612h [DOI] [PubMed] [Google Scholar]
- 49. Guo F., Mao Z., Chen Y., Xie Z., Lata J. P., Li P., Ren L., Liu J., Yang J., Dao M., Suresh S., and Huang T. J., “ Three-dimensional manipulation of single cells using surface acoustic waves,” Proc. Natl. Acad. Sci. U.S.A. 113, 1522–1527 (2016). 10.1073/pnas.1524813113 [DOI] [PMC free article] [PubMed] [Google Scholar]
- 50. Hahn P., Lamprecht A., and Dual J., “ Numerical simulation of micro-particle rotation by the acoustic viscous torque,” Lab Chip 16, 4581–4594 (2016). 10.1039/C6LC00865H [DOI] [PubMed] [Google Scholar]
- 51. Hahn P., Leibacher I., Baasch T., and Dual J., “ Numerical simulation of acoustofluidic manipulation by radiation forces and acoustic streaming for complex particles,” Lab Chip 15, 4302–4313 (2015). 10.1039/C5LC00866B [DOI] [PubMed] [Google Scholar]
- 52. Mellin S. and Nordin G., “ Limits of scalar diffraction theory and an iterative angular spectrum algorithm for finite aperture diffractive optical element design,” Opt. Express 8, 705 (2001). 10.1364/OE.8.000705 [DOI] [PubMed] [Google Scholar]
- 53. Bruus H., “ Acoustofluidics 2: Perturbation theory and ultrasound resonance modes,” Lab Chip 12, 20–28 (2012). 10.1039/C1LC20770A [DOI] [PubMed] [Google Scholar]
- 54. Devendran C., Collins D. J., Ai Y., and Neild A., “ Huygens-Fresnel acoustic interference and the development of robust time-averaged patterns from traveling surface acoustic waves,” Phys. Rev. Lett. 118, 154501 (2017). 10.1103/PhysRevLett.118.154501 [DOI] [PubMed] [Google Scholar]
- 55. Collins D. J., Khoo B. L., Ma Z., Winkler A., Weser R., Schmidt H., Han J., and Ai Y., “ Selective particle and cell capture in a continuous flow using micro-vortex acoustic streaming,” Lab Chip 17, 1769–1777 (2017). 10.1039/C7LC00215G [DOI] [PubMed] [Google Scholar]
- 56. Winkler A., Brünig R., Faust C., Weser R., and Schmidt H., “ Towards efficient surface acoustic wave (SAW)-based microfluidic actuators,” Sens. Actuators, A 247, 259–268 (2016). 10.1016/j.sna.2016.06.006 [DOI] [Google Scholar]
- 57. Destgeer G., Ha B. H., Park J., Jung J. H., Alazzam A., and Sung H. J., “ Microchannel anechoic corner for size-selective separation and medium exchange via traveling surface acoustic waves,” Anal. Chem. 87, 4627–4632 (2015). 10.1021/acs.analchem.5b00525 [DOI] [PubMed] [Google Scholar]
- 58. Laurell T., Petersson F., and Nilsson A., “ Chip integrated strategies for acoustic separation and manipulation of cells and particles,” Chem. Soc. Rev. 36, 492–506 (2007). 10.1039/B601326K [DOI] [PubMed] [Google Scholar]
- 59. Schmid L., Weitz D. A., and Franke T., “ Sorting drops and cells with acoustics: Acoustic microfluidic fluorescence-activated cell sorter,” Lab Chip 14, 3710–3718 (2014). 10.1039/C4LC00588K [DOI] [PubMed] [Google Scholar]
- 60. Franke T., Braunmüller S., Schmid L., Wixforth A., and Weitz D. A., “ Surface acoustic wave actuated cell sorting (SAWACS),” Lab Chip 10, 789 (2010). 10.1039/b915522h [DOI] [PubMed] [Google Scholar]
Associated Data
This section collects any data citations, data availability statements, or supplementary materials included in this article.
Supplementary Materials
See supplementary material for the full MATLAB code.


