

Abstract
Osteocyte processes are an order of magnitude more sensitive to mechanical loading than their cell bodies. The mechanisms underlying this remarkable mechanosensitivity are not clear, but may be related to the infrequent αVβ3 integrin sites where the osteocyte cell processes attach to canalicular walls. These sites develop dramatically elevated strains during load-induced fluid flow in the lacunar-canalicular system and were recently shown to be primary sites for osteocyte-like MLO-Y4 cell mechanotransduction. These αVβ3 integrin sites lack typical integrin transduction mechanisms. Rather, stimulation at these sites alters Ca2+ signaling, ATP release and membrane potential. In the current studies, we tested the hypothesis that in authentic osteocytes in situ, key membrane proteins implicated in osteocyte mechanotransduction are preferentially localized at or near to β3 integrin-foci. We analyzed these spatial relationships in mouse bone osteocytes using immunohistochemistry combined with Structured Illumination Super Resolution Microscopy, a method that permits structural resolution at near electron microscopy levels in tissue sections. We discovered that the purinergic channel pannexin1, the ATP-gated purinergic receptor P2X7R and the low voltage transiently opened T-type calcium channel CaV3.2-1 all reside in close proximity to β3 integrin attachment foci on osteocyte processes, suggesting a specialized mechanotransduction complex at these sites. We further confirmed this observation on isolated osteocytes in culture using STochasitc Optical Resonance Microscopy. These findings identify a possible structural basis for the unique mechanosensation and transduction capabilities of the osteocyte process.
INTRODUCTION
Bone responds to mechanical loading, or its absence, with alterations in architecture and mass [1] [2] [3] [4]. Skeletal responsiveness to physical signals depends on the ability of bone cells to detect those mechanical cues (mechanosensation) and convert them into biochemical events leading to bone formation or resorption (mechanotransduction). There is wide consensus that osteocytes are the primary cells responsible for mechanotransduction in bone [5] [6] [7] [8] [9] [10] [11] [12] [13] [14]. Precisely how osteocytes detect and transduce mechanical signals is not understood, but recent studies point to loading-induced fluid flow in the lacunar-canalicular system (LCS) and resultant forces acting on osteocytes –especially on their dendritic processes - as key elements of the mechanism [8] [9] [15] [16] [17] [18] [19] [20] [21] [22] [23] [24] [25].
That osteocyte cell processes are far more sensitive to mechanical stimuli than their cell bodies has been demonstrated experimentally [22] [26]. Wu et al. [22] in our laboratory used a novel fluid loading device to deliver picoNewton level forces to osteocyte processes versus cell bodies and found a sensitivity difference of at least ten-fold. The mechanisms underlying this remarkable mechanosensitivity are not clear, but may be related to sites where the osteocyte cell processes attach to rigid substrata. McNamara et al. [27] discovered that osteocyte processes in situ attach directly to canalicular walls at apices located 131±40 nm apart, and that these foci were αVβ3 integrin attachment sites [27]. These attachment foci – initially identified in rodents but subsequently in human bone [28] – are subject to dramatically elevated strains [20] during load-induced fluid flow in the LCS, leading us to hypothesize that they are primary sites for osteocyte mechanotransduction. Thi et al. (2013) [23] confirmed this experimentally; tiny fluid forces applied to attachment foci on osteocyte processes in vitro triggered Ca2+ signaling that propagated back to cell bodies, while the same stimulus applied away from attachment sites caused no response. Thi et al. also found that this Ca2+ response was αVβ3 integrin-dependent, since it was blocked by disrupting integrin-ligand interactions.
The αVβ3 integrin foci along osteocyte process were suggestive of focal adhesion complexes that mediate mechanical responses in numerous cell types. However, these αVβ3 integrin sites lack key features of typical integrin transduction mechanisms. Paxillin and vinculin are absent from osteocyte processes [29] (Cabahug et al., unpublished). Furthermore, You et al. [30] and Tanaka-Kamioka et al. [31] noted that the cytoplasmic space between the osteocyte process membrane and the tightly packed cross-linked actin filament bundles within (<20 nm) is insufficient to accommodate the normal array of adaptor proteins, which typically occupy >40 nm of cytoplasmic depth [28] [30] [32] [33]. Thus, it seems unlikely that typical integrin transduction mechanisms operate in osteocyte processes.
Activation of osteocyte mechanosensors alters several acute membrane-based activities including Ca2+ movements, ATP gating and membrane potential [21] [22] [23] [34] [35] [36] [37] [38]. Such responses are mediated by membrane proteins that include the stretch activated purinergic channel pannexin1 (Panx1) [35] [39], the ATP-gated purinergic receptor P2X7R [40] [23], and the low voltage transiently opened T-type calcium channel CaV3.2-1 [21] [36] [37] [41]. The gap junction protein connexin43 (Cx43), has been proposed to function as an ATP-releasing hemichannel in response to mechanical loading [26] [42], though there is no consensus on this point [43]. Yet regardless of mechanism, osteocyte mechanosensors must necessarily interact with the signal transduction “effector” machinery needed to generate cellular responses. Therefore, we tested the hypothesis that key membrane proteins implicated in osteocyte mechanotransduction are preferentially localized at or near to β3 integrin-based foci. Our approach was to analyze these spatial relationships, both in situ and in vitro, with Super Resolution Microscopy methods that permit structural resolution at near electron microscopy levels. We report here that Panx1, P2X7R and CaV3.2-1 all reside in close proximity to β3 integrin attachment foci, consistent with a specialized mechanotransduction complex. These findings suggest a structural basis for the unique mechanosensation and transduction capabilities of the osteocyte process.
MATERIALS AND METHODS
Candidate molecules
The following proteins were selected for this study: i) Integrin β3, ii) pannexin1 (Panx1), iii) P2X7R, iv) T-type calcium channel CaV3.2-1 (CaV3), v) connexin43 (Cx43) and vi) vinculin. Each protein was localized by double IHC staining with target ligand vs. combination with β3 integrin.
Microscopy approaches
Super Resolution Microscopy (SRM) was used to assess the spatial association of candidate proteins with αVβ3 integrin attachment foci. Structured Illumination Microscopy or SIM [26] uses conventional fluorophores and can be used on tissue sections. It employs imaging processing approaches to break through the Abbe resolution limit and permits x-y plane resolutions of 85-100 nm [44]. SIM was used for in situ co-localization along osteocyte processes in mouse cortical bone tissue sections. TEM [20] [27] showed that the spacing between integrin attachment sites in mouse cortical bone (150±12.4 nm) is sufficient for ligand colocalization by SRM. Direct STochastic Optical Reconstruction Microscopy (dSTORM), which provides better x-y resolution than SIM (20 nm) but cannot penetrate into tissues, was used for studies of isolated osteocytes [44] [45] [46] [47]. Details of SIM and STORM are beyond the scope of this manuscript but are described elsewhere [44] [45] [46] [47] [48].
SIM localization in situ
Under IACUC approval at the City College on New York, 18-week old adult male C57BL/6J mice (JAX, N=6) were euthanized and femurs harvested. Bones were processed and immunohistochemical (IHC) double staining carried out as described by Kennedy [49]. Briefly, bones were fixed in neutral buffered formalin for 48 hours, then decalcified with formic acid, dehydrated in ethylene glycol monoethyl ether (#E180-1, Fisher Scientific), cleared in methyl salicylate (#O3695-500, Fisher Scientific) and then embedded in an ethyl methacrylate (#234893, Sigma Aldrich) resin, which maintains good IHC staining properties and provides excellent retention of microstructure. Diaphyseal 5 μm cross-sections on glass slides were deplasticized, rehydrated and immersed sequentially in 0.3% TritonX100, 10% EDTA and protein blocking reagent (#X0909, Dako Agilent Technologies), 10 min each at room temperature, then incubated overnight at 4°C with primary antibodies against the two proteins of interest (all antibodies in this study are listed in Table 1). Primary antibody reactivity against Panx1, P2X7R, CaV3, Cx43 was validated in sections of mouse brain; reactivity for antibodies against vinculin and β3 integrin were established using fibroblasts and osteoclast sealing zones or endothelial cell focal adhesions, respectively. For IHC studies, primary antibodies were diluted with Dako Antibody Diluent (#S3022) at 1:200 and were detected with either Alexafluor488 or Alexafluor568 labeled secondary antibodies (1:700 dilution, room temperature, 30 min). Non-immune, species-appropriate IgGs served as negative controls. After staining, sections were mounted in Eukitt mounting media (EM Sciences) on precision thickness 1.5 glass coverslips (ThermoFisher).
Table 1.
Antibodies Used in Co-Localization Studies
| EXPERIMENT | TARGET | 1°ANTIBODY | VENDOR | 2°ANTIBODY | VENDOR |
|---|---|---|---|---|---|
| Pilot | β3 integrin | #ab20146 | Abcam | # A-32723 AlexaFluor488 |
ThermoFisher |
| β3 integrin vs Vinculin | β3 integrin | # ab20146 | Abcam | #A-11019 AlexaFluor568 |
ThermoFisher |
| β3 integrin vs Vinculin | Vinculin | #V9131 | Sigma | #A-11034 AlexaFluor488 |
ThermoFisher |
| β3 integrin vs Panx1,P2X7R,CaV3 | β3 integrin | # ab75872 | Abcam | #A-10042 AlexaFluor568 |
ThermoFisher |
| β3 integrin vs Panx1 | Panx1 | #SC-49695 | SantaCruz | #A-11055 AlexaFluor488 |
ThermoFisher |
| β3 integrin vs P2X7R | P2X7R | # ab93354 | Abcam | #A-11055 AlexaFluor488 |
ThermoFisher |
| β3 integrin vs CaV3 | Cav3 | # SC-16263 | SantaCruz | #A-11055 AlexaFluor488 |
ThermoFisher |
| β3 integrin vs Cx43 | Cx43 | #C6219 | Sigma | #A-11034 AlexaFluor488 |
ThermoFisher |
| Panx1 vs P2X7R, | Panx1 | #SC-49693 | SantaCruz | #A11055 AlexaFluor488 |
ThermoFisher |
| Panx1 vs CaV3 | Panx1 | #ab139715 | Abcam | #A-10042 AlexaFluor568 |
ThermoFisher |
| Panx1 vs P2X7R P2X7R vs CaV3 |
P2X7R | #ab109246 | Abcam | #A-10042 AlexaFluor568 |
ThermoFisher |
| Panx1 vs CaV3 | Cav3 | #SC-16263 | SantaCruz | #A-11055 AlexaFluor488 |
ThermoFisher |
| STORM | FLAG | F3165, mouse | Sigma | AlexaFluor488 |
SIM was performed using a Zeiss ELYRA S.1 system equipped with two laser channels; 1-2 μm z-axis image stacks were acquired in 110 nm optical steps (63× oil immersion objective, NA1.4). Both conventional, wide-field fluorescence images and SIM images were simultaneously acquired. The X-Y resolutions in SIM images were 85 nm and 100 nm for AlexaFluor488 (green) and Alexafluor568 (red) dyes, respectively, based on the contrast enhancement grid spacing for each wavelength. Images were acquired (Gain=20, Exposure=100ms) using two tracks to avoid cross-talk between channels, alternating between a red channel (laser excitation 561nm, HR DPSS 561-100 mWatts, 2%; bandpass filter (BP) detection 570-620nm) and a green channel (laser excitation 488 nm, HR Diode 488-100 mWatts, 2%; BP filter detection, 495-550 nm). Images from five rotations and five phase shifts per rotation were processed and de-convolved with Zeiss Zen Black software using raw values of 16-bit image intensities. Channel alignment calibration was performed using multi-excitation nanobeads and image stacks processed with ImageJ (Ver 1.51o,[50]) using unimodal triangulation filtering to remove noise prior to analysis [51]. Analyses were performed on the filtered 16-bit greyscale images.
For initial SIM imaging of osteocytes, mouse femoral diaphyses were stained en bloc in basic fuchsin, which fluoresces at 565 nm excitation. Bones were then embedded in resin and 75 μm thick undecalified cross-sections were cut, polished and cover-slipped for SIM. Using this approach, SIM imaging revealed both osteocytes and their LCS in exquisite detail, both in 3D Z-stack images (Fig 1A) and in single 110 nm thick optical slices like those used for the IHC co-localization studies described below (Fig 1B). A second series of pilot studies validated SIM and IHC imaging and confirmed the canalicular localization of β3 integrin staining foci [27] using an anti-β3 antibody (AlexaFluor488 labeled secondary antibody). β3 integrin foci were observed in canaliculi as well (Fig 1C,D,E). Figure 1F shows a TEM image of the proximal region of a cell process. Even with SIM microscopy, osteocyte cell processes cannot be reliably observed within canaliculi, but we can readily tell where the lacunar edge is located from the unenhanced conventional fluorescence image that the SIM microscope also generates. Thus, we can start our data collection away from that edge in order to sample the osteocyte process.
Figure 1.
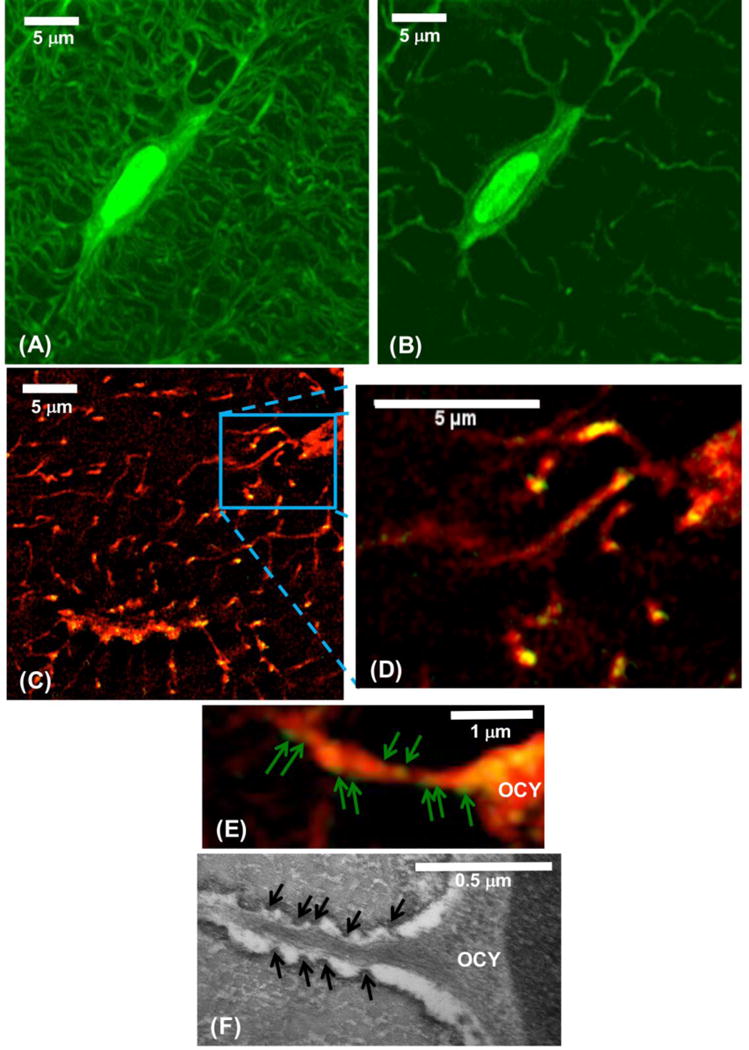
(A) SIM image showing a 3 μm thick z-stack projection of an osteocyte, its lacuna and canaliculi in mouse cortical bone (basic fuchsin fluorescence, 565 nm excitation, pseudocolored green for visualization, x-y resolution ~100 nm). (B) shows a single 110 nm thick SIM optical section from the osteocyte shown in A. This image reveals that the osteocyte is separated from the lacunar wall by an ~ 0.5 μm wide pericellular space, consistent with findings from electron microscopy studies [27] [28] [30]. Note that most of the canaliculi appear discontinuous in these very thin optical sections, as they go in and out of the plane of the section due to their tortuous course through bone. (C, D) Projection (1 μm z-stack) SIM image of bone stained for β3 integrin (Green, Alexa488) and counter-stained with basic fuchsin (Red). (E) Enlarged SIM image of single canaliculus (1 μm z-stack image) showing IHC staining of β3 integrin foci (green arrows) within; yellow/orange foci indicate where the green stained β3 integrin co-localizes with the red-fluorescing fuchsin dye. (F) TEM photomicrograph of an osteocyte showing the cell body (OCY) and the proximal region of the cell process, similar to the SIM image in E. Projections from the canalicular wall (black arrows) to the cell process are the attachment foci for the β3 integrins; these projections are not present on lacunar walls [27] [28].
SIM immunostaining and co-localization studies
Vinculin and β3 integrin localization in situ
Tissue sections were stained simultaneously for β3 integrin and vinculin, then with secondary antibodies conjugated to AlexaFluor568 and AlexaFluor488, respectively. Fibroblasts within sections served as positive controls for vinculin staining.
Co-localization of mechanotransduction components with β3 integrin on osteocyte processes in situ
IHC double-staining co-localization studies with β3 integrin and specific candidate proteins were performed using antibodies as specified in Table 1.
Image Analysis
SIM images were used for high resolution mapping of β3 integrins and candidate proteins. Analyses were performed using single optical plane images (110nm thick) to avoid distortions that occur in Z-axis reconstructions. [44] [45] [48]. IHC stained foci showed β3 integrins in red (AlexaFluor568), candidate channels in green (AlexaFluor488).
For β3 integrin - vinculin studies, vinculin staining was noted as present or absent, and if present, whether or not it co-localized with β3. For all other β3 integrin-candidate protein pairs, the presence, distribution and degree of co-localization were quantified using ImageJ particle analysis and co-localization indices modules. Fifteen osteocytes per protein pair were chosen from the anterior cortex, >20μm away from periosteal and endosteal surfaces, in 3 non-contiguous sections per animal, a total of 90 osteocytes per animal.
Data collection was performed along all osteocyte processes contained within the section optical plane in concentric elliptical sampling regions of interest spaced 0.5 μm apart and starting 0.5 μm distal to the lacunar margin (Fig 2D). Based on images from previous electron microscopy studies by our laboratory [27] and additional TEM studies (Fig 1F) performed as part of our calibration studies for SIM, the starting point for our data collection (0.5 μm from the lacunar edge) samples the osteocyte process (Fig 1E). Data collection for each process then proceeded outward to 3.5 μm, which was half the mean distance between adjacent lacunae. In each region of interest (ROI), the total area of all stained fluorescing foci was measured for each ligand and divided by the square root of total ROI area.
Figure 2.
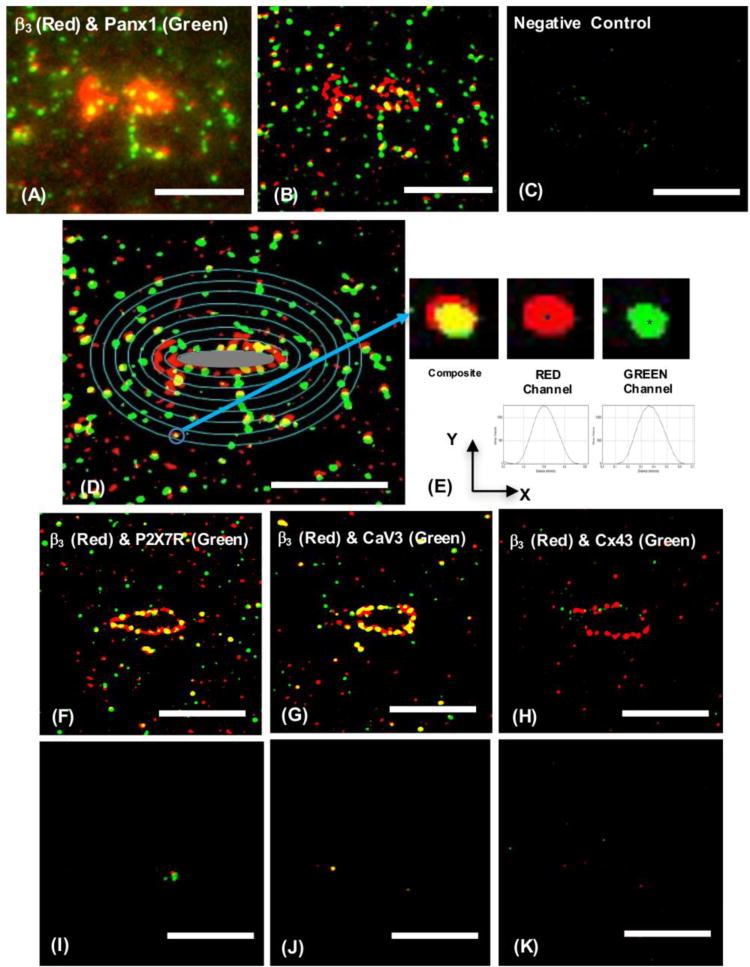
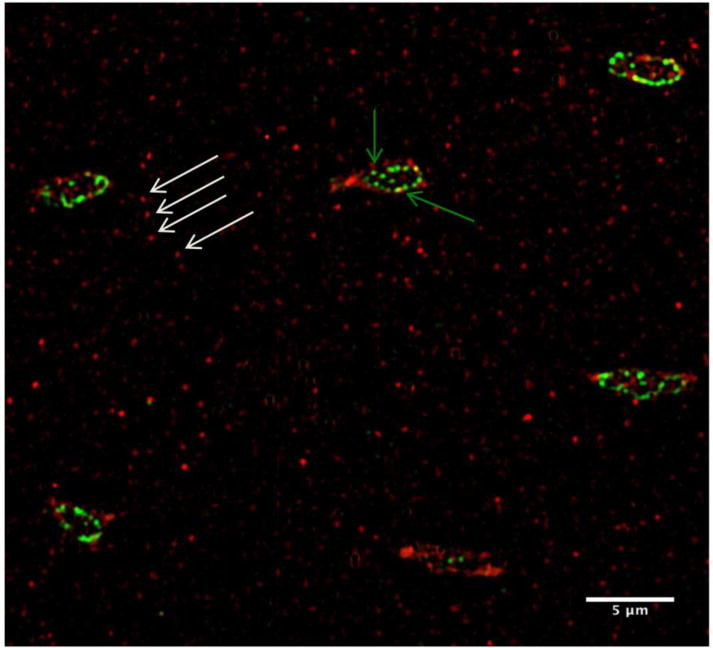
(A) Wide-field fluorescence image of osteocyte double-IHC stained to detect β3 integrin (Red, AlexaFluor568) and Panx1 (Green, AlexaFluor488), (B) Corresponding thresholded SIM image of the same cell shown in a single 110 nm thick optical section (see Fig 1 for explanation of discontinuous appearance of cell processes in these very thin optical sections); (C) Negative control with non-immune species specific IgGs. (D) is the same image as in B, shown with concentric ellipses every 0.5 μm that were used in standardized sampling of staining foci on cell processes as a function of distance from the lacunar edge; the central gray oval represents the osteocyte lacunar edge and measurements were started 0.5 μm away from the edge. Note that this image has been rotated slightly counterclockwise compared to B, in order to place the osteocyte long axis in the horizontal plane. (E) Example of a composite stain locus, magnified (blue arrow) and shown in separate Red and Green component channels. Asterisks show the X, Y-location of the maximum intensity, which were used to determine distances. (F-H) show one optical plane of thresholded SIM images of β3 integrin (Red) vs P2X7R (Green), β3 integrin (Red) vs CaV3 (Green) and β3 integrin (Red) vs Cx43 (Green), respectively, and (I-K) negative controls (non-immune species specific IgGs) corresponding to the staining pair in the image shown immediately above. Scale bar = 5 μm.
Protein distribution & co-localization
Manders Coefficients were determined to assess degree of co-localization between fluorescently labeled β3 integrin foci and all candidate proteins using the Coloc2 module in ImageJ with automatic thresholding (Costes methods). The Manders Coefficient M ranges from 0 (no overlap) to 1 (complete overlap). A threshold of M=0.4 or 40% overlap is considered to represent biologically significant co-localization [52] [53] [54] [55]. Manders Coefficients are also directional, such that for two proteins A & B, MAB reflects the fraction of A coinciding with B, while MBA, indicates the fraction of B coinciding with A.
Distances were measured between each of the 6 pairs of membrane proteins with Manders Coefficient >0.4: β3 integrin, CaV3, P2X7R and Panx1. Pairs of red and green foci, were selected, and thirty pairs per osteocyte from an average of 15 cells in each bone section (3 sections per bone) were measured. Each staining locus can be approximated using an Airy function, so an intensity centroid (Fig 2E) can be determined and the distance measured from centroid to centroid using this approach. Distances were determined using ImageJ.
Localization of osteocyte process mechanotranduction apparatus in isolated osteocytes using STORM
Direct STochastic Optical Reconstruction Microscopy (dSTORM) was used to examine co-localization of the candidate proteins on cell processes of isolated osteocytes. dSTORM provides resolution of 20 nm for cells on cover slips. In addition, dSTORM can image multiple wavelengths, allowing us to test for extremely precise co-localization among our candidate proteins. MLO-Y4 osteocytes were grown for 7 days on collagen-coated #1.5 glass coverslips (MatTek Corporation); cells were cultured in α-MEM supplemented with 5% FBS, 2.5% bovine serum and 1% Penicillin-Streptomycin. Cells were co-transfected with two plasmids: one plasmid contained the gene for mouse Panx1 with an mCherry tag (pLenti6V5-EF1a-mPanx1-mCherry) and the other contained mouse β3-integrin with a 3X-flag epitope tag on the integrin, using Optifect as per manufacturer protocol. A transfection approach to create fluorescent proteins provides higher spatial precision than antibody approaches – the constructs are much smaller which allows improved resolution in the resulting reconstructed images. Cells were washed with PBS and fixed for 20 min in 4% paraformaldehyde in PBS. Cells were then washed and blocked in 2% donkey serum and 0.4% Triton-X 100 in PBS for 30 min at room temperature. Cells were incubated with primary antibodies overnight at 4°C, then washed and incubated with secondary antibodies for 1 hour. STORM image acquisition and processing were performed as follows: Freshly prepared buffer 50mM Tris, 10% w/v Glucose, Glucose Oxidase mix (0.5mg/ml glucose oxidase, 40μg/ml Catalase) and 100mM β-Mercaptoethylamine was placed on cells to induce mCherry blinking [56]. Images were acquired using a Nikon N-STORM microscope (Nikon Instruments, Melville NY) with a 100× magnification oil objective. 2-dimensional images were acquired (100% laser power for all three excitation wavelengths- 488nm, 560nm, and 647nm) and exposure time set to 30ms. dSTORM images were processed using Nikon Elements N-STORM software with the overlapping peak recognition algorithm. Localized molecules were displayed as Gaussian spots and spot brightness and diameter determined by localization precision. In-software drift correction and correction for chromatic aberration (based on prior calibration using a fluorescent bead standard) was applied to reconstructions. We employed a density filter in order to eliminate background secondary fluorescence: only molecules localized in clusters with a molecule count of 15 within an 80 nm distance were displayed in the image shown in Figure 7. For cluster analysis, a density filter of 5 localizations within 80 nm was used. β3 integrin clusters were defined by inclusion of only the localizations that had 5 or more other localizations within 80 nm of the centroid for each localization being tested for inclusion in a cluster. After all localizations were tested for inclusion within a cluster, those that did not meet cluster criteria were removed from the list of localizations and the reconstructed dSTORM image used for further analysis.
Figure 7.
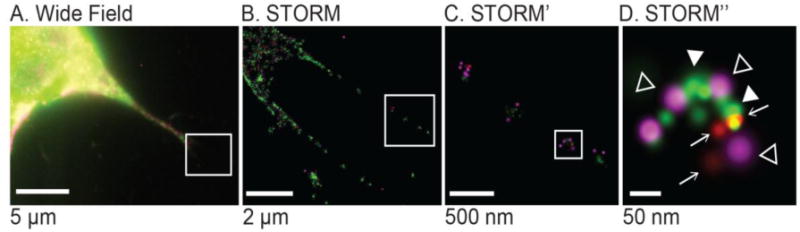
(A) Wide field image of MLOY-4 osteocyte. (B-D) STORM images. Green: β3-integrin, filled arrowheads, red: P2X7, arrows, magenta: Panx1-mCherry, open arrowheads. (Panx1-mCherry is magenta, P2X7-AF647 is red, and Integrin-Flag-AF488 is green)
Statistical analyses
Data for protein distribution and pair co-localization from SIM studies are reported as means ± standard deviation. SPSS (IBM, Ver 20) was used for analysis. Two-way ANOVA tested for differences among the membrane proteins examined along each region of the osteocyte processes and between regions for each protein. Post hoc Fisher’s least significant difference test was used to perform pairwise comparisons for each of the three candidate channels with β3 and each other, at each region along the osteocyte processes. Tukey’s test was used to determine differences between all groups. Significance is reported at p<0.05.
RESULTS
Analysis of osteocyte mechanotranduction proteins on osteocyte processes in situ by SIM
Double IHC staining for β3 integrin and vinculin (Fig 3) showed that vinculin was present in osteocyte cell bodies but absent from osteocyte processes. In contrast, β3 integrin was also present beyond the lacuna margin. There was no overlap between vinculin and β3 integrins.
Figure 3.
SIM image of osteocytes with double–IHC staining for β3 integrin (Red) and Vinculin (Green). Vinculin staining was found at osteocyte cell bodies (green arrows), but not in osteocyte processes. Only β3 integrin was found on osteocyte processes (white arrows).
Double IHC staining for β3 integrin in combination with Panx1, P2X7R and CaV3 and Cx43 revealed that all of these proteins were located along osteocyte processes (Fig 2). Distributions of β3 integrin, P2X7R, Panx1 and CaV3 along the processes were similar; highest concentrations of these ligands were near the origin of the osteocyte process, declining over the first 1.5 μm from the lacunar margin. After that point, levels for all of these proteins remained low and relatively constant along the length of the process (Fig 4). In contrast, Cx43 staining was present only at extremely low levels and was uniformly distributed along the length of osteocyte (Fig 2H).
Figure 4.
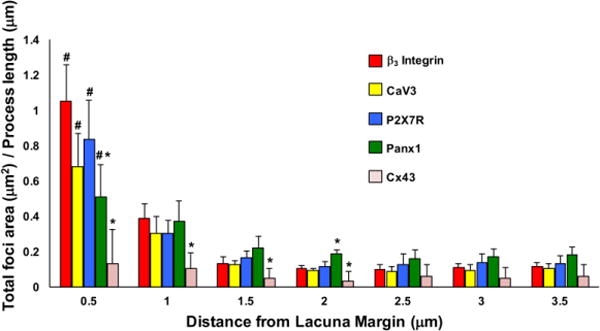
Distribution of candidate proteins along osteocyte processes plotted with respect to distance from the lacuna margin. (p<0.05 for # versus distal locations >1.5um, * versus β3 integrin)
Co-localization of candidate proteins
In the proximal regions of osteocyte process, within 1 μm from the lacunar margin, Manders Coefficients for the association of Panx1, P2X7R and CaV3 with β3 foci ranged from 0.6-0.9 (Fig 5A) showing that the majority of these molecules strongly co-localize with β3 integrin foci in this region. At greater distances from the lacunar margin, Manders coefficients declined continuously so that at distances above 2 μm from the lacunae, all M values were below the threshold level (0.4) for positive association. However, all of these proteins exhibited M values for association with β3 integrin that were greater than seen for Cx43, which invariably averaged less than 0.1, indicating that it is not part of the Panx1, P2X7R, CaV3, β3 complex.
Figure 5.
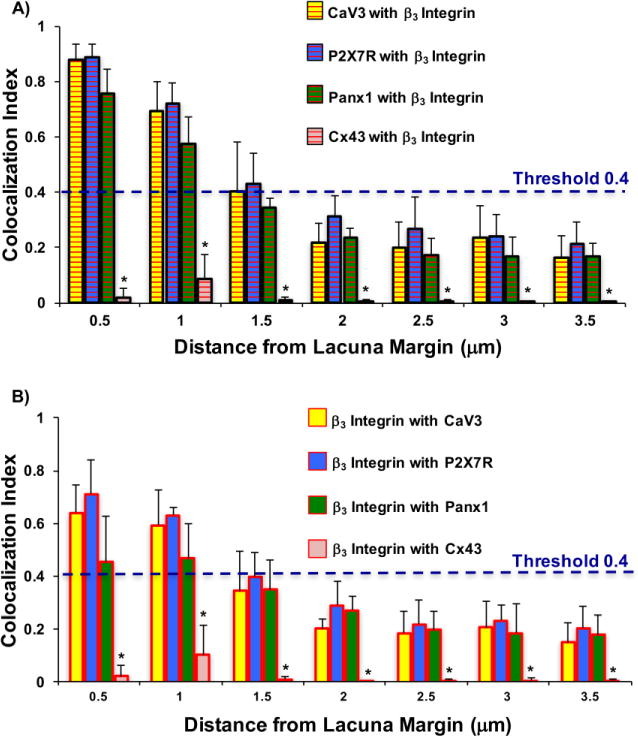
(A) Manders Coefficients for CaV3, P2X7R and Panx1 colocalizations with β3 integrin foci along osteocyte processes, plotted with respect to distance from the lacuna (p<0.05 for * vs β3 integrin with CaV3, P2X7R and Panx1 pair values) (B). Reverse Manders Coefficients for β3 integrin foci colocalizations with CaV3, P2X7R and Panx1along osteocyte processes, plotted with respect to distance from the lacunar margin. p<0.05 for * vs β3 integrin with CaV3, P2X7R and Panx1 pair values
Reverse Manders coefficients, indicating the association of β3 integrin with other proteins, showed qualitatively similar patterns, declining with distance from the lacunar margin (Fig 5B). However, the reverse coefficients in proximal regions of the processes near the cell body were lower than the forward coefficients. This finding indicates that not all β3 sites are associated with the candidate proteins. Cx43 was not spatially associated with β3 integrin sites at any location along osteocyte processes. Finally, at all regions examined, the M values between β3 integrin and Panx1, P2X7R and CaV3 were similar to each other (p>0.20), in contrast to the lack of association with Cx43 (p<0.05).
Distances between all pairwise combinations of membrane proteins examined in regions where Manders coefficients were greater than 0.4 ranged from 40-87 nm, with P2X7R and Panx1 being in closest proximity to each other (Fig 6).
Figure 6.
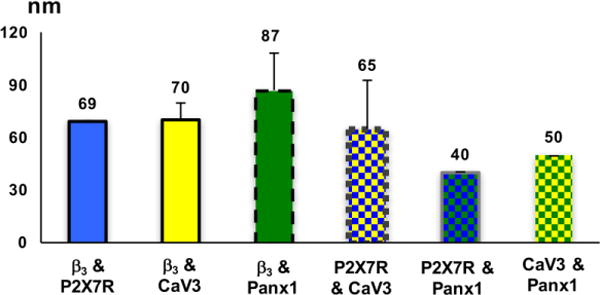
Distance between candidate membrane; data shown as mean ± SD as measure from SIM image maps.
Analysis of the osteocyte mechanotransduction proteins in MLO-Y4 cells by STORM
Spatial relationships among β3 integrin, P2X7R and Panx1 were assessed in isolated osteocytes. β3 integrin foci were readily visualized along the processes of MLO-Y4 osteocytes (Fig 7), and were punctate in distribution along the cell processes, similar to our in situ SIM findings. These larger foci were comprised of smaller staining units, consistent with the well-known clustering of β3 integrins at adhesion sites. β3 integrin foci was found to colocalize with Panx1-mCherry and endogenous P2X7Rs in multiple cell processes extending from the cells.. We characterized spacing and co-clustering of the molecules instead of Mander’s coefficient analysis because colocalization of signal in reconstructed dSTORM images is not a useful statistic due to the point-based nature of this localization microscopy. For co-cluster estimation with β3 integrin clusters, we examined 11 processes on each of seven different cells. Co-clustering was categorized as those β3 integrin clusters having one or more localization of a β3 integrin or another mechanosensor protein localization within 80 nm. The majority of β3 integrin clusters (~60%) were found within 80 nm of P2X7R and/or Panx1, and some 23% of integrin clusters had these proteins within the cluster. Some of the β3 foci were not associated with channel proteins (not shown), consistent with findings in the SIM-based Manders co-localization studies described.
DISCUSSION
In this study, SIM-based super-resolution microscopy was used to determine with high resolution, the spatial relationships between β3 integrin, a likely mechanosensory molecule, and a set of membrane channel proteins and receptors implicated in osteocyte mechanotransduction. The results revealed that the β3 integrin foci on osteocyte processes are co-localized (at distances <90 nm) with the ATP-releasing Pannexin 1 (Panx1) channel, the P2X7R purinergic receptor and ligand gated CaV3 calcium channels. However, we found no in situ association between αVβ3 integrins and the gap junction protein Cx43, whose hemichannels were shown to mediate mechanosensitive ATP release in osteocyte-like cells in vitro [26] [42].
Recent discoveries strongly support the concept that the remarkable mechanosensitivity of osteocytes is based in their cell processes, i.e., their “fingers”. The experimental demonstration by Wu et al. [22] in our laboratory that fluid forces of about 10 picoNewton on osteocyte processes triggered voltage changes in osteocytes, while forces 10-20 times higher were needed to directly stimulate osteocyte cell bodies, suggested that the processes possess specialized mechanosensitive structures not present in their bodies. McNamara et al. [27] in our laboratory discovered that osteocyte processes in situ attach directly to projections from canalicular walls at foci located approximately ~150 nm apart, a finding subsequently confirmed in human bone as well [28]. Furthermore, we found these sites on the processes were αVβ3 integrin attachment foci, while β1 based integrins dominated on osteocyte cell bodies. Wang et al. [20] developed a mathematical model showing that membrane strains at these integrin attachment foci along osteocyte processes are at least an order of magnitude greater than whole-tissue strains in loaded bone. In other words, the focal attachments of osteocyte processes to canalicular walls act like stress concentrations to amplify membrane strains, so that tiny forces on the process produce local membrane strains at those sites large enough to trigger a range of first order signaling processes (e.g., ATP, Ca2+and PGE2). Thi et al. in our group [23] confirmed this hypothesis, finding that tiny fluid forces applied to attachment foci on osteocyte processes in vitro triggered Ca2+ signaling that propagated back to the cells bodies, while the same stimulus applied away from attachment sites caused no response. Furthermore, Ca2+ signaling response evoked by fluid loading at the osteocyte process attachment foci depends on β3 integrins and ATP release.
Both β1 and β3 integrins have been implicated in osteocyte mechanotransduction in vitro and in vivo [23] [24] [25] [41] [57] [58] [59]. β1 integrins on osteocyte cell bodies may be involved in responses to large deformations [26] [59] [60]. Indeed, Jiang and co-workers showed in vitro that stretch on β1 integrins of MLO-Y4 cells opens hemichannels and releases ATP [26]. However, the mechanical stimulus used in these studies was far larger than osteocyte cell bodies can experience in vivo, so it is difficult to extrapolate from these findings. Moreover, recent in vivo studies on cell-specific deletion of β1 integrin in mice bone showed that β1 integrins play a central role in osteoblastogenesis and bone development, but do not appear to contribute substantially to adult bone mechanotransduction [61]. In contrast, several studies show that mechanotransduction in osteocytes depends substantially upon β3 integrins in vitro [23] [25] [41].
Mechanotransduction mechanisms at typical αVβ3 integrin–based focal adhesion sites are well understood. However, the αVβ3 integrin foci on osteocyte processes have unusual features which suggest that typical integrin mechanotransduction mechanisms are likely not in play here. In typical mechanically active focal adhesion complexes, the cytoplasmic domains of the α and β integrins subunits attach to a large complex of cytoplasmic adaptor and signaling proteins (e.g., talin, vinculin, paxillin, focal adhesion kinase and many more) which in turn attach to the loose, subcortical actin web in order to transduce the mechanical signals into biomechanical signals [62] [63]. Osteocyte processes are filled with a dense, tightly packed bundle of highly cross-linked parallel actin fibers [28] [30] that leaves little if any cytoplasmic space to accommodate the large array of cytoplasmic adaptor proteins at typical focal adhesion sites. Vatsa et al. [29] found no paxillin in osteocyte processes, but it was present in cell bodies where a looser actin web and sufficient space exist [16] [20] [64] [65]. Similarly, we found that vinculin was absent from osteocyte processes but was readily demonstrable in their cell bodies. Thus, the αVβ3 integrin foci along osteocyte processes do not appear to be part of typical integrin-based mechanotransductive focal adhesions.
These studies reveal that the Panx1 channel is co-localized with the integrin foci on osteocyte processes, both in situ and in vitro. Panx1 is known to provide a conduit for controlled cellular ATP release in numerous cell types including bone cells. Panx1 is a member of the pannexin family of transmembrane channel-forming proteins and is widely expressed in all tissues [66]. Pannexins are the mammalian homologues to the invertebrate gap junction proteins, the innexins. However, pannexins, including Panx1, form only non-junctional channels, i.e., “hemichannels”, that allow exchange of small molecules between the cytoplasm and the extracellular space [43] [67] [68]. Panx1 channels are voltage sensitive [69] [70]. Critically for osteocyte mechanotransduction, they also open in response to mechanical stretch [35], elevation in extracellular K+ and activation of cell surface receptors, in particular the ionotropic P2X7R [71] [72]. We also found that the P2X7R purinergic receptor colocalized with β3 integrin attachment sites on osteocyte processes, which points to a spatial as well as functional coupling for the purinergic signals released from Panx1 channels and their binding to nearby P2X7R in the progression of mechanotransduction. These findings were evident in both in vitro and in authentic osteocytes in situ. It is well established that purinergic signaling is required for normal bone growth and adaptation [40]. The T-type calcium channel CaV3 was also found to be associated with the β3 integrin-Panx1-P2X7R complex in situ. This channel has been shown to be affected by stretch activated ATP release [21], and also by membrane depolarization by the stretch activated Panx1 channel [35] [38].
The principal focus of the current study was to test for the presence and colocalization of β3 integrin and channel proteins on osteocyte cell processes. Some cell body staining for β3 integrin, Panx1, P2X7R and CaV3 was also observed, which would be expected for the obligate site of synthesis for these proteins. Indeed, it would have been surprising to have not found these proteins in osteocyte cell bodies. The current high-resolution imaging studies could not directly address function of these proteins at the cell body. However, we can make strong inferences. Principally, the β3 integrins on osteocyte cell bodies in situ cannot function as fixed mechanical anchor points that would generate elevated membrane strains as they do on osteocyte processes. β3 integrins on osteocyte process membranes attach directly to the canalicular wall, with effectively no space between them [27] [28]. In contrast, β3 integrins on osteocyte cell bodies cannot bridge the wide extracellular space (0.5-1 μm) that surrounds osteocyte bodies. Without anchoring to the bone, the β3 integrins on cell bodies would be unable to generate sufficiently high membrane strains to open stretch activated channels such as Panx1 [20]. Thus, it seems reasonable to posit that when present on osteocyte cell bodies, β3 and the candidate channel proteins either function in other capacities or are in transit to other locations, e.g. cell processes.
The current studies are the first to our knowledge, to employ SIM super-resolution microscopy approaches to interrogate the structure of bone tissue osteocytes in their native environment. This allowed us to distinguish between protein foci in close proximity to the β3 integrin foci on osteocyte processes of authentic osteocytes in situ. The SIM system used however, only has two lasers and so our studies were limited to double staining assays. STORM based assessments on isolated osteocytes allowed us to interrogate more than two proteins, and at resolutions typically associated with electron microscopy approaches. With both approaches, we found that Panx1 channel, P2X7R purinergic ligand gated and CaV3 calcium channels are clustered within ~60 nm of each other and within less than 90 nm of the β3 integrin attachment sites. Based on the Wang et al. [20] mathematical model for strain amplification, loading in the range of 20 MPa, as occurs with light jogging or fast walking, will cause membrane areal displacements of approximately 2nm2 at a distance of 100 nm from an osteocyte process αVβ3 integrin attachment site. This membrane strain level has been shown to be sufficient to open stretch activated potassium channels in neuronal cells [73]. Panx1 mechanosensitivity sits well within the elevated strain region of the osteocyte process membrane.
Among the most surprising findings of these studies was the high concentration of the osteocyte mechanotransduction complexes within the first 1.5-2 μm of osteocyte process. It should be noted, however, that these osteocyte mechanotransduction complexes were also found more distally along the process. Why these mechanotransduction complexes are concentrated in the proximal ~ 15% of the osteocyte process is unclear at this time. However, the proximal region of the process is nearest to the site of protein production. Since osteocyte processes contain a highly cross-linked (i.e., low turnover) actin bundle and lack a microtubule transport system, effective transport of channel protein clusters to more distal regions of cell processes is likely to be slow, possibly resulting in buildups in the more proximal regions. Further engineering modeling studies are needed to understand whether the local mechanical forces to which this region is subjected differ from those further distally along the process. Irrespective of how and why this arrangement arises, these data reveal a hitherto unrecognized functional polarization in osteocyte processes in situ and suggest that osteocyte processes may have a major “business end” for mechanosensing.
In summary, the current studies reveal that β3 integrin foci on the osteocyte process anchor a novel transduction complex, or “osteocyte mechanosome” which may explain the remarkable mechanosensitivity of osteocytes cell processes and the dependency of this sensitivity on ATP-based signaling. We propose the following model: During loading-induced fluid flow in the LCS, αVβ3 integrins attaching to process membrane to the canalicular wall become sites of membrane stress (strain) concentrations. The current studies showed that these β3 integrin foci co-localize with the ATP-releasing Panx1 channel, the P2X7R channel complex and the T-type CaV3 calcium channel. Mechanistically, we speculate that ATP release occurs through the localized stretch activation of Panx1 channels. This ATP binds to the P2X7R complex, which undergoes a conformational change to allow Ca2+ influx. The consequent depolarization of the cell process membrane triggers the activation of T-type channel CaV3 causing more calcium ions to enter the cell, thereby sending waves of calcium signaling that summate in the direction towards the osteocyte cell body. While functional and molecular details need to be further elucidated, our data and model are consistent with the experimental loading studies of osteocyte processes in vitro reported by us in Thi et al [23], who found that the unique and exquisite sensitivity of osteocyte processes depends on a β3 integrin complex and works through an ATP release that triggers calcium signaling. We further posit that this unique mechanotransduction complex might be targeted pharmacologically to alter mechanosensitivity of bone, and thereby improve or maintain structural integrity of bone.
Acknowledgments
Supported by grants from the National Institute of Arthritis and Musculoskeletal and Skin Diseases and the National Institute of Neurological Disorders and Stroke of the National Institutes of Health under Awards Number AR041210 and AR060445 (MBS), AR057139 (MBS and DCS) and NS092466 (DCS), Analytical Imaging Facility of Albert Einstein College of Medicine and the NCI Cancer Center support grant (P30CA013330), and SIG-1S10OD18218-1 (dSTORM imaging). The content is solely the responsibility of the authors and does not necessarily represent the official views of the National Institutes of Health. Damien Laudier provided guidance with histology and IHC studies. Authors contributions: PCZ, MBS, DCS and SW generated the hypothesis and designed the studies. PCZ, MBS - performed all tissue studies. MMT, RS and DCS - performed in vitro and STORM studies. PCZ, DCS, RJM and MBS - analyses and writing, and are responsible for data integrity.
Footnotes
Authors contributions: PCZ, MBS, DCS and SW generated the hypothesis and designed the studies. PCZ, MBS - performed all tissue studies. MMT, RS and DCS - performed in vitro and STORM studies. PCZ, DCS, RJM and MBS - analyses and writing, and are responsible for the integrity of the data.
References
- 1.Globus RK, Bikle DD, Morey-Holton E. The temporal response of bone to unloading. Endocrinology. 1986;118(2):733–42. doi: 10.1210/endo-118-2-733. [DOI] [PubMed] [Google Scholar]
- 2.Krahl H, et al. Stimulation of bone growth through sports. A radiologic investigation of the upper extremities in professional tennis players. Am J Sports Med. 1994;22(6):751–7. doi: 10.1177/036354659402200605. [DOI] [PubMed] [Google Scholar]
- 3.Turner CH, Pavalko FM. Mechanotransduction and functional response of the skeleton to physical stress: the mechanisms and mechanics of bone adaptation. J Orthop Sci. 1998;3(6):346–55. doi: 10.1007/s007760050064. [DOI] [PubMed] [Google Scholar]
- 4.Burr DB, Robling AG, Turner CH. Effects of biomechanical stress on bones in animals. Bone. 2002;30(5):781–6. doi: 10.1016/s8756-3282(02)00707-x. [DOI] [PubMed] [Google Scholar]
- 5.Doty SB. Morphological evidence of gap junctions between bone cells. Calcif Tissue Int. 1981;33(5):509–12. doi: 10.1007/BF02409482. [DOI] [PubMed] [Google Scholar]
- 6.Pead MJ, et al. Increased 3H-uridine levels in osteocytes following a single short period of dynamic bone loading in vivo. Calcif Tissue Int. 1988;43(2):92–6. doi: 10.1007/BF02555153. [DOI] [PubMed] [Google Scholar]
- 7.Palumbo C, Palazzini S, Marotti G. Morphological study of intercellular junctions during osteocyte differentiation. Bone. 1990;11(6):401–6. doi: 10.1016/8756-3282(90)90134-k. [DOI] [PubMed] [Google Scholar]
- 8.Weinbaum S, Cowin SC, Zeng Y. A model for the excitation of osteocytes by mechanical loading-induced bone fluid shear stresses. J Biomech. 1994;27(3):339–60. doi: 10.1016/0021-9290(94)90010-8. [DOI] [PubMed] [Google Scholar]
- 9.Klein-Nulend J, et al. Sensitivity of osteocytes to biomechanical stress in vitro. FASEB J. 1995;9(5):441–5. doi: 10.1096/fasebj.9.5.7896017. [DOI] [PubMed] [Google Scholar]
- 10.Burger EH, et al. Function of osteocytes in bone–their role in mechanotransduction. J Nutr. 1995;125(7 Suppl):2020S–2023S. doi: 10.1093/jn/125.suppl_7.2020S. [DOI] [PubMed] [Google Scholar]
- 11.Mullender MG, Huiskes R. Osteocytes and bone lining cells: which are the best candidates for mechano-sensors in cancellous bone? Bone. 1997;20(6):527–32. doi: 10.1016/s8756-3282(97)00036-7. [DOI] [PubMed] [Google Scholar]
- 12.Tatsumi S, et al. Targeted ablation of osteocytes induces osteoporosis with defective mechanotransduction. Cell Metab. 2007;5(6):464–75. doi: 10.1016/j.cmet.2007.05.001. [DOI] [PubMed] [Google Scholar]
- 13.Bonewald LF. The amazing osteocyte. J Bone Miner Res. 2011;26(2):229–38. doi: 10.1002/jbmr.320. [DOI] [PMC free article] [PubMed] [Google Scholar]
- 14.Schaffler MB, et al. Osteocytes: master orchestrators of bone. Calcif Tissue Int. 2014;94(1):5–24. doi: 10.1007/s00223-013-9790-y. [DOI] [PMC free article] [PubMed] [Google Scholar]
- 15.Weinbaum S, Guo P, You L. A new view of mechanotransduction and strain amplification in cells with microvilli and cell processes. Biorheology. 2001;38(2-3):119–42. [PubMed] [Google Scholar]
- 16.You LD, et al. A model for strain amplification in the actin cytoskeleton of osteocytes due to fluid drag on pericellular matrix. Journal of Biomechanics. 2001;34(11):1375–1386. doi: 10.1016/s0021-9290(01)00107-5. [DOI] [PubMed] [Google Scholar]
- 17.Cowin SC. Mechanosensation and fluid transport in living bone. J Musculoskelet Neuronal Interact. 2002;2(3):256–60. [PubMed] [Google Scholar]
- 18.Reilly GC, et al. Fluid flow induced PGE(2) release by bone cells is reduced by glycocalyx degradation whereas calcium signals are not. Biorheology. 2003;40(6):591–603. [PubMed] [Google Scholar]
- 19.Han YF, et al. Mechanotransduction and strain amplification in osteocyte cell processes. Proceedings of the National Academy of Sciences of the United States of America. 2004;101(47):16689–16694. doi: 10.1073/pnas.0407429101. [DOI] [PMC free article] [PubMed] [Google Scholar]
- 20.Wang YL, et al. A model for the role of integrins in flow induced mechanotransduction in osteocytes. Proceedings of the National Academy of Sciences of the United States of America. 2007;104(40):15941–15946. doi: 10.1073/pnas.0707246104. [DOI] [PMC free article] [PubMed] [Google Scholar]
- 21.Thompson WR, et al. Association of the alpha(2)delta(1) subunit with Ca(v)3.2 enhances membrane expression and regulates mechanically induced ATP release in MLO-Y4 osteocytes. J Bone Miner Res. 2011;26(9):2125–39. doi: 10.1002/jbmr.437. [DOI] [PMC free article] [PubMed] [Google Scholar]
- 22.Wu D, et al. On the electrophysiological response of bone cells using a Stokesian fluid stimulus probe for delivery of quantifiable localized picoNewton level forces. Journal of Biomechanics. 2011;44(9):1702–1708. doi: 10.1016/j.jbiomech.2011.03.034. [DOI] [PMC free article] [PubMed] [Google Scholar]
- 23.Thi MM, et al. Mechanosensory responses of osteocytes to physiological forces occur along processes and not cell body and require alphaVbeta3 integrin. Proc Natl Acad Sci U S A. 2013;110(52):21012–7. doi: 10.1073/pnas.1321210110. [DOI] [PMC free article] [PubMed] [Google Scholar]
- 24.Kaneko K, et al. Integrin alphav in the mechanical response of osteoblast lineage cells. Biochem Biophys Res Commun. 2014;447(2):352–7. doi: 10.1016/j.bbrc.2014.04.006. [DOI] [PMC free article] [PubMed] [Google Scholar]
- 25.Haugh MG, Vaughan TJ, McNamara LM. The role of integrin alpha(V)beta(3) in osteocyte mechanotransduction. J Mech Behav Biomed Mater. 2015;42:67–75. doi: 10.1016/j.jmbbm.2014.11.001. [DOI] [PubMed] [Google Scholar]
- 26.Batra N, et al. Mechanical stress-activated integrin alpha5beta1 induces opening of connexin 43 hemichannels. Proc Natl Acad Sci U S A. 2012;109(9):3359–64. doi: 10.1073/pnas.1115967109. [DOI] [PMC free article] [PubMed] [Google Scholar]
- 27.McNamara LM, et al. Attachment of osteocyte cell processes to the bone matrix. Anat Rec (Hoboken) 2009;292(3):355–63. doi: 10.1002/ar.20869. [DOI] [PMC free article] [PubMed] [Google Scholar]
- 28.Kamioka H, et al. Microscale fluid flow analysis in a human osteocyte canaliculus using a realistic high-resolution image-based three-dimensional model. Integrative Biology. 2012;4(10):1198–1206. doi: 10.1039/c2ib20092a. [DOI] [PubMed] [Google Scholar]
- 29.Vatsa A, et al. Paxillin localisation in osteocytes-Is it determined by the direction of loading? Biochemical and Biophysical Research Communications. 2008;377(4):1019–1024. doi: 10.1016/j.bbrc.2007.12.174. [DOI] [PubMed] [Google Scholar]
- 30.You LD, et al. Ultrastructure of the osteocyte process and its pericellular matrix. Anatomical Record Part a-Discoveries in Molecular Cellular and Evolutionary Biology. 2004;278a(2):505–513. doi: 10.1002/ar.a.20050. [DOI] [PubMed] [Google Scholar]
- 31.Tanaka-Kamioka K, et al. Osteocyte shape is dependent on actin filaments and osteocyte processes are unique actin-rich projections. J Bone Miner Res. 1998;13(10):1555–68. doi: 10.1359/jbmr.1998.13.10.1555. [DOI] [PubMed] [Google Scholar]
- 32.Kanchanawong P, et al. Nanoscale architecture of integrin-based cell adhesions. Nature. 2010;468(7323):580–U262. doi: 10.1038/nature09621. [DOI] [PMC free article] [PubMed] [Google Scholar]
- 33.Kuo JC, et al. Isolation of Focal Adhesion Proteins for Biochemical and Proteomic Analysis. Integrin and Cell Adhesion Molecules: Methods and Protocols. 2011;757:297–323. doi: 10.1007/978-1-61779-166-6_19. [DOI] [PMC free article] [PubMed] [Google Scholar]
- 34.Mobasheri A, et al. Integrins and stretch activated ion channels; putative components of functional cell surface mechanoreceptors in articular chondrocytes. Cell Biology International. 2002;26(1):1–18. doi: 10.1006/cbir.2001.0826. [DOI] [PubMed] [Google Scholar]
- 35.Bao L, Locovei S, Dahl G. Pannexin membrane channels are mechanosensitive conduits for ATP. Febs Letters. 2004;572(1-3):65–68. doi: 10.1016/j.febslet.2004.07.009. [DOI] [PubMed] [Google Scholar]
- 36.Shao Y, Alicknavitch M, Farach-Carson MC. Expression of voltage sensitive calcium channel (VSCC) L-type Cav1.2 (alpha1C) and T-type Cav3.2 (alpha1H) subunits during mouse bone development. Dev Dyn. 2005;234(1):54–62. doi: 10.1002/dvdy.20517. [DOI] [PubMed] [Google Scholar]
- 37.Kudirka JC, et al. P2Y nucleotide receptor signaling through MAPK/ERK is regulated by extracellular matrix: Involvement of beta 3 integrins. Journal of Cellular Physiology. 2007;213(1):54–64. doi: 10.1002/jcp.21087. [DOI] [PubMed] [Google Scholar]
- 38.Beckel JM, et al. Mechanosensitive Release of Adenosine 5′-triphosphate Through Pannexin Channels and Mechanosensitive Upregulation of Pannexin Channels in Optic Nerve Head Astrocytes: A Mechanism for Purinergic Involvement in Chronic Strain. Glia. 2014;62(9):1486–1501. doi: 10.1002/glia.22695. [DOI] [PMC free article] [PubMed] [Google Scholar]
- 39.Locovei S, Bao L, Dahl G. Pannexin 1 in erythrocytes: Function without a gap. Proceedings of the National Academy of Sciences of the United States of America. 2006;103(20):7655–7659. doi: 10.1073/pnas.0601037103. [DOI] [PMC free article] [PubMed] [Google Scholar]
- 40.Li J, et al. The P2X7 nucleotide receptor mediates skeletal mechanotransduction. J Biol Chem. 2005;280(52):42952–9. doi: 10.1074/jbc.M506415200. [DOI] [PubMed] [Google Scholar]
- 41.Miyauchi A, et al. AlphaVbeta3 integrin ligands enhance volume-sensitive calcium influx in mechanically stretched osteocytes. J Bone Miner Metab. 2006;24(6):498–504. doi: 10.1007/s00774-006-0716-x. [DOI] [PubMed] [Google Scholar]
- 42.Genetos DC, et al. Oscillating fluid flow activation of gap junction hemichannels induces ATP release from MLO-Y4 osteocytes. Journal of Cellular Physiology. 2007;212(1):207–214. doi: 10.1002/jcp.21021. [DOI] [PMC free article] [PubMed] [Google Scholar]
- 43.Thi MM, et al. Connexin43 and Pannexin1 Channels in Osteoblasts: Who Is the “Hemichannel”? Journal of Membrane Biology. 2012;245(7):401–409. doi: 10.1007/s00232-012-9462-2. [DOI] [PMC free article] [PubMed] [Google Scholar]
- 44.Gustafsson MGL. Surpassing the lateral resolution limit by a factor of two using structured illumination microscopy. Journal of Microscopy-Oxford. 2000;198:82–87. doi: 10.1046/j.1365-2818.2000.00710.x. [DOI] [PubMed] [Google Scholar]
- 45.Heintzmann R, Ficz G. Breaking the resolution limit in light microscopy. Digital Microscopy, 3rd Edition. 2007;81:561–+. doi: 10.1016/S0091-679X(06)81026-5. [DOI] [PubMed] [Google Scholar]
- 46.Gustafsson MGL, et al. Three-dimensional resolution doubling in wide-field fluorescence microscopy by structured illumination. Biophysical Journal. 2008;94(12):4957–4970. doi: 10.1529/biophysj.107.120345. [DOI] [PMC free article] [PubMed] [Google Scholar]
- 47.Huang B, Babcock H, Zhuang XW. Breaking the Diffraction Barrier: Super-Resolution Imaging of Cells. Cell. 2010;143(7):1047–1058. doi: 10.1016/j.cell.2010.12.002. [DOI] [PMC free article] [PubMed] [Google Scholar]
- 48.Schermelleh L, Heintzmann R, Leonhardt H. A guide to super-resolution fluorescence microscopy. Journal of Cell Biology. 2010;190(2):165–175. doi: 10.1083/jcb.201002018. [DOI] [PMC free article] [PubMed] [Google Scholar]
- 49.Kennedy OD, et al. Osteocyte apoptosis is required for production of osteoclastogenic signals following bone fatigue in vivo. Bone. 2014;64:132–137. doi: 10.1016/j.bone.2014.03.049. [DOI] [PMC free article] [PubMed] [Google Scholar]
- 50.Schneider CA, R WS, Elicieri KW. NIH Image to ImageJ: 25 years of image analysis. Nature Methods. 2012;9(7):671–675. doi: 10.1038/nmeth.2089. [DOI] [PMC free article] [PubMed] [Google Scholar]
- 51.Rosin PL. Unimodal thresholding. Pattern Recognition. 2001;34(11):2083–2096. [Google Scholar]
- 52.Manders EMM, Verbeek FJ, Aten JA. Measurement of Colocalization of Objects in Dual-Color Confocal Images. Journal of Microscopy-Oxford. 1993;169:375–382. doi: 10.1111/j.1365-2818.1993.tb03313.x. [DOI] [PubMed] [Google Scholar]
- 53.Zinchuk V, Zinchuk O, Okada T. Quantitative colocalization analysis of multicolor confocal immunofluorescence microscopy images: Pushing pixels to explore biological phenomena. Acta Histochemica Et Cytochemica. 2007;40(4):101–111. doi: 10.1267/ahc.07002. [DOI] [PMC free article] [PubMed] [Google Scholar]
- 54.Dunn KW, Kamocka MM, McDonald JH. A practical guide to evaluating colocalization in biological microscopy. Am J Physiol Cell Physiol. 2011;300(4):C723–42. doi: 10.1152/ajpcell.00462.2010. [DOI] [PMC free article] [PubMed] [Google Scholar]
- 55.Zinchuk V, Wu Y, Grossenbacher-Zinchuk O. Bridging the gap between qualitative and quantitative colocalization results in fluorescence microscopy studies. Scientific Reports. 2013;3 doi: 10.1038/srep01365. [DOI] [PMC free article] [PubMed] [Google Scholar]
- 56.Winterflood CM, Ewers H. Single-Molecule Localization Microscopy using mCherry. Chemphyschem. 2014;15(16):3447–3451. doi: 10.1002/cphc.201402423. [DOI] [PubMed] [Google Scholar]
- 57.Weyts FAA, et al. ERK activation and alpha v beta 3 integrin signaling through Shc recruitment in response to mechanical stimulation in human osteoblasts. Journal of Cellular Biochemistry. 2002;87(1):85–92. doi: 10.1002/jcb.10278. [DOI] [PubMed] [Google Scholar]
- 58.Plotkin LI, et al. Mechanical stimulation prevents osteocyte apoptosis: requirement of integrins, Src kinases, and ERKs. American Journal of Physiology-Cell Physiology. 2005;289(3):C633–C643. doi: 10.1152/ajpcell.00278.2004. [DOI] [PubMed] [Google Scholar]
- 59.Litzenberger JB, et al. Beta1 integrins mediate mechanosensitive signaling pathways in osteocytes. Calcif Tissue Int. 2010;86(4):325–32. doi: 10.1007/s00223-010-9343-6. [DOI] [PMC free article] [PubMed] [Google Scholar]
- 60.Pommerenke H, et al. The mode of mechanical integrin stressing controls intracellular signaling in osteoblasts. J Bone Miner Res. 2002;17(4):603–11. doi: 10.1359/jbmr.2002.17.4.603. [DOI] [PubMed] [Google Scholar]
- 61.Shekaran A, et al. The effect of conditional inactivation of beta 1 integrins using twist 2 Cre, Osterix Cre and osteocalcin Cre lines on skeletal phenotype. Bone. 2014;68:131–141. doi: 10.1016/j.bone.2014.08.008. [DOI] [PMC free article] [PubMed] [Google Scholar]
- 62.Banes AJ, et al. Mechanoreception at the cellular level: The detection, interpretation, and diversity of responses to mechanical signals. Biochemistry and Cell Biology-Biochimie Et Biologie Cellulaire. 1995;73(7-8):349–365. doi: 10.1139/o95-043. [DOI] [PubMed] [Google Scholar]
- 63.Geiger B, Yamada KM. Molecular architecture and function of matrix adhesions. Cold Spring Harb Perspect Biol. 2011;3(5) doi: 10.1101/cshperspect.a005033. [DOI] [PMC free article] [PubMed] [Google Scholar]
- 64.Thi MM, et al. The role of the glycocalyx in reorganization of the actin cytoskeleton under fluid shear stress: a “bumper-car” model. Proc Natl Acad Sci U S A. 2004;101(47):16483–8. doi: 10.1073/pnas.0407474101. [DOI] [PMC free article] [PubMed] [Google Scholar]
- 65.Galbraith CG, Yamada KM, Galbraith JA. Polymerizing actin fibers position integrins primed to probe for adhesion sites. Science. 2007;315(5814):992–5. doi: 10.1126/science.1137904. [DOI] [PubMed] [Google Scholar]
- 66.Penuela S, Gehi R, Laird DW. The biochemistry and function of pannexin channels. Biochim Biophys Acta. 2013;1828(1):15–22. doi: 10.1016/j.bbamem.2012.01.017. [DOI] [PubMed] [Google Scholar]
- 67.Bruzzone R, et al. Pannexins, a family of gap junction proteins expressed in brain. Proc Natl Acad Sci U S A. 2003;100(23):13644–9. doi: 10.1073/pnas.2233464100. [DOI] [PMC free article] [PubMed] [Google Scholar]
- 68.Wang J, Dahl G. SCAM analysis of Panx1 suggests a peculiar pore structure. J Gen Physiol. 2010;136(5):515–27. doi: 10.1085/jgp.201010440. [DOI] [PMC free article] [PubMed] [Google Scholar]
- 69.Bunse S, et al. The potassium channel subunit Kvbeta3 interacts with pannexin 1 and attenuates its sensitivity to changes in redox potentials. FEBS J. 2009;276(21):6258–70. doi: 10.1111/j.1742-4658.2009.07334.x. [DOI] [PubMed] [Google Scholar]
- 70.Iglesias RM, Spray DC. Pannexin1-Mediated ATP Release Provides Signal Transmission Between Neuro2A Cells. Neurochemical Research. 2012;37(6):1355–1363. doi: 10.1007/s11064-012-0720-6. [DOI] [PMC free article] [PubMed] [Google Scholar]
- 71.Iglesias R, et al. P2X7 receptor-Pannexin1 complex: pharmacology and signaling. Am J Physiol Cell Physiol. 2008;295(3):C752–60. doi: 10.1152/ajpcell.00228.2008. [DOI] [PMC free article] [PubMed] [Google Scholar]
- 72.Isakson BE, Thompson RJ. Pannexin-1 as a potentiator of ligand-gated receptor signaling. Channels. 2014;8(2):118–123. doi: 10.4161/chan.27978. [DOI] [PMC free article] [PubMed] [Google Scholar]
- 73.Honore E, et al. Desensitization of mechano-gated K2P channels. Proc Natl Acad Sci U S A. 2006;103(18):6859–64. doi: 10.1073/pnas.0600463103. [DOI] [PMC free article] [PubMed] [Google Scholar]