Abstract
Patient-derived colorectal tumor organoids (CTOs) closely recapitulate the complex morphological, phenotypic and genetic features observed in in vivo tumors. Therefore, evaluation of drug distribution and metabolism in this model system can provide valuable information to predict the clinical outcome of a therapeutic response in individual patients. In this report, we applied matrix-assisted laser desorption/ionization mass spectrometry imaging (MALDI-MSI) to examine the spatial distribution of the drug irinotecan and its metabolites in CTOs from two patients. Irinotecan is a prodrug and is often prescribed as part of therapeutic regimes for patients with advanced colorectal cancer. Irinotecan shows a time-dependent and concentration-dependent permeability and metabolism in the CTOs. More interestingly, the active metabolite SN-38 does not co-localize well with the parent drug irinotecan and the inactive metabolite SN-38G. The phenotypic effect of irinotecan metabolism was also confirmed by a viability study showing significantly reduced proliferation in the drug treated CTOs. MALDI-MSI can be used to investigate various pharmaceutical compounds in CTOs derived from different patients. By analyzing multiple CTOs from a patient, this method could be used to predict patient-specific drug responses and help to improve personalized dosing regimens.
Keywords: MALDI-MSI, colorectal tumor organoids, irinotecan
TOC image
INTRODUCTION
As solid tumors develop, aberrant and insufficient vascularization gives rise to regions within the tumor that lack adequate nutrient and oxygen levels. This same feature can also hinder the administration and effectiveness of small molecule chemotherapeutics which rely on passive diffusion through the tumor to reach their intended targets1–3. Cells residing in regions of the tumor that lack adequate vascularization are shielded from the drug or encounter a lower effective dose. Distribution and metabolism of drugs throughout solid tumors are key factors for tumor responses to therapeutics, and need to be studied in great detail.
Matrix-assisted laser desorption/ionization imaging mass spectrometry imaging (MALDI-MSI) is a powerful analytical methodology that enables spatial examination of molecules in a solid sample. Our research group has previously applied MALDI-MSI to examine the distribution of endogenous and exogenous molecules in three-dimensional cell cultures, or spheroids, derived from immortalized cell lines4–11. In particular, we have mapped the spatial patterns of the antineoplastic pro-drug irinotecan and its active and inactive metabolites in spheroids5. Irinotecan is a frontline topoisomerase I inhibitor used in the treatment of colorectal cancer (CRC). Upon hydrolysis by carboxylesterases within the target cell, irinotecan is converted into its active metabolite SN-38. However, SN-38 can be further metabolized into an inactive form, SN-38 glucuronide (SN-38G) by uridine diphosphate glucuronosyltransferases (UGTs)12. Several studies have shown that 3D spheroid models are less sensitive to a variety of drugs, including irinotecan, compared to in vitro 2D monolayer models largely due to drug diffusion limitations13–15. While spheroids are able to reproduce some aspects of tumor biology observed in patients, they are unable to recapitulate the morphological, phenotypic, and genetic heterogeneity of in vivo tumors. To better understand how such heterogeneity may impact drug diffusion, distribution, and metabolism, we sought to extend our previous findings in spheroids to a patient-derived colorectal tumor organoid (CTO) model of cancer.
Spheroids often adopt a spherical shape that does not faithfully capture the more complex morphological structures observed in patient tumors. CTOs are capable of retaining many of these aspects, in particular villi and crypt structures which allow for the growth and maintenance of local niches characterized by unique cell types. CTOs contain multiple intestinal cell types including Lgr5+ adult intestinal stem cells (ISCs) as well as further differentiated goblet and endocrine cells16. These various cell types contribute to the complex organization and cellular relationships, and include cell signaling networks that are lost in traditional cell culture models. Previous research has shown that these different cell types utilize distinct metabolic programs with Lgr5+ cells displaying increased mitochondrial activity compared to more differentiated Paneth cells17. Reactive oxygen species produced during mitochondrial oxidative phosphorylation activity then drives the differentiation of Lgr5+ cells and crypt formation17. Furthermore, addition of fatty acid constituents such as palmitic acid to CTO culture media increases the number of Lgr5+ cells which are required for the initiation, maintenance, and metastatic capacity of CTOs in vitro18–20.
Due to the difficulty in establishing new cancer cell lines, the full spectrum of cancer genotypes is inadequately represented by those lines currently available21, 22. CTOs can readily be established with high success rates from patient primary and metastatic resected tissue allowing for the study of a diverse set of lines that accurately represent the genetic spectrum of cancer types23. Similarly, in vitro cell lines have been shown to be phenotypically distinct from their tumor of origin; indeed gene expression profiles of tumors tend to be more similar to the corresponding normal tissue then they are to cell lines24, 25. CTOs present a novel platform for directly evaluating drugs in patient-specific tumor tissue, and previous studies suggest that drug response in organoids corresponds to drug response in the host from which the organoids are derived26,27. For the analysis of drug response, molecular and chemical assays can also be used. However, many of these methods require extracting substrates from cells or tissue fixation, which eliminates all spatial information, morphology, and heterogeneity. Therefore, there is a great need for imaging techniques for the study of organoid behavior and the analysis of drug response. Light microscopy, fluorescent microscopy, time-lapse microscopy, multiphoton fluorescence imaging, and optical coherence tomography (OCT) are some optical imaging technologies used to study organoids26–34. Specifically, optical metabolic imaging (OMI) is a multiphoton microscopy to detect the intrinsic fluorescence intensities and lifetimes of nicotinamide adenine dinucleotide (NADH) and flavin adenine dinucleotide (FAD), coenzymes of metabolic reactions. OMI has been shown to be a sensitive technique to assess drug-induced changes in cellular metabolism of organoids to predict the action of anticancer compounds28,32. However, this technique does not allow direct imaging of drugs and drug metabolites to evaluate the distribution and metabolic properties of therapeutics in organoids. Alternatively, extending label-free MSI from cell line derived spheroids to CTOs will facilitate the exploration of how different cell types within CTOs respond to treatment and to what extent patient-to-patient heterogeneity influences drug penetration and distribution, ultimately impacting treatment response. This approach might also provide a method to rapidly evaluate whether drugs or drug combinations will be metabolized for a specific patient, thus providing a personalized assessment of drug efficacy.
METHODS
Cell Culture and Growth of the CTOs
Tissue from primary colon tumors and liver metastases was collected from patients who received informed consent for a research specimen protocol approved by the University of Southern California Internal Review Board. Patient tumors were washed in PBS, minced, and digested with 1.5 mg/mL collagenase, 20 μg/mL hyaluronidase, and 10 μM Ly27632. For organoid formation, isolated cells were seeded in Cultrex Basement Membrane Extract Type II (Trevigen, Gaithersburg, MD) and cultured in defined media (described by Sato and Clevers16,35): Advanced Dulbecco’s modified Eagle’s medium/F12 supplemented with 10% FBS, 1% penicillin/streptomycin, 1% HEPES, 1% GlutaMax, 1 × N2 (Sigma Aldrich, St. Louis, MO), 1× B27 (Sigma Aldrich, St. Louis, MO), 50 ng/ml EGF (Life Technologies, Carlsbad, CA), 100 ng/ml Noggin (Tonbo, San Diego, CA) 1mM N-acetylcysteine (Sigma Aldrich, St. Louis, MO), 10 mM nicotinamide (Sigma Aldrich, St. Louis, MO), 500 nM A 83-01 (EMD Millipore, Billerica, MA), 10 mM SB202190 (Sigma Aldrich, St. Louis, MO), and 0.01mM PGE2 (Sigma Aldrich, St. Louis, MO).
Drug Treatment and CTOs Harvest
For drug treatment studies, organoids were grown to approximately 500 μm in diameter and then treated with irinotecan or DMSO control. Irinotecan (Selleck Chemicals, Houston, TX) was resuspended in DMSO and added to the culture media at the specified final concentrations. Fresh culturing medium supplemented with irinotecan was added every day for the duration of the experiment. After three days of culturing, the media was aspirated and the organoids were washed three times with DPBS, treated with TrypLE Express (Thermo Fisher Scientific, Waltham, MA) for five minutes after which time the TrypLE was removed, washed again in DPBS and the organoids were covered in gelatin (350mg/ml) and stored at −80°C. CTOs were then sectioned into 12 μm-thick slices using a Leica CM1850 cryostat (Leica Microsystems, Wetzlar, Germany)5. CTOs are usually within sizes ranging from 50 to 500 μm, which are too small to be visible in gelatin blocks during cryo-sectioning. Therefore, the whole gelatin blocks were sliced. Hematoxylin and eosin (H&E) or immunofluorescence staining was then performed on part of the slides, to localize the CTOs. Once the CTOs were located on a slide, a consecutive glass slide was used for MALDI-MSI analysis.
Sample Preparation for MALDI-MSI Analysis
The general workflow for performing MALDI-MSI in CTOs is shown in Figure 1. Irinotecan-d10 hydrochloride (Santa Cruz Biotechnology, Santa Cruz, CA) was used as the internal standard (IS) for relative quantitation36. Figure 2 illustrates the chemical structures of irinotecan, irinotecan-d10, SN-38 and SN-38G. IS was prepared at a concentration of 0.05 mM in nanoPure water. A TM-sprayer nebulizer (HTX Technologies, Carrboro, NC) was used to apply the IS followed by the matrix for MALDI-MSI analysis. The IS was applied at 30 °C for 4 passes over the sample surface. The pressure was set at 10 psi, gas flow rate was 3 L/min, and nozzle height was 40 mm. The flow rate was 0.03 mL/min at a moving velocity of 1000 mm/min with a track spacing of 2 mm. There was a dry time of 30 seconds between each pass. The slides were then stored in a desiccator to dry overnight before matrix application. The matrix sDHB (mixture of 2,5-Dihydroxybenzoic acid, and 2-hydroxy-5-methoxybenzoic acid) was purchased (Sigma, St. Louis, MO) and prepared in 0.2% trifluoroacetic acid (TFA) (EMB, Billerica, MA) and 50% Acetonitrile to yield a final concentration of 10 mg/mL. For application of the matrix, the nozzle temperature was set to 70 °C. The stage was moved at 1000 mm/min with 2 mm track spacing for a total of 8 matrix coats. Drying time was 30 seconds between each pass. After matrix was applied, the sample was then allowed a full dryness in a desiccator before MALDI-MSI analysis. H&E staining was performed on the same sections used for MALDI analysis after removing the matrix through methanol and ethanol washings.
Figure 1.
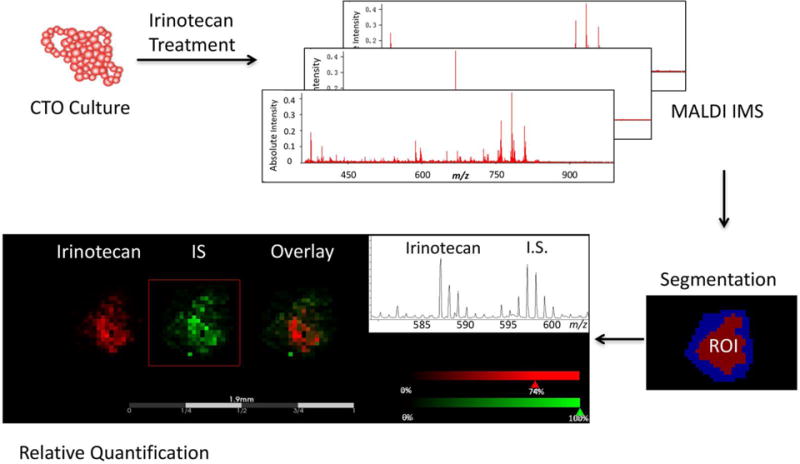
Overall workflow for spatial analysis of drug and metabolites in CTOs by MALDI-MSI.
Figure 2.
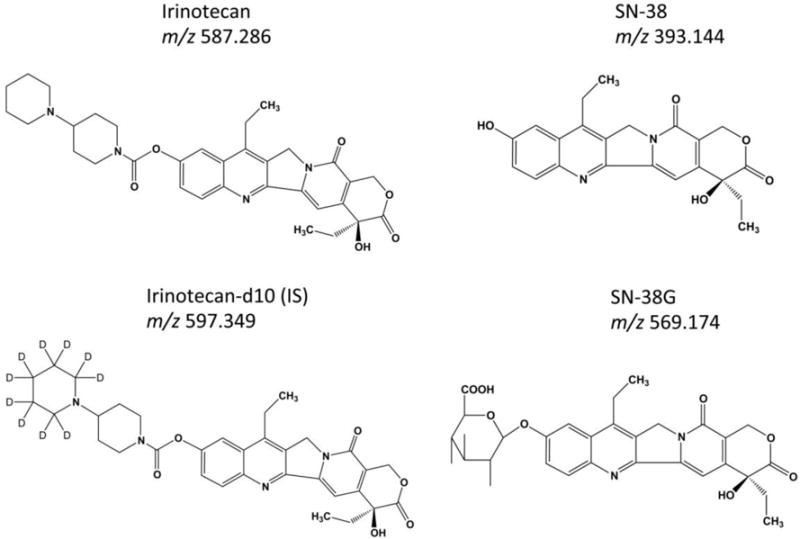
Chemical structures of Irinotecan, SN-38, SN-38G, and d10-Irinotecan (IS).
MALDI-MSI and Data Analysis
Mass spectra were acquired on an UltrafleXtreme TOF/TOF mass spectrometer (Bruker Daltonics, Billerica, MA) equipped with smartbeam II Nd:YAG 355 nm laser operating in reflectron, positive ion mode at 1000 Hz in the mass range of 200–1000 m/z. For MSI analysis, 1000 laser shots were accumulated at each pixel with a lateral resolution of 35 μm diameter using the “small” focus setting under optimized delayed extraction conditions. External calibration was performed using a custom peptide mixture by spotting the standards on a region without gelatin near the CTOs section.
The data were visualized by FlexImaging (version 4.1; Bruker Daltonics, Billerica, MA) or analyzed with SCiLS Lab (ver. 2015; Bremen, Germany). Raw data was imported into SCiLS Lab software. The TopHat algorithm was used to remove baseline, and peak picking was performed using an orthogonal matching pursuit algorithm. Automatic spatial segmentation was used as a first step in data mining to distinguish between the CTOs region and the gelatin region. In this step, similarities between spectra were calculated and grouped into different clusters. All spectra were displayed as a color-coded spatial segmentation map according to their cluster assignment37,38. Spectra from the CTOs cells were then saved as a new region and used for further statistical analysis. For supervised analysis, peaks that discriminated drug treated and untreated CTOs were elucidated by means of receiver operating characteristic (ROC) curves to find discriminating m/z signals4. Individual m/z images were created from the selected ions and the mean ion intensity normalized to the IS were calculated.
Immunofluorescence Staining and Imaging
CTOs samples were fixed in PBS with 4% (w/v) paraformaldehyde at room temperature (RT) for 30 min. Slides were then blocked and permeabilized for 20 min. Rabbit anti-Ki-67 primary antibody (Cell Signaling Technologies, Inc, Danvers, MA), prepared at 1:100 dilution, was added and held in place on the CTOs section by surface tension for 2 h at RT. The goat anti-rabbit IgG-TRITC second antibody (Thermo Scientific, Waltham, MA), diluted at 1:100, was added the same way for 1 h at RT in the dark, followed by incubation with 4′,6-Diamidino-2-phenylindole (DAPI, Sigma, St. Louis, MO) at 1:500 for 5 min. After the second antibody and DAPI were removed and washed, mounting media (Thermo Scientific, Waltham, MA) was added and coverslip was placed on top of the glass slides. The slides were allowed to dry for 30 min in the dark, and then sealed with fingernail polish. Negative controls consisted of samples not incubated with the primary antibody, but only with the secondary antibody.
Confocal z-stack images were acquired on a Nikon A1R confocal laser microscope system (Nikon Instruments Inc., Melville, NY). Optical sections were acquired at 2 μm intervals and stacked into a z-projection using software Fiji/Image J (National Institute of Health) from which fluorescence intensity was calculated. For quantitative comparisons, relative proliferation was determined by normalizing Ki-67 images by their corresponding DAPI intensities.
RESULTS AND DISCUSSION
MSI is a powerful technology that has been applied to visualize endogenous and exogenous molecules including peptides, proteins, lipids, drugs and metabolites39,40. In pharmaceutical research, label-free MALDI-MSI has been used to evaluate therapeutics. A spatial resolution of 30 to 500 μm is standard for most MALDI-MSI experiments, which is comparable to the resolution of autoradiography40. However, a significant advantage of MALDI-MSI compared to other techniques is that it can also easily distinguish between drug molecules and their metabolites based on their specific mass-to-charge ratios. In previous studies, we have successfully implemented this technique with the spheroid model system to elucidate localization of drugs and metabolites4–11. In this investigation, we are expanding the application of MALDI-MSI to assess drug response, distribution and metabolism in patient-derived CTOs samples, which more closely mimic the complex morphological structures and genetic characteristics observed in tumors.
Time course of irinotecan penetration and metabolism in 12620 CTOs
As a proof of concept study, we evaluated the distribution of irinotecan in CTOs. 12620 CTOs, derived from a colon metastatic to liver tumor, were treated with 20.6 μM irinotecan for different lengths of time (6 h or 24h). As shown in Figure 3, irinotecan (m/z 587.3) is detected predominantly on the edge of CTOs after 6 h and fully penetrates into the core region of CTOs after 24 h of treatment. Spectra collected at different time points show that the average signal intensity from irinotecan is much higher in the 24 h treated CTOs compared to the 6 h treated ones, while no drug signal is observed in the control, untreated samples.
Figure 3.
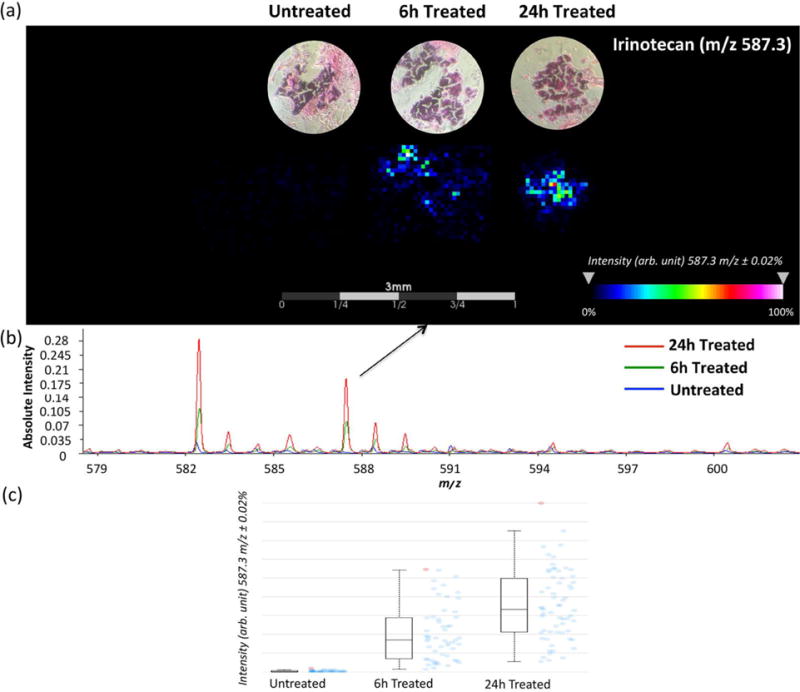
MALDI-MSI ion intensity maps (a), summed mass spectra (b) and intensity box plots (c) of organoids treated with 20.6 μM irinotecan for 0 h, 6 h, and 24 h. Irinotecan is more abundant on the edge of organoids at the first 6 h, but fully penetrates the organoids after 24 h of treatment. The box plots shows a median intensity. Blue dots represent the spectra in which intensities of the given m/z interval is between the lower and upper quartiles, and red dots represent outliers.
Two metabolites of irinotecan, the active metabolite SN-38 and inactive metabolite SN-38G, were also detected in the 24 h treated CTOs, but not in 6 h treated samples (Figure 4a & Supplemental Figure 1). Five CTO replicates were analyzed for each treatment condition. To further analyze their distribution patterns and to determine if the two metabolites co-localized, Pearson correlation analysis was performed. A correlation threshold of 0.4 was selected (p ≤ 0.05), and with these settings, irinotecan (m/z 587.3) and SN-38G (m/z 569.2) show a co-localization (Figure 4b). By comparison, the correlation of irinotecan (m/z 587.3) and SN-38 (m/z 393.1), or SN-38G (m/z 569.2) and SN-38 (m/z 393.1) were insignificant with a correlation value lower than 0.1. Ion images reconstructed from MALDI-MSI results also indicate that SN-38 has distinct localization compared with irinotecan and SN-38G.
Figure 4.
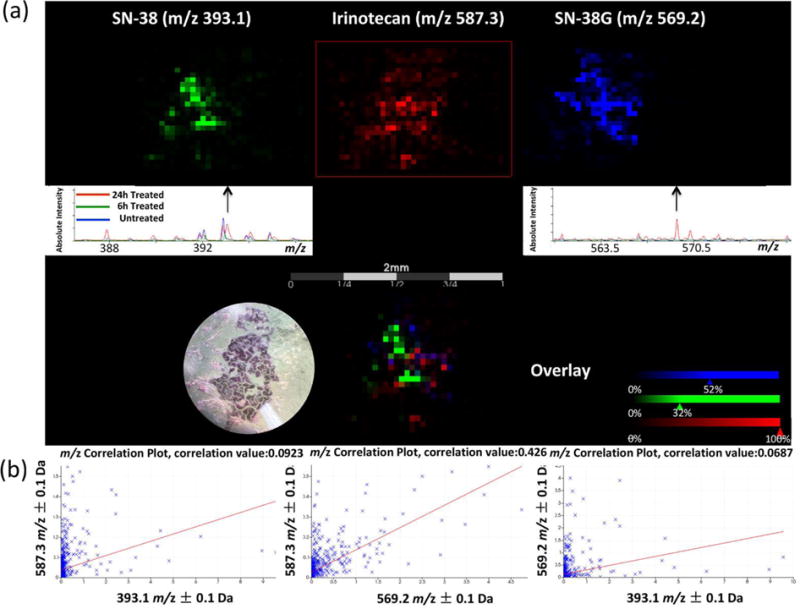
Localization of irinotecan and its metabolites in a 24 h treated CTO. (a) MALDI-MSI ion images and summed spectra of distribution of irinotecan (m/z 587.3), SN-38 (m/z 393.1), and SN-38G (m/z 569.2). (b) Correlation analysis to evaluate co-localization of irinotecan and its metabolites in the CTO. The left plot shows the correlation of irinotecan (m/z 587.3) and SN-38 (m/z 393.1). The middle plot shows the correlation of irinotecan (m/z 587.3) and SN-38G (m/z 569.2). The right plot shows the correlation of SN-38G (m/z 569.2) and SN-38 (m/z 393.1).
Irinotecan has weak pharmacological activity in vitro. It is activated to generate the metabolite SN-38 in vivo after enzymatic cleavage by carboxylesterases 1 and 2 (CES-1 and CES-2), predominantly in the liver but also at the tumor site12,41. Irinotecan and SN-38 also undergo extensive intracellular biotransformation yielding inactive metabolites. SN-38G is one of the inactive metabolites generated from SN-38 through phase II glucuronidation by UGTs 1A1, 1A6, 1A9 and 1A1041,42. Irinotecan and its metabolites are also regulated by extracellular efflux through transporters, including adenosine triphosphate-binding cassette transporter B1 (ABCB1), P-glycoprotein (MDR1), and multidrug resistance-related protein-2 (MRP2)43–45. Because CTOs contain multiple cell types including ISCs as well as further differentiated enterocytes, goblet cells, entero-endocrine cells, and Paneth cells16, irinotecan metabolism in these different cell types may be different, which could explain the distribution pattern of the parent drug and its metabolites observed by MALDI-MSI in this study. For example, recent immunohistochemical analyses indicate that the expression of CES-2 increases during differentiation of epithelial cells, with the highest expression observed in the surface epithelium, and diminished expression at the base of the crypt46. UGT proteins are found in all epithelial cells lining the colon47,48. It has been shown that non-tumorigenic differentiated cells expressing high level of drug efflux pump ABCA1 protect the tumor ISCs from irinotecan treatment45. The various expression levels of key enzymes and transporter proteins in different cell types related to irinotecan activation, inactivation, and clearance may contribute to the variable response to the drug treatment in different regions of the CTOs. In summary, these data demonstrate the time-dependent penetration and metabolism of irinotecan in 12620 CTOs.
Concentration dependent irinotecan uptake and metabolism in 12415 CTOs
To further study if irinotecan uptake and metabolism is concentration dependent, we treated 12415 CTOs, derived from a patient with a primary colon tumor, with 20 μM or 40 μM for 72 h, followed by MALDI-MSI analysis. Optical images of harvested CTOs that were embedded in gelatin are shown in Supplemental Figure 2.
To determine whether irinotecan uptake and metabolism is concentration dependent, we first examined mass spectra for ions related to irinotecan and its metabolites. Product ions produced in positive mode by tandem mass spectrometry collision-induced dissociation (MS/MS CID) confirmed the presence of the precursor ion irinotecan (m/z 587.3) and the IS (m/z 597.3) in treated CTOs sections (Supplemental Figure 3). ROC statistical analysis was performed to determine how well selected m/z values could be used to discriminate between the drug-treated and untreated samples. The area under the ROC curve (AUC value) represents the discrimination power for a variable. A perfect discrimination gives an AUC equal to 1 or 0. The closer the AUC is to 0.5, the less suitable the m/z value is to be used as a univariate criterion. In Supplemental Figure 4, the signals from irinotecan (m/z 587.3), SN-38 (m/z 393.1) and SN-38G (m/z 569.2) were found to be highly discriminating between treated and untreated CTOs (AUC value > 0.8). By contrast, the IS (m/z 597.3) was uniformly applied on both treated and untreated CTOs; it shows an AUC value of 0.535, indicating no significant signal difference between different conditions. The ion images and mass spectra in Figure 5a confirm the detection of the drug and metabolite molecules only in the treated CTOs. Signals from the IS also show good reproducibility among samples with different treatment conditions (Supplemental Figure 5).
Figure 5.
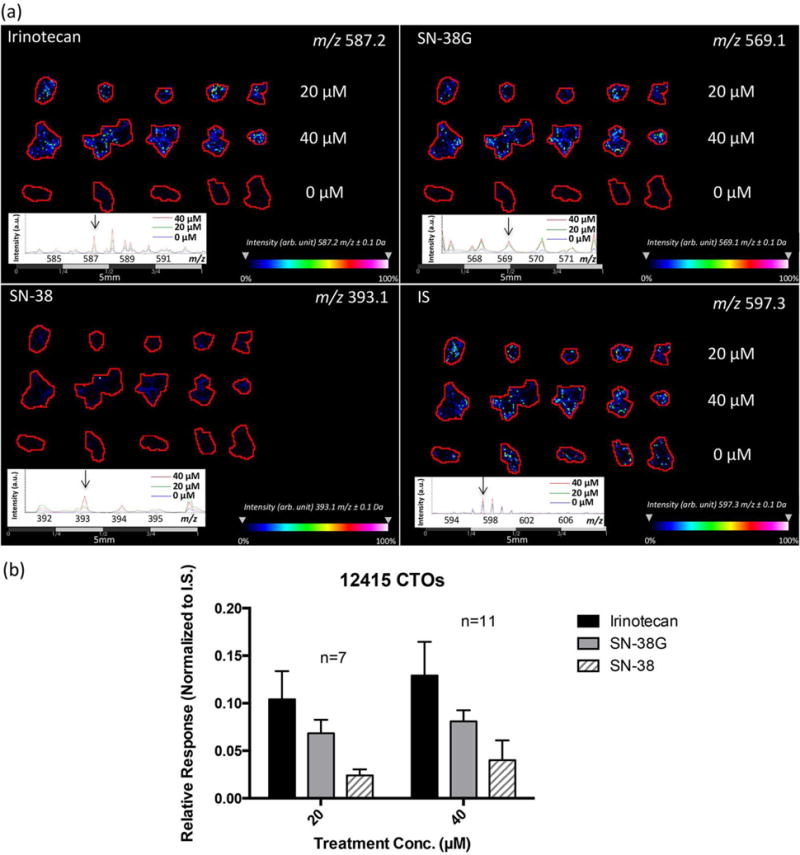
MALDI-MSI results of irinotecan treated CTOs at different concentrations for 72 h. (a) Ion density maps of irinotecan (m/z 587.2), SN-38 (m/z 393.1), SN-38G (m/z 569.1), and the IS (m/z 597.3) in 0 μM, 20 μM, and 40 μM drug treated CTOs. Irinotecan and its metabolites are only observed in the treated samples, but not in the control. (b) Relative quantification of irinotecan, SN-38, and SN-38G in treated CTOs.
We next examined the treated and untreated CTO samples to determine the relative quantification of irinotecan and its metabolites. Comparisons were made between different treatment conditions (Figure 5b & Supplemental Figure 6) and compared against the signal for the IS. We analyzed at least seven CTO replicates of these samples for each condition. A significant increase of normalized signal of total irinotecan related molecules (irinotecan, SN-38 and SN-38G) was observed in 40 μM treated CTOs compared to the 20 μM treated ones as compared to the IS, illustrating an elevated drug uptake and metabolism with increased amount of drug treatment. In addition, signal detected from SN-38 was much lower compared to the parent drug irinotecan, indicating the limited conversion of SN-38 from the prodrug. The ratio of SN-38G to SN-38 can also serve as a useful pharmacokinetic marker to help determine the treatment efficiency and the development of drug resistance to irinotecan.
To study the distribution pattern of irinotecan and its metabolites in the 12415 CTOs, irinotecan (m/z 587.2) and SN-38G (m/z 569.1) were found to be highly co-localized with a correlation value greater than 0.7 (p ≤ 0.05) as shown in Figure 6 & Supplemental Figure 7. By contrast, the correlation of irinotecan (m/z 587.2) and SN-38 (m/z 393.1) or SN-38G (m/z 569.1) and SN-38 (m/z 393.1) were insignificant with a value around 0.2. Ion maps confirm this distribution pattern, indicating that SN-38 has a different localization compared to irinotecan and SN-38G. In accordance with the drug distribution pattern found in the 12620 CTOs, these interesting results may be closely related to how different cell types within CTOs respond to drug treatment and will be further analyzed in future studies.
Figure 6.
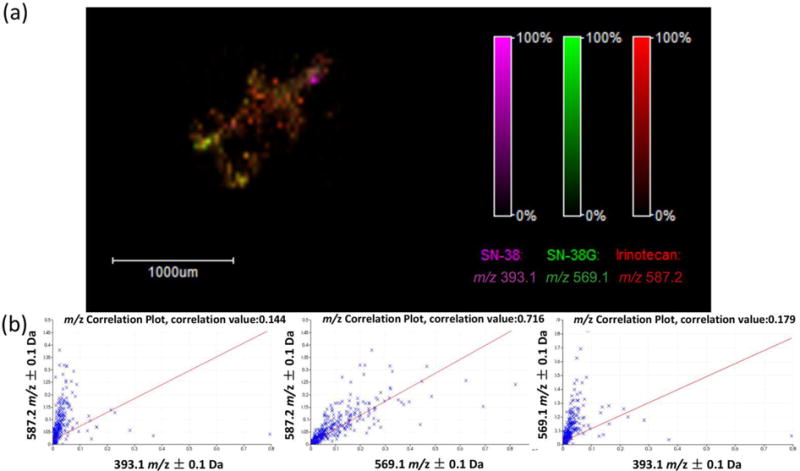
Distribution of irinotecan and its metabolites in a 72 h treated CTO (40 μM). (a) An overlay MALDI-MSI ion density map showing localization of irinotecan (m/z 587.2), SN-38 (m/z 393.1), and SN-38G (m/z 569.1). (b) Correlation analysis to evaluate co-localization of irinotecan and its metabolites in the CTO. The left plot shows the correlation of irinotecan (m/z 587.2) and SN-38 (m/z 393.1). The middle plot shows the correlation of irinotecan (m/z 587.2) and SN-38G (m/z 569.1). The right plot shows the correlation of SN-38G (m/z 569.1) and SN-38 (m/z 393.1).
Changes in CTOs cell proliferation following irinotecan treatment
To complement the mass spectrometric detection of irinotecan in the CTOs and to evaluate a phenotypic effect of drug treatment, immunofluorescence staining of the proliferation marker Ki-67 was performed (Figure 7a). The immunofluorescence staining pattern shows that untreated 12415 CTOs express Ki-67 predominantly in the outer region, while irinotecan-treated 12415 CTOs appear to have minimal Ki-67 staining, which is confirmed based on statistical analysis (Figure 7b), indicating the anti-proliferative effect of irinotecan. This result demonstrates that 12415 CTOs respond sensitively to irinotecan treatment, leading to a decrease in cell proliferation, which is in accordance with the detection of drug and its active metabolite in CTOs by MALDI-MSI.
Figure 7.
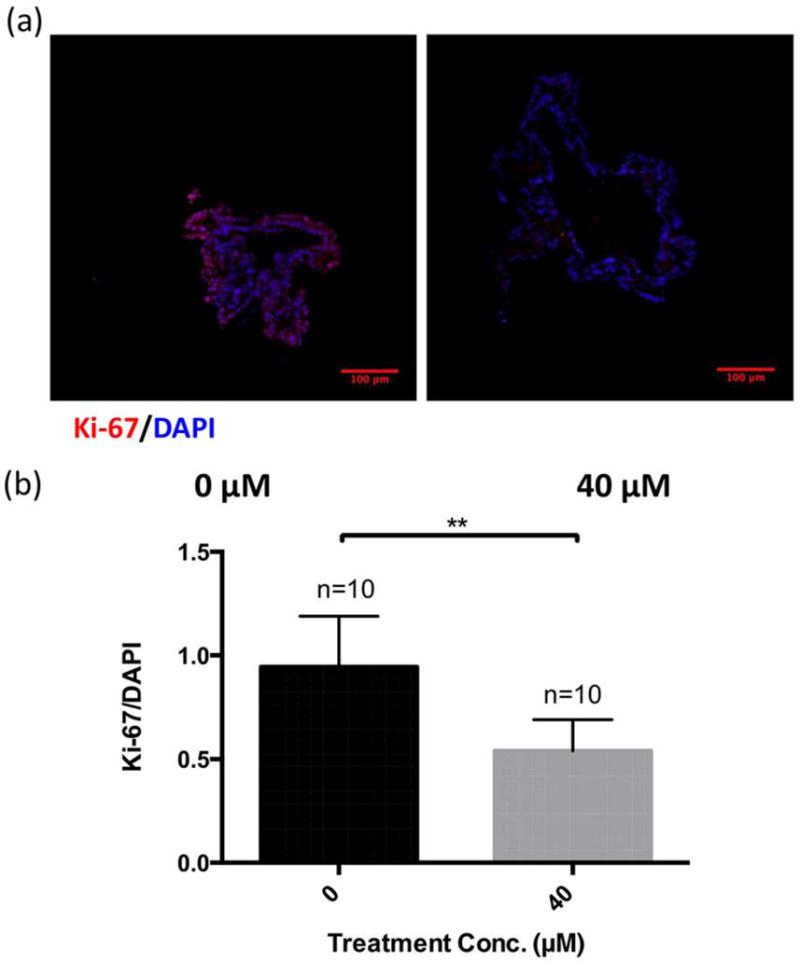
Immunofluorescence (IF) study of cell proliferation (marker Ki-67) in CTOs with and without irinotecan treatment. (a) Typical IF images showing localization of Ki-67 (red), and DAPI (blue) in 72 h treated and untreated CTOs (40 μM). (b) Statistical relative quantification of Ki-67 changes in CTOs following drug treatment. Optical sections were acquired at 2 μm intervals and stacked into a z-projection from which fluorescence intensity was calculated. Data were normalized to DAPI intensity. Student t-test was used to test the statistical significance. ** p<0.01.
CONCLUSIONS
Drug distribution within 3D biological model systems like CTOs is highly dependent on drug penetration, drug decay, and cellular uptake. Mapping the localization of a drug and its metabolites could significantly help in evaluation of the therapeutic response. In this study, by extending the MALDI-MSI technique in CTOs, we have successfully mapped irinotecan and its metabolites in both a treatment-time and concentration-dependent manner. This novel methodology would be useful to uncover the potential effects of different cell types in affecting drug distribution and metabolism within CTOs. It could also be used to compare inter-patient heterogeneity by analyzing CTOs derived from multiple patients, which would provide invaluable data for improvement of dosing regimens and could lead to personalized medicine recommendations.
Supplementary Material
Acknowledgments
We would like to thank the Mass Spectrometry and Proteomics Facility at the University of Notre Dame. This research was funded through a generous donation from Michael A. Patterson and family. ABH was supported by the National Institutes of Health (R01GM110406), and the National Science Foundation (CAREER Award, CHE-1351595). The UltrafleXtreme instrument (MALDI-TOF-TOF) was acquired through National Science Foundation award #1625944. We would like to express our deepest gratitude to the Stephenson family: Emmet, Toni and Tessa for the establishment of the Stephenson Family Personalized Medicine Center, which supports the generation and characterization of our patient-derived organoid biorepository. We would like to thank Erin Spiller for her efforts in establishing the patient-derived organoid model system in our laboratory.
References
- 1.Grantab R, Sivananthan S, Tannock IF. The Penetration of Anticancer Drugs through Tumor Tissue as a Function of Cellular Adhesion and Packing Density of Tumor Cells. Cancer Res. 2006:1033–1040. doi: 10.1158/0008-5472.CAN-05-3077. [DOI] [PubMed] [Google Scholar]
- 2.Kyle AH, Huxham LA, Yeoman DM, Minchinton AI. Limited Tissue Penetration of T axanes : A Mechanism for Resistance in Solid Tumors. Clin Cancer Res. 2007;13:2804–2811. doi: 10.1158/1078-0432.CCR-06-1941. [DOI] [PubMed] [Google Scholar]
- 3.Kyle AH, Huxham LA, Chiam ASJ, Sim DH, Minchinton AI. Direct Assessment of Drug Penetration into Tissue Using a Novel Application of Three-Dimensional Cell Culture. Cancer Res. 2004:6304–6309. doi: 10.1158/0008-5472.CAN-04-1099. [DOI] [PubMed] [Google Scholar]
- 4.Liu X, Hummon AB. Chemical Imaging of Platinum-Based Drugs and their Metabolites. Sci Rep. 2016:1–10. doi: 10.1038/srep38507. [DOI] [PMC free article] [PubMed] [Google Scholar]
- 5.Liu X, Weaver EM, Hummon AB. Evaluation of Therapeutics in Three-Dimensional Cell Culture Systems by MALDI Imaging Mass Spectrometry. Anal Chem. 2013;85:6295–6302. doi: 10.1021/ac400519c. [DOI] [PMC free article] [PubMed] [Google Scholar]
- 6.Lukowski JK, Weaver EM, Hummon AB. Analyzing Liposomal Drug Delivery Systems in Three-Dimensional Cell Culture Models Using MALDI Imaging Mass Spectrometry. Anal Chem. 2017 doi: 10.1021/acs.analchem.7b02006. [DOI] [PMC free article] [PubMed] [Google Scholar]
- 7.Weaver EM, Hummon AB, Keithley RB. Chemometric analysis of MALDI mass spectrometric images of three-dimensional cell culture systems. Anal Methods. 2015;7:7208–7219. doi: 10.1039/C5AY00293A. [DOI] [PMC free article] [PubMed] [Google Scholar]
- 8.LaBonia GJ, Lockwood SY, Heller AA, Spence DM, Hummon AB. Drug penetration and metabolism in 3D cell cultures treated in a 3D printed fluidic device : assessment of irinotecan via MALDI imaging mass spectrometry. Proteomics. 2016:1814–1821. doi: 10.1002/pmic.201500524. [DOI] [PMC free article] [PubMed] [Google Scholar]
- 9.Feist PE, Sidoli S, Liu X, Schroll MM, Rahmy S, Fujiwara R, Garcia BA, Hummon AB. Multicellular Tumor Spheroids Combined with Mass Spectrometric Histone Analysis To Evaluate Epigenetic Drugs. Anal Chem. 2017 doi: 10.1021/acs.analchem.6b03602. [DOI] [PMC free article] [PubMed] [Google Scholar]
- 10.Ahlf DR, Masyuko RN, Hummon AB, Bohn PW. Correlated mass spectrometry imaging and confocal Raman microscopy for studies of three-dimensional cell culture sections †. Analyst. 2014;139:4578–4585. doi: 10.1039/c4an00826j. [DOI] [PubMed] [Google Scholar]
- 11.Ahlf Wheatcraft DR, Liu X, Hummon AB. Sample Preparation Strategies for Mass Spectrometry Imaging of 3D Cell Culture Models. J Vis Exp. 2014:3–9. doi: 10.3791/52313. [DOI] [PMC free article] [PubMed] [Google Scholar]
- 12.Iyer L, King CD, Whitington PF, Green MD, Roy SK, Tephly TR, Coffman BL, Ratain MJ. Genetic predisposition to the metabolism of irinotecan (CPT-11). Role of uridine diphosphate glucuronosyltransferase isoform 1A1 in the glucuronidation of its active metabolite (SN-38) in human liver microsomes. J Clin Invest. 1998:847–854. doi: 10.1172/JCI915. [DOI] [PMC free article] [PubMed] [Google Scholar]
- 13.Däster S, et al. Induction of hypoxia and necrosis in multicellular tumor spheroids is associated with resistance to chemotherapy treatment. Oncotarget. 2017;8:1725–1736. doi: 10.18632/oncotarget.13857. [DOI] [PMC free article] [PubMed] [Google Scholar]
- 14.Senkowski W, Zhang X, Olofsson MH, Isacson R, Höglund U, Gustafsson M, Nygren P, Linder S, Larsson R, Fryknäs M. Three-Dimensional Cell Culture-Based Screening Identifies the Anthelmintic Drug Nitazoxanide as a Candidate for Treatment of Colorectal Cancer. Mol Cancer Ther. 2015;14 doi: 10.1158/1535-7163.MCT-14-0792. [DOI] [PubMed] [Google Scholar]
- 15.Liang X, Xu X, Wang F, Chen X, Li N, Wang C, He J. E-cadherin knockdown increases β-catenin reducing colorectal cancer chemosensitivity only in three-dimensional cultures. Int J Oncol. 2015:1517–1527. doi: 10.3892/ijo.2015.3137. [DOI] [PubMed] [Google Scholar]
- 16.Sato T, Stange DE, Ferrante M, Vries RG, Van Es JH, Van Den Brink S, Van Houdt WJ, Pronk A, Van Gorp J, Siersema PD, Clevers H. Long-term Expansion of Epithelial Organoids From Human Colon, Adenoma, Adenocarcinoma, and Barrett’s Epithelium. Gastroenterology. 2011;141:1762–1772. doi: 10.1053/j.gastro.2011.07.050. [DOI] [PubMed] [Google Scholar]
- 17.Rodríguez-Colman MJ, Schewe M, Meerlo M, Stigter E, Gerrits J, Pras-Raves M, Sacchetti A, Hornsveld M, Oost KC, Snippert HJ, Verhoeven-Duif N. Interplay between metabolic identities in the intestinal crypt supports stem cell function. Nature. 2017 doi: 10.1038/nature21673. [DOI] [PubMed] [Google Scholar]
- 18.Shimokawa M, Ohta Y, Nishikori S, Matano M, Takano A, Fujii M, Date S, Sugimoto S, Kanai T, Sato T. Visualization and targeting of LGR5+ human colon cancer stem cells. Nature. 2017;545:187–192. doi: 10.1038/nature22081. [DOI] [PubMed] [Google Scholar]
- 19.e Melo FDS, Kurtova AV, Harnoss JM, Kljavin N, Hoeck JD, Hung J, Anderson JE, Storm EE, Modrusan Z, Koeppen H, Dijkgraaf GJ. A distinct role for Lgr5 + stem cells in primary and metastatic colon cancer. Nature. 2017;543:676–680. doi: 10.1038/nature21713. [DOI] [PubMed] [Google Scholar]
- 20.Beyaz S, Mana MD, Roper J, Kedrin D, Saadatpour A, Hong SJ, Bauer-Rowe KE, Xifaras ME, Akkad A, Arias E, Pinello L. High fat diet enhances stemness and tumorigenicity of intestinal progenitors. Nature. 2016;531:53–58. doi: 10.1038/nature17173. [DOI] [PMC free article] [PubMed] [Google Scholar]
- 21.Barretina J, Caponigro G, Stransky N, Venkatesan K, Margolin AA, Kim S, Wilson CJ, Lehár J, Kryukov GV, Sonkin D, Reddy A. The Cancer Cell Line Encyclopedia enables predictive modelling of anticancer drug sensitivity. Nature. 2012:7–12. doi: 10.1038/nature11003. [DOI] [PMC free article] [PubMed] [Google Scholar]
- 22.Mouradov D, Sloggett C, Jorissen RN, Love CG, Li S, Burgess AW, Arango D, Strausberg RL, Buchanan D, Wormald S, O’Connor L. Colorectal Cancer Cell Lines Are Representative Models of the Main Molecular Subtypes of Primary Cancer. Cancer Res. 2014;74:3238–3248. doi: 10.1158/0008-5472.CAN-14-0013. [DOI] [PubMed] [Google Scholar]
- 23.Fujii M, Shimokawa M, Date S, Takano A, Matano M, Nanki, Ohta Y, Toshimitsu K, Nakazato Y, Kawasaki K, Uraoka T. A Colorectal Tumor Organoid Library Demonstrates Progressive Loss of Niche Factor Requirements during Tumorigenesis. Cell Stem Cell. 2016;18:827–838. doi: 10.1016/j.stem.2016.04.003. [DOI] [PubMed] [Google Scholar]
- 24.Ertel A, Verghese A, Byers SW, Ochs M, Tozeren A. Pathway-specific differences between tumor cell lines and normal and tumor tissue cells. Mol Cancer. 2006;13 doi: 10.1186/1476-4598-5-55. [DOI] [PMC free article] [PubMed] [Google Scholar]
- 25.Sandberg R, Ernberg I. The molecular portrait of in vitro growth by meta-analysis of gene-expression profiles. Genome Biol. 2005;6:1–15. doi: 10.1186/gb-2005-6-8-r65. [DOI] [PMC free article] [PubMed] [Google Scholar]
- 26.Walsh AJ, Castellanos JA, Nagathihalli NS, Merchant NB, Skala MC. Optical Imaging of Drug-Induced Metabolism Changes in Murine and Human Pancreatic Cancer Organoids Reveals Heterogeneous Drug Response. Pancreas. 2016;45:863–9. doi: 10.1097/MPA.0000000000000543. [DOI] [PMC free article] [PubMed] [Google Scholar]
- 27.Walsh AJ, Cook RS, Sanders ME, Aurisicchio L, Ciliberto G, Arteaga CL, Skala MC. Quantitative optical imaging of primary tumor organoid metabolism predicts drug response in breast cancer. Cancer Res. 2014;74:5184–5194. doi: 10.1158/0008-5472.CAN-14-0663. [DOI] [PMC free article] [PubMed] [Google Scholar]
- 28.Walsh AJ, Cook RS, Skala MC. Functional Optical Imaging of Primary Human Tumor Organoids for Personalized Drug Screens. J Nucl Med jnumed. 2017;117:192534. doi: 10.2967/jnumed.117.192534. [DOI] [PubMed] [Google Scholar]
- 29.Cheung KJ, Gabrielson E, Werb Z, Ewald AJ. Collective invasion in breast cancer requires a conserved basal epithelial program. Cell. 2013;155:1639–1651. doi: 10.1016/j.cell.2013.11.029. [DOI] [PMC free article] [PubMed] [Google Scholar]
- 30.Zhao Y, Jin Y, Hanson A, Wu M, Zhao JX. Three-Dimensional Molecular Imaging with Photothermal Optical Coherence Tomography. NanoBiotechnology Protoc. 2013;1026:187–194. doi: 10.1007/978-1-62703-468-5_7. [DOI] [PMC free article] [PubMed] [Google Scholar]
- 31.Kuo WT, Lee TC, Yang HY, Chen CY, Au YC, Lu YZ, Wu LL, Wei SC, Ni YH, Lin BR, Chen Y. LPS receptor subunits have antagonistic roles in epithelial apoptosis and colonic carcinogenesis. Cell Death Differ. 2015:1590–1604. doi: 10.1038/cdd.2014.240. [DOI] [PMC free article] [PubMed] [Google Scholar]
- 32.Shah AT, Heaster TM, Skala MC. Metabolic imaging of head and neck cancer organoids. PLoS One. 2017;12:1–17. doi: 10.1371/journal.pone.0170415. [DOI] [PMC free article] [PubMed] [Google Scholar]
- 33.Walsh AJ, Cook RS, Manning HC, Hicks DJ, Lafontant A, Arteaga CL, Skala MC. Optical metabolic imaging identifies glycolytic levels, subtypes, and early-treatment response in breast cancer. Cancer Res. 2013;73:6164–6174. doi: 10.1158/0008-5472.CAN-13-0527. [DOI] [PMC free article] [PubMed] [Google Scholar]
- 34.Walsh AJ, Cook RS, Sanders ME, Arteaga CL, Skala MC. Drug response in organoids generated from frozen primary tumor tissues. Sci Rep. 2016;6:18889. doi: 10.1038/srep18889. [DOI] [PMC free article] [PubMed] [Google Scholar]
- 35.van de Wetering M, Francies HE, Francis JM, Bounova G, Iorio F, Pronk A, van Houdt W, van Gorp J, Taylor-Weiner A, Kester L, McLaren-Douglas A. Prospective derivation of a living organoid biobank of colorectal cancer patients. Cell. 2015;161:933–945. doi: 10.1016/j.cell.2015.03.053. [DOI] [PMC free article] [PubMed] [Google Scholar]
- 36.Buck A, Halbritter S, Späth C, Feuchtinger A, Aichler M, Zitzelsberger H, Janssen KP, Walch A. Distribution and quantification of irinotecan and its active metabolite SN-38 in colon cancer murine model systems using MALDI MSI. Anal Bioanal Chem. 2015:2107–2116. doi: 10.1007/s00216-014-8237-2. [DOI] [PubMed] [Google Scholar]
- 37.Alexandrov T, Becker M, Deininger SO, Ernst G, Wehder L, Grasmair M, von Eggeling F, Thiele H, Maass P. Spatial Segmentation of Imaging Mass Spectrometry Data with Edge-Preserving Image Denoising and Clustering. J Proteome Res. 2010:6535–6546. doi: 10.1021/pr100734z. [DOI] [PubMed] [Google Scholar]
- 38.Alexandrov T, Becker M, Guntinas-Lichius O, Ernst G, von Eggeling F. MALDI-imaging segmentation is a powerful tool for spatial functional proteomic analysis of human larynx carcinoma. J Cancer Res Clin Oncol. 2013:85–95. doi: 10.1007/s00432-012-1303-2. [DOI] [PubMed] [Google Scholar]
- 39.Weaver EM, Hummon AB. Imaging mass spectrometry: From tissue sections to cell cultures. Adv Drug Deliv Rev. 2013;65:1039–1055. doi: 10.1016/j.addr.2013.03.006. [DOI] [PubMed] [Google Scholar]
- 40.Liu X, Hummon AB. Mass Spectrometry Imaging of Therapeutics from Animal Models to Three-Dimensional Cell Cultures. Anal Chem. 2015;87:9508–9519. doi: 10.1021/acs.analchem.5b00419. [DOI] [PMC free article] [PubMed] [Google Scholar]
- 41.Raynal C, Pascussi JM, Leguelinel G, Breuker C, Kantar J, Lallemant B, Poujol S, Bonnans C, Joubert D, Hollande F, Lumbroso S. Pregnane × Receptor (PXR) expression in colorectal cancer cells restricts irinotecan chemosensitivity through enhanced SN-38 glucuronidation. Mol Cancer. 2010:1–13. doi: 10.1186/1476-4598-9-46. [DOI] [PMC free article] [PubMed] [Google Scholar]
- 42.Mathijssen RH, Van Alphen RJ, Verweij J, Loos WJ, Nooter K, Stoter G, Sparreboom A. Clinical Pharmacokinetics and Metabolism of Irinotecan (CPT-11) Clin Cancer Res. 2001;7:2182–2194. [PubMed] [Google Scholar]
- 43.Candeil L, Gourdier I, Peyron D, Vezzio N, Copois V, Bibeau F, Orsetti B, Scheffer GL, Ychou M, Khan QA, Pommier Y. ABCG2 overexpression in colon cancer cells resistant to SN38 and in irinotecan‐treated metastases. Int J Cancer. doi: 10.1002/ijc.20032. [DOI] [PubMed] [Google Scholar]
- 44.Jansen WJ, Hulscher TM, van Ark-Otte J, Giaccone G, Pinedo HM, Boven E. CPT-11 sensitivity in relation to the expression of P170-glycoprotein and multidrug resistance-associated protein. Br J Cancer. 1998;77:359–365. doi: 10.1038/bjc.1998.58. [DOI] [PMC free article] [PubMed] [Google Scholar]
- 45.Emmink BL, Van Houdt WJ, Vries RG, Hoogwater FJ, Govaert KM, Verheem A, Nijkamp MW, Steller EJ, Jimenez CR, Clevers H, Rinkes IHB. Differentiated Human Colorectal Cancer Cells Protect Tumor-Initiating Cells From Irinotecan. Gastroenterology. 2011;141:269–278. doi: 10.1053/j.gastro.2011.03.052. [DOI] [PubMed] [Google Scholar]
- 46.Kühl AA, Erben U, Cieluch C, Spieckermann S, Gröne J, Lohneis P, Pape UF, Arsenic R, Utku N. Tissue-infiltrating plasma cells are an important source of carboxylesterase 2 contributing to the therapeutic efficacy of prodrugs. Cancer Lett. 2016;378:51–58. doi: 10.1016/j.canlet.2016.04.041. [DOI] [PubMed] [Google Scholar]
- 47.Kobayashi T, Yokota H, Ohgiya S, Iwano H, Yuasa A. UDP-glucuronosyltransferase UGT1A7 induced in rat small intestinal mucosa by oral administration of 2-naphthoflavone. FEBS J. 955:948–955. doi: 10.1046/j.1432-1327.1998.2580948.x. [DOI] [PubMed] [Google Scholar]
- 48.Peters WH, Allebes WA, Jansen PL, Poels LG, Capel PJ. Characterization and Tissue Specificity of a Monoclonal Antibody Against Human Uridine V-Diphosphate-Glucuronosyltransferase. Gastroenterology. 1987:162–169. doi: 10.1016/0016-5085(87)90329-5. [DOI] [PubMed] [Google Scholar]
Associated Data
This section collects any data citations, data availability statements, or supplementary materials included in this article.


