Abstract
Introduction
Evaluation of the nerve fascicular structure can be useful in diagnosing nerve damage, but it is a very challenging task with 3T MRI due to limited resolution. In this pilot study, we present the feasibility of high-resolution 7T MRI for examining the nerve fascicular structure.
Methods
A 3D gradient-spoiled sequence was used for imaging peripheral nerves in extremities. Images acquired with different in-plane resolutions (0.42 × 0.42mm vs. 0.12 × 0.12mm), and different main field strengths (7T vs. 3T) were compared.
Results
The individual nerve fascicles were identified at 0.12 × 0.12mm resolution in both field strengths, but not at 0.42 × 0.42mm resolution. The fascicular structure was more sharply depicted in 7T images than in 3T images.
Discussion
High-resolution 3D imaging with 7T MRI demonstrated feasibility in imaging nerve fascicular structures.
Keywords: Peripheral nerves, fascicles, nerve injury, 7T MRI, 3D imaging, neurography
Introduction
Magnetic resonance imaging (MRI) of peripheral nerves has been increasingly used to diagnose a variety of peripheral nerve diseases1–9. The high spatial resolution and excellent soft-tissue contrast of MRI facilitates identification of structural nerve abnormalities caused by traumatic injury or repetitive stress2,3,8,10. The fluid sensitivity of MRI provides detection of edema in nerves, potentially caused by various pathologic mechanisms including inflammation11, ischemia12,13, and autoimmune disease14,15. Quantitative mapping of diffusion, T2, and magnetization transfer demonstrated promising results in monitoring nerve degeneration9,16,17.
MRI evaluation of nerve fascicular structures, however, has not been reliable due to the limited resolution on the widely used 1.5T or 3T MRI scanners. High-resolution ultrasound imaging showed evaluation of nerve fascicles could improve preoperative planning18 or identification of nerve pathology19. Examining the severity of fascicular structure disruption may help to justify the necessity of surgery for traumatic injury20,21. Ultra-high-resolution MRI with in-plane resolution of about 100um22–24 has the potential to further improve the visualization of nerve fascicles. However, thorough in-vivo human studies have not been conducted.
In this report, we investigated the feasibility of ultra-high-resolution 3D gradient-spoiled MRI at 7T for visualizing nerve fascicular structures in human extremities. 7T has the potential for higher resolution than 3T due to the signal boost with higher proton polarization, but faster signal decay and limited availability of coils may restrict the achievable resolution. We compared 7T and 3T images to verify the improvement of nerve visualization at 7T.
Methods
Experiment Overview
To compare structural details at different resolutions, we acquired images of the tibial nerve at the ankle with different resolutions. Next, we compared the depiction of nerves in different extremities on ultra-high-resolution images at 3T and 7T. For imaging, we used a 3D gradient-spoiled sequence25. We tested four different flip angles (5°, 10°, 15°, 20°) at 3T and 7T to determine the flip angle yielding the highest signal-to-noise-ratio (SNR) in the nerve region with the minimum repetition time (TR). 10° produced the highest SNR at both 7T and 3T, and was adopted for all experiments. The two-point Dixon method26 was employed to obtain water-only nerve images. Imaging was conducted on a GE 7T Discovery MR950 scanner and a GE 3T Discovery MR750 scanner (GE Healthcare, Waukesha, USA). All volunteers signed an informed consent form approved by the institutional review board.
Resolution comparison for a human tibial nerve
We performed axial scans of a healthy volunteer’s ankle with two different in-plane resolutions (0.12x0.12x2mm and 0.42x0.42x2mm) at 7T with a 3-inch surface receive coil, and compared the structural details of the tibial nerve in the reconstructed images. The scan parameters were as follows: TR = 20.6ms, echo time (TE) = 8.4ms (high resolution), 3.1ms (low resolution), field-of-view (FOV) = 8x6.4x7.2cm, acquisition matrix = 672x538x36 (high resolution), 192x154x36 (low resolution), bandwidth = ±31.25KHz.
3T imaging and 7T high-resolution imaging comparison
We performed axial scans of three healthy volunteers to image peripheral nerves at ankle, foot, and finger at both fields. 7T and 3T scans were done on the same day to facilitate imaging the same volume between scans. The sequence parameters were as follows. Common parameters: flip angle = 10°, bandwidth = ±31.25KHz. Ankle scan (7T/3T): TR = 21.0ms, TE = 8.4ms, FOV = 8x6.4x7.2cm, acquisition matrix = 672x538x36, receive coil = (3-inch surface coil / 16-channel small flex coil). Foot scan (7T/3T): TR = 18.7ms/19.2ms, TE = 9.3ms/9.5ms, FOV = 8x6.4x5.4cm, acquisition matrix = 640 × 512 × 36, receive coil = 3-inch surface coil. Finger scan (7T/3T): TR = 19.6ms, TE = 9.1ms/9.5ms, FOV = 8x6.4x7.5cm, acquisition matrix = 640x512x50, receive coil = 3-inch surface coil. The scan time was about 13 minutes for the ankle and finger scans, and about 16 minutes for the foot scan. The scan times at 7T and 3T were the same except the foot scan where the 3T scan was about 30 seconds longer.
Between the 7T and 3T images, we visually compared the sharpness of the nerve fascicles and the SNR of areas in the tibial nerve (ankle), the proper plantar digital neurovascular bundle (foot), and the proper palmar digital neurovascular bundle (finger). The SNR was calculated as the ratio of the mean signal amplitude in the nerve region over the standard deviation of the signal amplitude in the empty background. For the sum-of-squares composite image acquired with a multi-channel coil system, this SNR calculation provides a moderately accurate estimate with slight overestimation27.
Results
High-resolution and low-resolution image comparison for a human tibial nerve
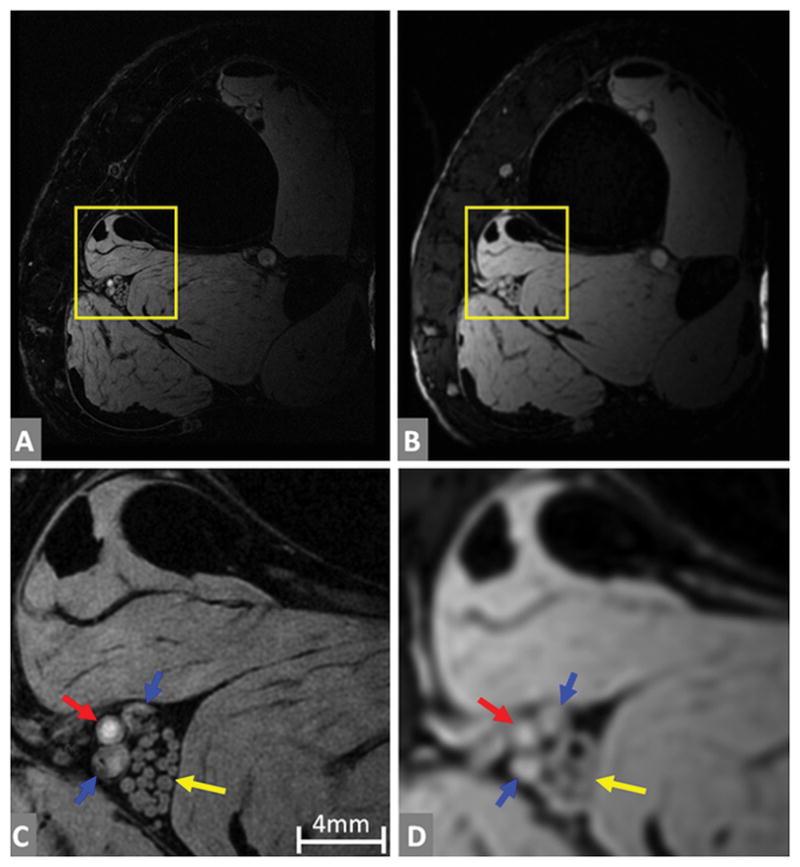
Figure 1A and 1B show 7T axial ankle images containing the tibial nerve in high resolution (0.12mm) and low resolution (0.42mm), respectively. The fascicles are clearly visualized with 0.12mm resolution (Figure 1C), but not with 0.42mm resolution (Figure 1D). The differences between the tibial nerve, posterior tibial artery, and veins become more prominent with high resolution.
Figure 1.

The fascicles of the tibial nerve at high resolution (0.12mm) and low resolution (0.42mm) at 7T. (A) and (B) are full slice images, while (C) and (D) are enlarged versions of the yellow boxes in (A) and (B) respectively. The tibial nerve fascicles are a bundle of nerve fibers marked by yellow arrows in (C) and (D). Individual fascicles are clearly identified at high resolution (C), but not so in low resolution (D). Posterior tibial artery is marked by the red arrow and posterior tibial veins are marked by the blue arrows.
3T imaging and 7T imaging comparison
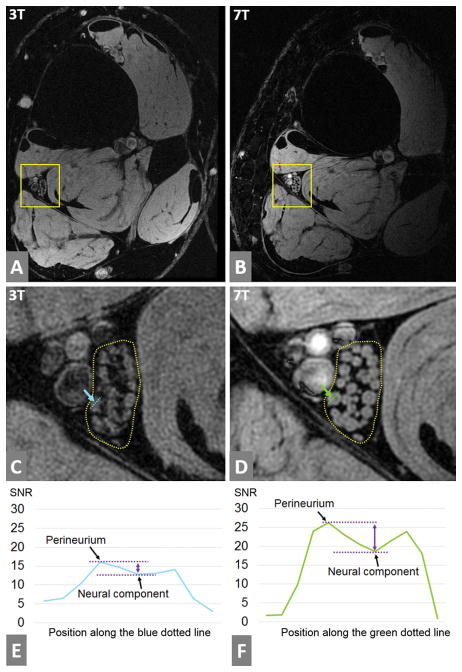
3T and 7T ankle images are illustrated in Figure 2A and 2B. Delineation of the tibial nerve fascicles was much sharper at 7T (Figure 2D) than 3T (Figure 2C), and the perineurium of each fascicle was more clearly identified at 7T. The SNR of the nerve region at 3T image was 10, while that of the 7T image was 15. Figure 2E and 2F show the signal profile of a single fascicle normalized by the noise standard deviation. The contrast-to-noise-ratio (CNR) between the perineurium and the neural component was higher at 7T (7.6 vs 3.1).
Figure 2.
The fascicles of the tibial nerve at high resolution (0.13mm) images acquired at 3T and 7T. (A) and (B) are full slice images at 3T and 7T respectively. (C) is the enlarged version of the yellow box in (A) to show the tibial nerve in detail, while (D) is the enlarged for (B). Tibial nerve fascicles are enclosed in a dotted line in (C) and (D), and they are more sharply presented at 7T than 3T. Also, the perineurium (the bright rim of each fascicle) is more easily identified at 7T than 3T. A single fascicle is marked by a blue dotted line in (C) and by a green dotted line in (D). The signal amplitude was sampled along those lines, and was plotted in (E) and (F) after normalization by the noise standard deviation of each image. The left and right peaks of the signal in each plot correspond to the perineurium. The distance between the two purple dotted lines corresponds to the contrast-to-noise-ratio (CNR) between the perineurium and the neural component inside the perineurium. The CNR was 3.1 at the 3T and 7.6 at the 7T.
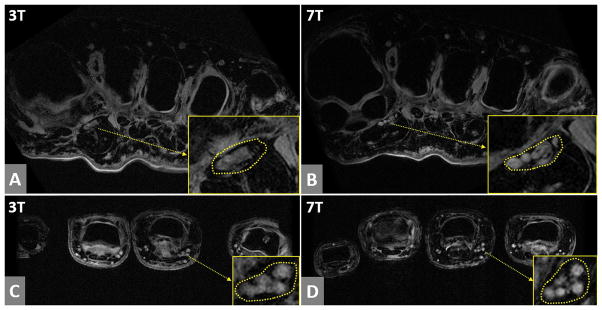
Axial foot images in Figure 3A (3T) and 3B (7T) demonstrate that the proper plantar digital nerves and blood vessels are more sharply depicted at 7T than 3T. The SNR of the nerve region was 22 in the 7T image and 12 in the 3T image. Axial finger images in Figure 3C (3T) and 3D (7T) show that the proper palmer digital neurovascular bundle is delineated more sharply at 7T. The SNR of the 7T image in the nerve area was 21, compared to 14 in the 3T image.
Figure 3.
The axial foot images and axial finger images at 3T and 7T. (A) and (B) are foot images at 3T and 7T respectively, and (C) and (D) are finger images at 3T and 7T respectively. In the yellow boxes in (A) and (B), the area of proper plantar digital neurovascular bundle is enlarged. In the yellow boxes in (C) and (D), the area of proper palmer digital neurovascular bundle is enlarged. In both foot and finger cases, 7T images show much sharper delineation of nerves and blood vessels than 3T images.
Discussion
Our study demonstrated that high-resolution imaging is advantageous for examining nerve fascicles. Our 7T and 3T image comparison showed much sharper delineation of nerve structures at 7T. We believe that the SNR improvements (50%/83%/50% for ankle/foot/finger cases) at 7T could be the major reason for the clearer visualization. The SNR improvement at 7T is not as large as the gain in the proton polarization (2.3 times larger than that of 3T). This may be because of the signal reduction due to increased B0/B1 field inhomogeneity and the ineffective signal reception with a single-channel coil.
One limitation of our imaging approach is that the nerves and vessels are not well differentiated as shown in the finger and foot images. Prep-pulse schemes28,29 may resolve this nerve-vessel ambiguity. We occasionally observed ghosting artifacts of the blood vessels due to pulsatile blood flow, regardless of the field strength or resolution. Another limitation is the long scan time due to multi-echo acquisitions for water-fat separation. Employing water-selective excitation can be a faster alternative for fat-suppression. Enabling parallel imaging with a development of a multi-channel receive coil for 7T can be another solution for imaging acceleration.
With current 3T MRI, the understanding of the in-vivo morphology of nerve fascicles has been limited because of insufficient SNR to obtain the necessary spatial resolution. Few reports have been published regarding the number, size, shape, and signal intensity of fascicles or perineurium for peripheral nerve disease with 3T MRI. Improving SNR with lengthening scan time may not be a practical solution, considering the current scan time (13~16 minutes). Our 7T MRI results show the feasibility of in-vivo examination of the nerve microstructures, offering a new opportunity to investigate structural abnormalities in nerve fascicles. For example, traumatic nerve injury or neuroma-in-continuity would be good imaging targets for studying microstructural damage with the proposed approach.
We used the SNR of nerve regions as an objective measure to complement the visual comparison of nerve structures in 3T and 7T images, but the SNR measurement may have some imperfections. First, it is challenging to image the same volume in 3T and 7T scanners even with MR-visible markers for registration. Second, the receive-coils available at 3T and 7T scanners may not provide the same SNR. However, from the clinical point of view, achieving the best image quality possible with existing coils may outweigh comparing the images acquired with coils of equal performance. Therefore, radiologist-scoring of the image quality obtained with the best technology available at each field strength may be an alternative approach for comparing images at 3T and 7T.
Conclusion
We demonstrated the feasibility of imaging nerve fascicular structures with 7T high-resolution MRI and the improved visualization with higher SNR compared with 3T. Our 7T high-resolution MRI results show promise for enhancing diagnosis of peripheral nerve disorders.
Acknowledgments
grant supports from NIH P41 EB015891, NIH R01 AR0063643, GE Healthcare
Abbreviations
- CNR
Contrast-to-Noise-Ratio
- FOV
Field-Of-View
- MRI
Magnetic Resonance Imaging
- SNR
Signal-to-Noise-Ratio
- TE
Echo Time
- TR
Repetition Time
Footnotes
Ethical Publication Statement: We confirm that we have read the Journal’s position on issues involved in ethical publication and affirm that this report is consistent with those guidelines.
Disclosure of Conflicts of Interest: None of the authors has any conflict of interest to disclose.
References
- 1.Aagaard BD, Maravilla KR, Kliot M. MR neurography. MR imaging of peripheral nerves. Magn Reson Imaging Clin N Am. 1998;6:179–194. [PubMed] [Google Scholar]
- 2.Chhabra A, Williams EH, Wang KC, Dellon AL, Carrino JA. MR neurography of neuromas related to nerve injury and entrapment with surgical correlation. AJNR Am J Neuroradiol. 2010;31:1363–1368. doi: 10.3174/ajnr.A2002. [DOI] [PMC free article] [PubMed] [Google Scholar]
- 3.Cudlip SA, Howe FA, Griffiths JR, Bell BA. Magnetic resonance neurography of peripheral nerve following experimental crush injury, and correlation with functional deficit. J Neurosurg. 2002;96:755–759. doi: 10.3171/jns.2002.96.4.0755. [DOI] [PubMed] [Google Scholar]
- 4.Dailey AT, Tsuruda JS, Filler AG, Maravilla KR, Goodkin R, Kliot M. Magnetic resonance neurography of peripheral nerve degeneration and regeneration. Lancet. 1997;350:1221–1222. doi: 10.1016/S0140-6736(97)24043-2. [DOI] [PubMed] [Google Scholar]
- 5.Dailey AT, Tsuruda JS, Goodkin R, et al. Magnetic resonance neurography for cervical radiculopathy: a preliminary report. Neurosurgery. 1996;38:488–492. doi: 10.1097/00006123-199603000-00013. discussion 492. [DOI] [PubMed] [Google Scholar]
- 6.Du R, Auguste KI, Chin CT, Engstrom JW, Weinstein PR. Magnetic resonance neurography for the evaluation of peripheral nerve, brachial plexus, and nerve root disorders. J Neurosurg. 2010;112:362–371. doi: 10.3171/2009.7.JNS09414. [DOI] [PubMed] [Google Scholar]
- 7.Howe FA, Filler AG, Bell BA, Griffiths JR. Magnetic resonance neurography. Magn Reson Med. 1992;28:328–338. doi: 10.1002/mrm.1910280215. [DOI] [PubMed] [Google Scholar]
- 8.Britz GW, Haynor DR, Kuntz C, et al. Ulnar nerve entrapment at the elbow: correlation of magnetic resonance imaging, clinical, electrodiagnostic, and intraoperative findings. Neurosurgery. 1996;38:458–465. doi: 10.1097/00006123-199603000-00007. discussion 465. [DOI] [PubMed] [Google Scholar]
- 9.Lehmann HC, Zhang J, Mori S, Sheikh KA. Diffusion tensor imaging to assess axonal regeneration in peripheral nerves. Exp Neurol. 2010;223:238–244. doi: 10.1016/j.expneurol.2009.10.012. [DOI] [PMC free article] [PubMed] [Google Scholar]
- 10.Mitchell CH, Brushart TM, Ahlawat S, Belzberg AJ, Carrino JA, Fayad LM. MRI of sports-related peripheral nerve injuries. AJR Am J Roentgenol. 2014;203:1075–1084. doi: 10.2214/AJR.13.12183. [DOI] [PubMed] [Google Scholar]
- 11.Dimachkie MM, Barohn RJ. Chronic inflammatory demyelinating polyneuropathy. Curr Treat Options Neurol. 2013;15:350–366. doi: 10.1007/s11940-013-0229-6. [DOI] [PMC free article] [PubMed] [Google Scholar]
- 12.Rizzo JF, 3rd, Andreoli CM, Rabinov JD. Use of magnetic resonance imaging to differentiate optic neuritis and nonarteritic anterior ischemic optic neuropathy. Ophthalmology. 2002;109:1679–1684. doi: 10.1016/s0161-6420(02)01148-x. [DOI] [PubMed] [Google Scholar]
- 13.Thakkar RS, Del Grande F, Thawait GK, Andreisek G, Carrino JA, Chhabra A. Spectrum of high-resolution MRI findings in diabetic neuropathy. AJR Am J Roentgenol. 2012;199:407–412. doi: 10.2214/AJR.11.7893. [DOI] [PubMed] [Google Scholar]
- 14.Fontes CA, Dos Santos AA, Marchiori E. Magnetic resonance imaging findings in Guillain-Barre syndrome caused by Zika virus infection. Neuroradiology. 2016;58:837–838. doi: 10.1007/s00234-016-1687-9. [DOI] [PubMed] [Google Scholar]
- 15.Alkan O, Yildirim T, Tokmak N, Tan M. Spinal MRI findings of guillain-barre syndrome. J Radiol Case Rep. 2009;3:25–28. doi: 10.3941/jrcr.v3i3.153. [DOI] [PMC free article] [PubMed] [Google Scholar]
- 16.Webb S, Munro CA, Midha R, Stanisz GJ. Is multicomponent T2 a good measure of myelin content in peripheral nerve? Magn Reson Med. 2003;49:638–645. doi: 10.1002/mrm.10411. [DOI] [PubMed] [Google Scholar]
- 17.Dortch RD, Dethrage LM, Gore JC, Smith SA, Li J. Proximal nerve magnetization transfer MRI relates to disability in Charcot-Marie-Tooth diseases. Neurology. 2014;83:1545–1553. doi: 10.1212/WNL.0000000000000919. [DOI] [PMC free article] [PubMed] [Google Scholar]
- 18.Simon NG, Cage T, Narvid J, Noss R, Chin C, Kliot M. High-resolution ultrasonography and diffusion tensor tractography map normal nerve fascicles in relation to schwannoma tissue prior to resection. J Neurosurg. 2014;120:1113–1117. doi: 10.3171/2014.2.JNS131975. [DOI] [PubMed] [Google Scholar]
- 19.Aranyi Z, Csillik A, Devay K, et al. Ultrasonographic identification of nerve pathology in neuralgic amyotrophy: Enlargement, constriction, fascicular entwinement, and torsion. Muscle Nerve. 2015;52:503–511. doi: 10.1002/mus.24615. [DOI] [PubMed] [Google Scholar]
- 20.Seddon HJ. Three types of nerve injury. Brain. 1943;66:237–288. [Google Scholar]
- 21.Sunderland S. A classification of peripheral nerve injuries producing loss of function. Brain. 1951;74:491–516. doi: 10.1093/brain/74.4.491. [DOI] [PubMed] [Google Scholar]
- 22.Bilgen M, Heddings A, Al-Hafez B, et al. Microneurography of human median nerve. J Magn Reson Imaging. 2005;21:826–830. doi: 10.1002/jmri.20345. [DOI] [PubMed] [Google Scholar]
- 23.Felisaz PF, Chang EY, Carne I, et al. In Vivo MR Microneurography of the Tibial and Common Peroneal Nerves. Radiol Res Pract. 2014;2014:780964. doi: 10.1155/2014/780964. [DOI] [PMC free article] [PubMed] [Google Scholar]
- 24.Riegler G, Drlicek G, Kronnerwetter C, et al. High-Resolution Axonal Bundle (Fascicle) Assessment and Triple-Echo Steady-State T2 Mapping of the Median Nerve at 7 T: Preliminary Experience. Invest Radiol. 2016;51:529–535. doi: 10.1097/RLI.0000000000000265. [DOI] [PubMed] [Google Scholar]
- 25.Nitz WR. Magnetic resonance imaging. Sequence acronyms and other abbreviations in MR imaging. Radiologe. 2003;43:745–763. doi: 10.1007/s00117-003-0946-z. quiz 764–745. [DOI] [PubMed] [Google Scholar]
- 26.Ma J. Breath-hold water and fat imaging using a dual-echo two-point Dixon technique with an efficient and robust phase-correction algorithm. Magn Reson Med. 2004;52:415–419. doi: 10.1002/mrm.20146. [DOI] [PubMed] [Google Scholar]
- 27.Constantinides CD, Atalar E, McVeigh ER. Signal-to-noise measurements in magnitude images from NMR phased arrays. Magn Reson Med. 1997;38:852–857. doi: 10.1002/mrm.1910380524. [DOI] [PMC free article] [PubMed] [Google Scholar]
- 28.Yoneyama M, Takahara T, Kwee TC, Nakamura M, Tabuchi T. Rapid high resolution MR neurography with a diffusion-weighted pre-pulse. Magn Reson Med Sci. 2013;12:111–119. doi: 10.2463/mrms.2012-0063. [DOI] [PubMed] [Google Scholar]
- 29.Yoneyama MOM, Ozawa Y, Tanji H, Nakamura M, Okuaki T, Tabuchi T, Tatsuno S, Sashi R, Cauteren MV. High-resolution 3D Mr Neurography of the Wrist using Phase-Cycling Diffusion-Sensitized Driven-Equilibrium (pcDSDE). Proceedings of the 23rd Annual Meeting of ISMRM; Toronto. 2015. p. 313. [Google Scholar]


