

Abstract
Feeding a high-fat diet (HFD) coupled with sugar, mimicking a Western diet, causes fatty liver disease in mice. Histamine induces biliary proliferation and fibrosis and regulates leptin signaling. Wild-type (WT) and l-histidine decarboxylase (Hdc−/−) mice were fed a control diet or an HFD coupled with a high fructose corn syrup equivalent. Hematoxylin and eosin and Oil Red O staining were performed to determine steatosis. Biliary mass and cholangiocyte proliferation were evaluated by immunohistochemistry. Senescence and fibrosis were measured by quantitative PCR and immunohistochemistry. Hepatic stellate cell activation was detected by immunofluorescence. Histamine and leptin levels were measured by enzyme immunoassay. Leptin receptor (Ob-R) was evaluated by quantitative PCR. The HDC/histamine/histamine receptor axis, ductular reaction, and biliary senescence were evaluated in patients with nonalcoholic fatty liver disease, nonalcoholic steatohepatitis, or end-stage liver disease. Hdc−/− HFD mice had increased steatosis compared with WT HFD mice. WT HFD mice had increased biliary mass, biliary proliferation, senescence, fibrosis, and hepatic stellate cell activation, which were reduced in Hdc−/− HFD mice. In Hdc−/− HFD mice, serum leptin levels increased, whereas biliary Ob-R expression decreased. Nonalcoholic steatohepatitis patients had increased HDC/histamine/histamine receptor signaling. Hdc−/− HFD mice are susceptible to obesity via dysregulated leptin/Ob-R signaling, whereas the lack of HDC protects from HFD-induced fibrosis and cholangiocyte damage. HDC/histamine/leptin signaling may be important in managing obesity-induced biliary damage.
The rate of obesity among adults in the United States has doubled in the past 10 years, posing a serious health problem because obesity is a major risk factor for numerous diseases, including nonalcoholic fatty liver disease (NAFLD) and nonalcoholic steatohepatitis (NASH).1 NAFLD is a chronic liver injury characterized by simple steatosis but can develop into NASH, which is further identified by inflammation and fibrosis.2, 3 Considering NASH affects 2% to 5% of Americans, and approximately 25% of hepatocellular carcinoma cases are the result of NAFLD, understanding the etiology of this disease is critical.2 Various models of NAFLD/NASH have been widely used in research, including leptin-deficient (ob/ob) mice, methionine- and choline-deficient diet, and various compositions of a high-fat diet.4 However, a recent model of NAFLD/NASH that uses feeding of a high-fat, trans-fat diet (HFD) coupled with a high fructose corn syrup equivalent for 16 weeks has been developed and closely mimics human NASH and metabolic syndrome.5
During NAFLD/NASH development, it is known that hepatocyte senescence plays a role in the progression of these diseases.6, 7 Specifically, it has been shown that increased hepatocyte expression of cyclin-dependent kinase 1 inhibitor (p21), a marker of senescence, correlates with increased NASH-associated hepatic fibrosis.6 Senescence of cholangiocytes, the cells that line the biliary epithelium in the liver, has been noted in various cholangiopathies, including primary sclerosing cholangitis8, 9; however, the role of cholangiocyte senescence during NAFLD/NASH progression remains unknown.
NAFLD is mainly known to affect hepatocytes, but some NAFLD patients present with cholestasis and ductular reaction, proving that cholangiocytes can be affected as well.10 Ductular reaction, one of the first responses of cholangiocytes after damage, is influenced by many factors,11 and previously we have shown that histamine increases ductular reaction and hepatic fibrosis in multiple murine models of cholestasis.12, 13, 14, 15
Histamine is formed by the decarboxylation of histidine by l-histidine decarboxylase (HDC) and regulates allergies and inflammatory responses16; however, it has also been shown to regulate appetite.17 More important, histamine has also been shown to promote biliary damage and hepatic fibrosis.18, 19, 20 Previous work has demonstrated that histamine acts as an anorexigenic agent by mediating the effects of leptin, a satiety hormone.21, 22 The role of hepatic histamine signaling during high-fat diet, specifically in cholangiocytes, is unknown because most studies look at the role of hypothalamic histamine signaling.17, 21, 22 On the basis of these findings, we evaluated the effect of the knockout of HDC on biliary damage and hepatic fibrosis after HFD feeding.
Materials and Methods
Materials
All reagents were obtained from Sigma-Aldrich, Co (St. Louis, MO) unless otherwise indicated. Cell culture reagents and media were obtained from Invitrogen Corp. (Carlsbad, CA). Antibodies for immunohistochemistry and immunofluorescence were obtained from Abcam (Cambridge, MA), unless indicated otherwise. The TRI Reagent from Sigma Life Science was used to extract total RNA from liver tissues, purified cholangiocytes, and selected cell lines, and total RNA was reverse transcribed with the iScript cDNA synthesis kit (Bio-Rad, Hercules, CA), as described.12, 14, 15 Selected mouse and human primers were purchased from Qiagen (Valencia, CA): human glyceraldehyde-3-phosphate dehydrogenase (catalog number PPH00150F-200), H1 histamine receptor (HR; catalog number PPH02592B-200), H2 HR (catalog number PPH02529A-200), H3 HR (catalog number PPH02533A-200), H4 HR (catalog number PPH16053F-200), HDC (catalog number PPH07080F-200), synaptophysin-9 (SYP-9; catalog number PPH00717A-200), mouse α-smooth muscle actin (α-SMA; catalog number PPM04483A-200), p21 (catalog number PPM02901B-200), cyclin-dependent kinase 4 inhibitor (p18; catalog number PPM02893C-200), cyclin-dependent kinase inhibitor 2A (catalog number PPM02906F-200), fibronectin-1 (catalog number PPM03786A-200), glyceraldehyde-3-phosphate dehydrogenase (catalog number PPM02946E-200), leptin receptor (Ob-R; catalog number PPM05512A-200), p53 and DNA damage regulated 1 (catalog number PPM25706B-200), and SYP-9 (catalog number PPM03241A-200).
Animal Models
All animal procedures were performed according to protocols approved by the Baylor Scott & White Health Institutional Animal Care and Use Committee. Hdc knockout (Hdc−/−) mice were obtained from Dr. Jim Goldenring (Vanderbilt University School of Medicine, Nashville, TN), and background-matched Hdc+/+ [wild type (WT); strain Balb/c] mice were purchased from Charles River (Wilmington, MA); the breeding colony is established in our animal facility. No gross defects or phenotypical changes are noted in the Hdc−/− mice.15 Animals were maintained in microisolator cages in a temperature-controlled environment with 12:12-hour light-dark cycles. Studies were performed in 4-week-old male WT and Hdc−/− mice (25 to 30 g) that were fed either a control diet (CD) consisting of standard chow and reverse osmosis water or an HFD (45% calories from fat) coupled with a high fructose corn syrup equivalent (55% fructose, 45% glucose, w/w) dissolved in reverse osmosis water (Charles River) for up to 16 weeks (n = 6 mice per group).5 Liver tissue samples and blocks (paraffin and frozen), serum, cholangiocytes, and cholangiocyte supernatants (after incubation at 37°C for 4 hours) were collected, as described.15
Human Samples
Human serum and liver tissues were collected from patients diagnosed as having NAFLD, NASH, or end-stage liver disease before organ transplantation, and nondiseased volunteer controls without any known end-stage organ disease. The diagnosis of NAFLD or NASH was determined on the basis of clinical, imaging, and pathologic analysis; patient information and pathologic analysis are provided in Table 1. All collections were monitored and approved by UTHealth Medical Center Institutional Review Board and with the assistance of Dr. Wasim Dar. All samples are deidentified and stored in locked freezers with strict limited access. HDC and HR expression levels were evaluated by real-time quantitative PCR (qPCR).15 Histamine serum levels were determined by using the Histamine enzyme immunoassay kit from Cayman Chemical (Ann Arbor, MI). Human control, NASH, and end-stage liver disease tissues were stained with cytokeratin-19 (CK-19), to detect ductular reaction, and p18, to detect cellular senescence, by immunohistochemistry.
Table 1.
Patient Demographics, Histological Analysis, Clinical Notes, and Serum Levels of AST, ALT, ALP, γ-GT, and Total Bilirubin
| Diagnosis | Age, years | Sex | BMI, kg/m2 | Race | AST, U/L | ALT, U/L | ALP, U/L | γ-GT, U/L | Total bilirubin, U/L | Histologic analysis | Clinical notes |
|---|---|---|---|---|---|---|---|---|---|---|---|
| Control | 51 | F | 27.916 | White | 41 | 49 | 86 | 42 | 1.1 | NA | NA |
| Control | 34 | F | 25.965 | White | 132 | 51 | 51 | 119 | 0.5 | NA | NA |
| Control | 25 | M | 23.291 | Asian | 47 | 27 | 73 | 21 | 0.5 | NA | NA |
| Control | 42 | M | 32.216 | Asian | 50 | 35 | 43 | 34 | 0.5 | NA | NA |
| Control | 44 | M | 28.278 | White | 62 | 22 | 95 | 53 | 2.4 | NA | NA |
| NAFLD | 70 | F | 28.4 | Hispanic | 63 | 78 | 141 | NA | 0.7 | F1-F2 fibrosis; A0-A1 inflammation | Diagnosed as having NAFLD in 2015 |
| NAFLD | 18 | F | 33.64 | White | 122 | 362 | 92 | 29 | 0.3 | F0 fibrosis; A3 inflammation | Diagnosed as having NAFLD in 2017 |
| NAFLD | 57 | F | 27.9 | Hispanic | 65 | 55 | 83 | 19 | 0.4 | F0-F1 fibrosis; A0-A1 inflammation | Diagnosed as having NAFLD in 2017 |
| NAFLD | 54 | M | 33.18 | Hispanic | 43 | 60 | 62 | 35 | 1.3 | NA | Diagnosed as having NAFLD in 2017; fatty liver on ultrasonography |
| NASH | 45 | M | 25.6 | Hispanic | 21 | 32 | 117 | 38 | 5.1 | Liver stage grade 1; inflammation stage 3–4; fibrosis, focal ballooning degeneration, 5% macrovesicular steatosis | NASH diagnosed 13 years before liver transplantation in 2016 |
| NASH | 55 | M | 23.52 | White | 56 | 31 | 141 | 32 | 1.6 | Grade 4 fibrosis, chronic portal inflammation | NASH diagnosed 3 years before liver transplantation in 2016 |
| NASH | 58 | F | 35.2 | Hispanic | 241 | 123 | 111 | NA | 33.7 | Grade 4 fibrosis/cirrhosis, mild patchy steatosis, cholestasis | NASH diagnosed 9 years before liver transplantation in 2016, history of gastric bypass attributable to morbid obesity |
| NASH | 62 | M | 31.82 | Hispanic | 24 | 11 | 109 | NA | 0.5 | Inflammation grade 1, fibrosis grade 1,no ballooning degeneration | NASH diagnosed in 2015, underwent colon resection and liver biopsy in 2016 |
| HCV | 55 | M | 21.6 | White (Arab) | 37 | 60 | 168 | NA | 0.2 | Chronic hepatitis grade 2/stage 4 fibrosis | Status post liver resection for HCC |
| HCV | 55 | M | 42.16 | White | 90 | 64 | 172 | NA | 2.9 | Grade 2/stage 4 | Liver transplantation |
| NA | NA | NA | NA | NA | NA | NA | NA | NA | NA | NA | Liver transplantation |
| ALD | 55 | M | 30.07 | Hispanic | 68 | 59 | 155 | NA | 2 | Grade 2/stage 4 | Liver transplantation |
| Liver transplant rejection | 47 | M | 21 | White | 64 | 30 | 990 | NA | 17.2 | Scattered inflammation/stage 3 fibrosis, marked canalicular cholestasis | Liver transplantation |
| AIH | 36 | F | 34.6 | White | 348 | 236 | 89 | NA | 9.2 | AIH grade 4/stage 4 | Liver transplantation |
F, female; M, male; AIH, autoimmune hepatitis; ALD, alcoholic liver disease; ALP, alkaline phosphatase; ALT, alanine aminotransferase; AST, aspartate aminotransferase; BMI, body mass index; γ-GT, γ-glutamyl transferase; HCC, hepatocellular carcinoma; HCV, hepatitis C virus; NA, not applicable; NAFLD, nonalcoholic fatty liver disease; NASH, nonalcoholic steatohepatitis.
Isolated Cholangiocytes and Cell Lines
Virtually pure cholangiocytes were obtained by immunoaffinity separation11, 23 by using a monoclonal antibody, rat IgG2a (a gift from Dr. Ronald Faris, Brown University, Providence, RI), against an unidentified antigen expressed by all mouse cholangiocytes. After cholangiocyte isolation, supernatants were collected, as previously described.14, 15
In vitro experiments were performed in an immortalized normal murine cholangiocyte cell line14, 15 and in human hepatic stellate cells (hHSCs) that were purchased from ScienCell Research Laboratories (Carlsbad, CA) and maintained in standard conditions.12 Cholangiocyte lines were treated with either Hdc-shRNA to achieve approximately 80% knockdown of Hdc or with negative control shRNA (NEG-shRNA).24
Assessment of Liver Morphology, Steatosis, Intrahepatic Bile Duct Mass, and Biliary Proliferation
Hematoxylin and eosin staining was performed in formalin-fixed, paraffin-embedded liver sections (4 to 5 μm thick; 10 different fields analyzed from each sample from three different animals) to determine liver morphology, including lobular damage, hepatic necrosis, portal inflammation, and hepatocyte ballooning. All mouse and human sections were blinded and evaluated by a board-certified pathologist (A.S.) at Baylor Scott & White Health. We performed serum chemistry for alanine aminotransferase, aspartate aminotransferase, γ-glutamyl transferase, alkaline phosphatase, free high-density lipoprotein, and free low-density lipoprotein using IDEXX Catalyst One test slides (IDEXX, Westbrook, ME). In addition, liver weight, body weight, and liver/body weight ratios were calculated for all groups of mice.
To assess the degree of hepatic steatosis, Oil Red O staining5 was performed in OCT-embedded liver sections (10 μm thick; 10 different fields analyzed from each sample from three different animals) using the Oil Red O (Lipid Stain) kit purchased from Abcam, as outlined by the manufacturer's protocol.
Intrahepatic bile duct mass (IBDM) was evaluated by semiquantitative immunohistochemistry and immunoblotting for CK-19 (a cholangiocyte-specific marker).12, 14, 15 Biliary proliferation was evaluated in formalin-fixed, paraffin-embedded liver sections (4 to 5 μm thick; 10 different fields analyzed from each sample from three different animals) by semiquantitative immunohistochemistry for Ki-67.12, 14, 15
Evaluation of Cholangiocyte Damage and Senescence
Senescence-associated-β-galactosidase staining was performed in liver sections from all groups of mice, as previously described.25 To evaluate cholangiocyte damage, we measured the senescence markers p18, p16, tumor protein p53, and p21 in isolated cholangiocytes by qPCR and in liver sections by immunohistochemistry. Furthermore, cholangiocyte fibrotic reaction was determined by qPCR for fibronectin-1 and α-SMA in isolated cholangiocytes. qPCR was performed using RT2 SYBR Green/ROX quantitative PCR master mix for the Applied Biosystems ViiA7 qPCR system (Life Technologies, Carlsbad, CA), according to the manufacturer's protocol. The comparative CT method (ΔΔCT) was used for quantification of gene expression.
Determination of Fibrosis, HSC Activation, and Inflammation
Collagen deposition was visualized using Sirius Red and Masson's trichrome staining, as described.15, 26 Semiquantitative analysis was performed after Sirius Red staining to measure the degree of collagen deposition. Hepatic fibrosis was further verified by measuring hydroxyproline content in 10 mg of snap liver tissue using the hydroxyproline assay kit from Sigma-Aldrich, according to the manufacturer's protocol.12 Activation of HSCs was visualized in liver sections by immunofluorescence costaining for CK-19 (to visualize bile ducts) and SYP-9 (a marker of activated HSCs12, 27) or α-SMA. In addition, cholangiocyte fibrosis was measured by qPCR in isolated cholangiocytes for the fibrotic markers fibronectin-1 and α-SMA.
The role of cholangiocyte-derived factors on HSC activation was determined by incubating hHSCs in vitro with cholangiocyte supernatants (from all groups of mice for 48 hours, hHSC activation was determined by mRNA expression of SYP-9 and α-SMA). Specifically, cholangiocyte supernatants were collected after primary cell isolation from mice and incubated at 37°C for 4 hours before storage (−80°C).12, 27 Cultured hHSCs were then plated, allowed to come to 80% confluency, and stimulated with 100 μL of cholangiocyte supernatant before evaluation of SYP-9 and α-SMA 48 hours later.
Inflammation was determined by immunohistochemistry for IL-6 and F4/80 to detect macrophages/Kupffer cells in liver sections from all groups of mice. Inflammatory cells were detected using a light microscope.
Measurement of Leptin and Histamine Secretion and Leptin Receptor Expression
Serum leptin levels were measured by enzyme immunoassay using the Leptin Mouse ELISA kit from Abcam, according to the manufacturer's protocol. Histamine secretion was measured in mouse and human serum samples using the Histamine enzyme immunoassay kit from Cayman Chemical, according to the manufacturer's protocol, as previously described.12, 24 Ob-R expression was measured by qPCR in isolated cholangiocytes and cholangiocyte cell lines treated with either NEG-shRNA or Hdc-shRNA, as previously outlined.15
Statistical Analysis
Data are expressed as means ± SEM. Differences between groups were analyzed by the unpaired t-test when two groups were analyzed and by two-way analysis of variance when more than two groups were analyzed.
Results
Loss of Hdc Increases HFD-Induced Liver Damage, Hepatocyte Ballooning, and Hepatic Lipid Droplet Number and Size
A major implication of prolonged HFD feeding is lipid droplet accumulation within the liver5; therefore, hepatic steatosis was measured. Macroscopic alterations, including increased fat deposition, are found in WT HFD mice and more prominently in the Hdc−/− HFD mice compared with controls (Figure 1A). Pathologic evaluation of hematoxylin and eosin revealed that WT HFD mice had focal steatosis and ballooning degeneration coupled with mild periductal fibrosis. Hdc−/− HFD mice displayed mild-to-moderate steatosis with severe ballooning degeneration, hepatocyte necrosis, and moderate-to-severe perisinusoidal and lobular fibrosis, with the suggestion of bridging fibrosis. Furthermore, liver weight was increased in both WT HFD and Hdc−/− HFD mice compared with controls; however, Hdc−/− HFD mice had considerably larger liver weight and body weight (approximately 40% larger) than WT HFD mice (Figure 1, B and C). The liver/body weight ratios of WT HFD and Hdc−/− HFD mice were increased compared with controls (Figure 1D and Table 2).
Figure 1.

Macroscopic changes and evaluation of liver weight, body weight, and ratios after high-fat diet (HFD) feeding. A: WT HFD mice show increased macroscopic changes associated with hepatic steatosis development (arrows) when compared with WT control diet (CD) mice; however, these changes are further increased in Hdc−/− HFD mice when compared with WT HFD mice. B: WT HFD mice have increased liver weight compared with WT CD mice, and this is further increased in Hdc−/− HFD mice compared with WT HFD mice. C: Body weight is unhanged between WT CD, Hdc−/− CD, and WT HFD mice, but is significantly increased in Hdc−/− HFD mice when compared with WT HFD mice. D: Liver/body weight ratio is increased in WT HFD compared with WT CD mice, and is further increased in Hdc−/− HFD mice when compared with WT HFD mice. Data are expressed as means ± SEM. n = 6 mice (B–D). ∗P < 0.05 versus WT CD; †P < 0.05 versus WT HFD; ‡P < 0.05 versus Hdc−/− CD.
Table 2.
Serum Levels of ALT, AST, γ-GT, ALP, Total Cholesterol, Free HDL, and Free LDL and LW/BW Data
| Group | ALT, U/L | AST, U/L | γ-GT, U/L | ALP, U/mL | Free HDL, μg/μL | Free LDL, μg/μL | LW, g | BW, g | LW/BW ratio, g |
|---|---|---|---|---|---|---|---|---|---|
| WT CD | 42.0 ± 12.0 | 273.0 ± 15.58 | 8.0 ± 2.0 | 1.08 ± 0.03 | 2.46 ± 0.24 | 2.25 ± 0.05 | 1.45 ± 0.03 | 27.05 ± 0.44 | 5.36 ± 0.05 |
| WT HFD | 194.0 ± 2.0∗ | 379 ± 24.26∗ | 13.0 ± 1.0 | 1.49 ± 0.11∗ | 1.67 ± 0.04∗ | 1.95 ± 0.02 | 2.0 ± 0.15∗ | 26.43 ± 0.45 | 7.52 ± 0.45∗ |
| Hdc−/− CD | 79.0 ± 2.64 | 225 ± 1.73 | 4.0 ± 2.0 | 1.33 ± 0.03 | 1.63 ± 0.25 | 1.49 ± 0.02 | 1.50 ± 0.03 | 27.71 ± 0.29 | 5.40 ± 0.08 |
| Hdc−/− HFD | 233 ± 1.0∗,† | 417 ± 3.0∗ | 3.0 ± 0.0† | 1.03 ± 0.02† | 2.16 ± 0.02∗,† | 2.21 ± 0.24 | 2.85 ± 0.27 | 34.31 ± 0.81† | 8.29 ± 0.59 |
Data are expressed as means ± SEM.
ALP, alkaline phosphatase; ALT, alanine aminotransferase; AST, aspartate aminotransferase; BW, body weight; CD, control diet; γ-GT, γ-glutamyl transferase; HDL, high-density lipoprotein; HFD, high-fat diet; LDL, low-density lipoprotein; LW, liver weight; WT, wild type.
P < 0.05 versus WT CD.
P < 0.05 versus WT HFD.
Serum alanine aminotransferase, aspartate aminotransferase, alkaline phosphatase, and γ-glutamyl transferase levels were all increased in WT HFD mice compared with WT CD mice (Table 2). In Hdc−/− HFD, there was a greater increase in serum aspartate aminotransferase and alanine aminotransferase, whereas γ-glutamyl transferase and alkaline phosphatase were reduced when compared with WT HFD, demonstrating damage to hepatocytes, but not cholangiocytes (Table 2). Furthermore, there were no significant changes in free low-density lipoprotein; however, free high-density lipoprotein was increased in Hdc−/− HFD mice compared with WT HFD (Table 2).
In WT HFD mice, steatosis and hepatocyte ballooning increase compared with WT CD mice; however, Hdc−/− HFD mice display a robust increase in both steatosis and hepatocyte ballooning compared with WT HFD mice (Figure 2A). Lipid droplet number and size are increased in WT and Hdc−/− HFD mice compared with controls, but larger increases in lipid number and size are seen in the Hdc−/− HFD mice (Figure 2, B and C) compared with WT HFD mice. These data indicate that loss of HDC activity increases HFD-induced hepatic damage, steatosis, and hepatocyte ballooning.
Figure 2.
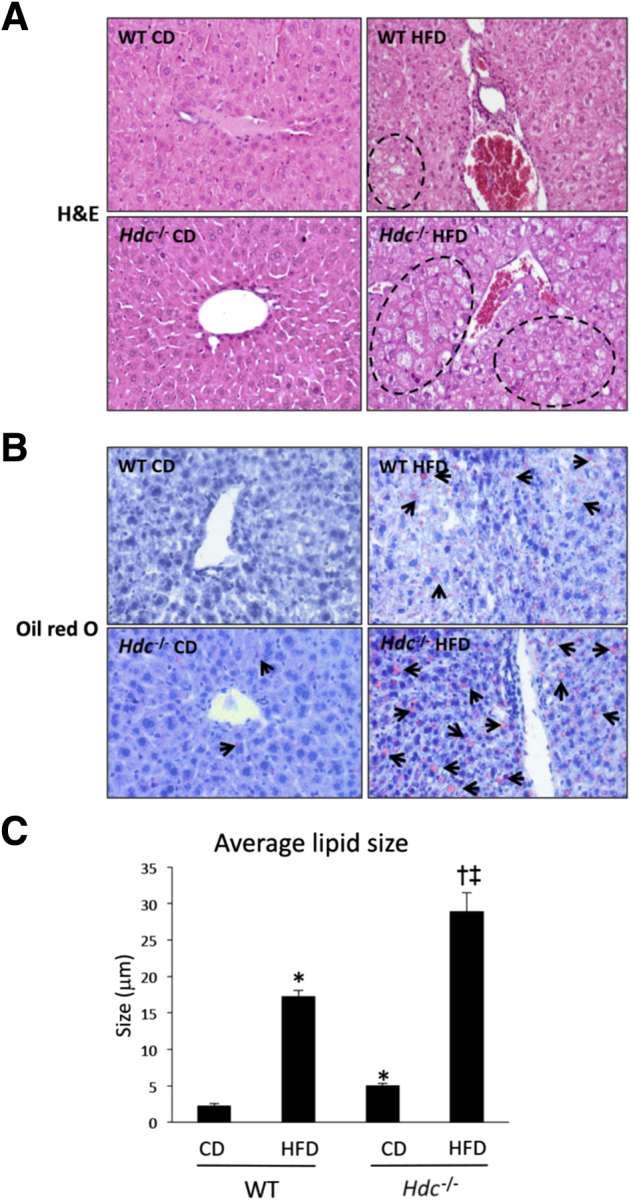
Changes in hepatic steatosis, hepatocyte ballooning, and hepatic lipid droplet number and size after high-fat diet (HFD) feeding. A: As demonstrated by hematoxylin and eosin (H&E) staining, WT HFD mice displayed increased hepatic steatosis and hepatocyte ballooning (dashed lines) when compared with WT control diet (CD) mice, and these parameters were further increased in Hdc−/− HFD mice when compared with WT HFD mice. B: As demonstrated by Oil Red O staining, WT HFD mice have an increased number of lipid droplets (arrows) when compared with WT CD mice, and this is exacerbated in Hdc−/− HFD mice when compared with WT HFD mice. Similarly, WT HFD mice have increased average lipid droplet size when compared with WT CD mice, and this is further increased in Hdc−/− HFD mice when compared with WT HFD mice. C:Hdc−/− CD mice have a few lipid droplets, as shown by Oil Red O staining, and slightly increased average lipid droplet size when compared with WT CD mice. Data are expressed as means ± SEM (C). n = 10 images (A and B). ∗P < 0.05 versus WT CD; †P < 0.05 versus WT HFD; ‡P < 0.05 versus Hdc−/−CD. Original magnification, ×20 (A and B).
Loss of Hdc Decreases HFD-Induced IBDM and Cholangiocyte Proliferation
NAFLD is a disease that primarily affects hepatocytes by increasing lipid accumulation and ballooning28; however, there is a subset of NAFLD patients who present with cholestasis and ductular reaction.10 Furthermore, because we have previously demonstrated that histamine induces specific biliary damage in models of cholestasis,18, 19, 20 the effects of the loss of HDC on biliary injury were assessed. IBDM increases in WT HFD mice compared with WT CD mice and, conversely, Hdc−/− HFD mice show decreased IBDM compared with WT HFD mice (Figure 3A). A similar profile was found using immunoblotting to assess CK-19 expression (Figure 3B). Similarly, cholangiocyte proliferation is increased in WT HFD mice compared with WT CD mice, but is significantly decreased in Hdc−/− HFD mice compared with WT HFD mice (Figure 3C). Loss of HDC decreases HFD-induced IBDM and cholangiocyte proliferation, mimicking our previously published studies.14, 15
Figure 3.

Quantification of biliary damage after high-fat diet (HFD) feeding. A: As demonstrated by immunohistochemistry for cytokeratin-19 (CK-19; black arrows), WT HFD mice have increased intrahepatic biliary mass (IBDM) when compared with WT control diet (CD) mice; however, IBDM is significantly decreased in Hdc−/− HFD mice when compared with WT HFD mice. Insets: Magnified images showing proliferating cholangiocytes. B: By immunoblotting for CK-19, protein expression increased in WT HFD mice compared with WT CD mice, and this was reduced in the Hdc−/− HFD mice. Insets: Magnified images showing CK-19-positive bile ducts. C: As shown by immunohistochemistry for Ki-67 (blue arrows), WT HFD mice have increased cholangiocyte proliferation when compared with WT CD mice; however, Hdc−/− HFD mice have significantly decreased cholangiocyte proliferation when compared with WT HFD mice. Data are expressed as means ± SEM (A–C). n = 10 images for CK-19 and Ki-67 immunohistochemistry and 10 immunoblots (A–C). ∗P < 0.05 versus WT CD; †P < 0.05 versus WT HFD; ‡P < 0.05 versus Hdc−/− CD. Original magnification: ×20 (A and C, main images); ×40 (A and C, insets).
HFD-Induced Cholangiocyte Senescence and Fibrotic Reaction Are Reduced in Hdc−/− Mice
Previously, it has been shown that patients with NASH have increased hepatocyte expression of the senescence marker p21, which is strongly associated with fibrosis stage and clinical outcome.6 Staining for senescence-associated-β-galactosidase demonstrates an increase in cellular senescence in WT HFD mice compared with WT CD mice; however, there is a decrease in staining for senescence-associated-β-galactosidase in Hdc−/− HFD mice compared with WT HFD mice (Figure 4A). As shown by qPCR for p16, p18, p21, and tumor suppressor p53, cholangiocytes from WT HFD mice show increased senescence compared with WT CD mice; however, this is ablated in the Hdc−/− HFD mice compared with WT HFD mice (Figure 4, B–E). By immunohistochemistry, an increase in cholangiocyte p16, p21, and p53 expression was found in WT HFD mice compared with WT CD mice; expression of these senescent markers was decreased in cholangiocytes from Hdc−/− HFD mice compared with WT HFD mice (Figure 5).
Figure 4.

Determination of cholangiocyte senescence after high-fat diet (HFD) feeding. A: As shown by senescence-associated-β-galactosidase (SA-β-Gal) staining, increased biliary senescence in WT HFD mice is observed, which is reduced in Hdc−/− HFD mice. B–E: By real-time quantitative PCR (qPCR), cholangiocytes isolated from WT HFD mice have increased expression of the senescent markers cyclin-dependent kinase inhibitor 2A (p16), cyclin-dependent kinase 4 inhibitor (p18), cyclin-dependent kinase 1 inhibitor (p21), and tumor suppressor p53d when compared with WT control diet (CD) mice; however, these parameters are decreased in cholangiocytes isolated from Hdc−/− HFD mice when compared with WT HFD mice. Data are expressed as means ± SEM (B–E). n ≥ 3 reactions in triplicate for qPCR (B–E). ∗P < 0.05 versus WT CD; †P < 0.05 versus WT HFD. Original magnification, ×20 (A).
Figure 5.

Evaluation of cholangiocyte senescence by immunohistochemistry. The expression of cyclin-dependent kinase inhibitor 2A (p16), cyclin-dependent kinase 1 inhibitor (p21), and tumor suppressor p53 is up-regulated in cholangiocytes in WT high-fat diet (HFD) mice compared with WT control diet (CD) mice. Cholangiocyte senescence decreases in Hdc−/− HFD mice compared with WT HFD. Insets: Magnified images showing senescent cholangiocytes. Original magnification: ×20 (main images); ×40 (insets).
Aside from senescent markers, after injury, such as bile duct ligation, cholangiocytes also express fibrotic markers.29 In WT HFD mice, biliary expression of fibronectin-1 and α-SMA increases compared with WT CD mice, but is significantly decreased in cholangiocytes from Hdc−/− HFD mice compared with WT HFD mice (Supplemental Figure S1). These data indicate that loss of HDC protects cholangiocytes from HFD-induced damage, unlike hepatocytes in which steatotic damage is exaggerated.
HFD-Induced Hepatic Fibrosis and Hepatic Stellate Cell Activation Are Decreased in Hdc−/− Mice
NASH resembles simple fatty liver but is further accompanied with hepatic inflammation and fibrosis that can lead to cirrhosis, causing major scarring, hardening, and impaired function of the liver.28 As shown by Masson's trichrome staining, WT HFD mice have increased collagen deposition compared with WT CD mice that is decreased in Hdc−/− HFD mice compared with WT HFD mice (Figure 6A). This is further supported by Sirius Red staining and semiquantification (Figure 6, B and C). As demonstrated by hydroxyproline assay, WT HFD mice have increased collagen content compared with WT CD mice that is significantly decreased in Hdc−/− HFD mice (Figure 6D).
Figure 6.

Determination of hepatic fibrosis after high-fat diet (HFD) feeding. A–C: As demonstrated by Masson's trichrome and Sirius Red staining (A and B) and Sirius Red staining semiquantification (C), WT HFD mice show increased collagen deposition when compared with WT control diet (CD) mice; however, Hdc−/− HFD mice show a decreased amount of collagen deposition when compared with WT HFD mice. D: As evaluated by hydroxyproline assay, WT HFD mice show increased hydroxyproline content when compared with WT CD mice; however, Hdc−/− HFD mice show decreased hydroxyproline content when compared with WT HFD mice. Data are expressed as means ± SEM (C and D). n = 10 images for Sirius Red semiquantification (C); n = 6 reactions for hydroxyproline assay (D). ∗P < 0.05 versus WT CD; †P < 0.05 versus WT HFD; ‡P < 0.05 versus Hdc−/− CD. Original magnification: ×20 (A and B, main images); ×40 (A and B, insets).
It is widely known that HSCs are the principal collagen-synthesizing cells in the liver and major contributors of hepatic fibrosis30, 31; therefore, we aimed to evaluate HSC activation. WT HFD mice have increased HSC activation, shown by both SYP-9 (Figure 7A) and α-SMA (Figure 7B) staining compared with WT CD mice; however, Hdc−/− HFD mice had markedly decreased HSC activation compared with WT HFD mice (Figure 7). Furthermore, the protein expression of collagen type 1a was evaluated by immunofluorescence, and staining was intensified in WT HFD mice surrounding the portal tract compared with WT CD mice. This expression was significantly decreased in the Hdc−/− HFD mice, as shown by semiquantification (Supplemental Figure S2). These data demonstrate that loss of HDC decreases HFD-induced fibrosis and HSC activation, and this decrease in activation may contribute to the subsequent decrease in HFD-induced hepatic fibrosis.
Figure 7.

Evaluation of hepatic stellate cell (HSC) activation after high-fat diet (HFD) feeding. As determined by immunofluorescence for synaptophysin-9 (SYP-9; green stain; A) or α-smooth muscle actin (α-SMA) costained with cytokeratin-19 (CK-19; red stain; B) to image bile ducts, HSC activation is increased in WT HFD mice compared with WT control diet (CD) mice; however, HSC activation is decreased in Hdc−/− HFD mice compared with WT HFD mice (A). Insets in A: Magnified images showing activated HSCs surrounding bile ducts. Insets in B: Magnified images showing alpha-SMA staining near bile ducts. Original magnification: ×40 (A and B, main images); ×80 (A and B, insets).
Knockdown of Hdc Decreases Hepatic Stellate Cell Activation in Vitro
To verify that cholangiocytes can influence HSC activation, hHSCs were taken in vitro and treated with in vivo–isolated cholangiocyte supernatants before measuring markers of activation. When hHSCs were treated with cholangiocyte supernatants from WT HFD mice, they showed increased SYP-9 and α-SMA expression compared with hHSCs treated with cholangiocyte supernatants from WT CD mice (Supplemental Figure S3). However, these parameters were significantly decreased in hHSCs treated with cholangiocyte supernatants from Hdc−/− HFD mice compared with WT HFD mice (Supplemental Figure S3).
Depletion of Hdc Decreases Inflammation after HFD
By immunohistochemistry for IL-6 and F4/80, an increase in cellular inflammation and Kupffer cell number in WT HFD mice compared with WT CD mice was observed (Figure 8). As expected, loss of HDC decreases the presence of inflammation and Kupffer cells within the liver after HFD feeding (Figure 8).
Figure 8.

Evaluation of liver inflammation. In liver sections from WT high-fat diet (HFD) mice, there is increased expression of IL-6 and F4/80 compared with WT control diet (CD) mice. IL-6 and F4/80 expression decreases in Hdc−/− HFD mice compared with WT HFD mice. F4/80-positive cells are indicated by arrows. Insets: Magnified images showing biliary inflammation and Kupffer cell activation. Original magnification: ×20 (main images); ×40 (insets).
Loss of Hdc Increases Serum Leptin Levels but Decreases Cholangiocyte Ob-R Expression
It is known that histamine can regulate leptin signaling to influence food intake and lipid accumulation32, 33, 34; therefore, histamine and leptin signaling was evaluated. As expected, histamine levels in serum and cholangiocyte supernatants were almost completely ablated in Hdc−/− mice fed CD or HFD compared with controls (Figure 9, A and B). Serum leptin levels were significantly increased in WT HFD mice compared with WT CD mice and were further increased in Hdc−/− HFD mice compared with Hdc−/− CD mice (Figure 9C). Expression of Ob-R was increased in cholangiocytes isolated from WT HFD mice compared with WT CD mice (Figure 9D). However, Ob-R expression decreased in cholangiocytes from Hdc−/− HFD mice compared with WT HFD mice (Figure 9D).
Figure 9.

Histamine levels in serum and cholangiocyte supernatants. A: As measured by enzyme immunoassay (EIA), histamine levels in serum are almost absent in Hdc−/− control diet (CD) and Hdc−/− high-fat diet (HFD) mice compared with controls. B: As measured by EIA, histamine levels in cholangiocyte supernatants from HDC−/− HFD mice are decreased compared with WT HFD mice. Evaluation of leptin/leptin receptor (Ob-R) levels after HFD feeding and human histamine levels. As determined by EIA, serum leptin levels are increased in WT HFD mice compared with WT CD mice. C: Serum leptin levels are further increased in Hdc−/− CD mice compared with WT HFD mice, and even further increased in Hdc−/− HFD mice compared with Hdc−/− CD mice. D: As measured by real-time quantitative PCR (qPCR), cholangiocyte Ob-R expression is increased in WT HFD mice compared with WT CD mice; however, cholangiocyte Ob-R expression is decreased in Hdc−/−HFD mice compared with WT HFD mice. E: As determined by qPCR, Ob-R expression is decreased in large cholangiocytes treated with HDC-shRNA when compared with those treated with negative control shRNA (NEG-shRNA). Data are expressed as means ± SEM (A–E). n ≥ 6 reactions for EIA (A–C); n ≥ 3 reactions in triplicate for qPCR (D–E). ∗P < 0.05 versus WT CD and NEG-shRNA; †P < 0.05 versus WT HFD; ‡P < 0.05 versus Hdc−/− CD.
To evaluate if HDC directly regulates Ob-R expression in cholangiocytes, in vitro, cholangiocytes were transfected with shRNA to target HDC before evaluating Ob-R expression. Cholangiocytes treated with Hdc-shRNA had significantly decreased Ob-R expression when compared with NEG-shRNA–treated cholangiocytes (Figure 9E). The data are further strengthened by results demonstrating that histamine secretion is significantly diminished in cholangiocyte supernatants from Hdc−/− mice fed CD or HFD compared with controls (Figure 9B), suggesting an autocrine regulatory loop in cholangiocytes that is altered by HFD. On the basis of these data, we conclude that down-regulation of HDC and loss of biliary histamine secretion lead to decreased biliary Ob-R expression, causing desensitization to leptin signaling, increased appetite, and increased HFD-induced hepatic steatosis.
HDC/Histamine/HR Axis Is Increased in Patients with NASH
Finally, to confirm that these findings correlate with human liver pathology, ductular reaction, senescence, and the HDC/histamine/HR axis were examined in controls and from patients diagnosed as having NAFLD, NASH, and end-stage liver disease. In NASH and end-stage liver disease, there was an increased ductular reaction (shown by CK-19 immunohistochemistry) when compared with normal tissues (Figure 10A). Furthermore, biliary senescence is increased, as shown by staining for p18 in human NASH when compared with controls (Figure 10B). Similar to previous studies demonstrating that this axis is up-regulated during disease,12 serum histamine levels are increased in human NAFLD, NASH, and end-stage liver disease (Figure 10C) and HDC/H1 through H4 HR gene expression is significantly increased in NASH patients compared with controls (Figure 10D).
Figure 10.

Evaluation of ductular reaction, senescence, and the HDC/histamine/histamine receptor (HR) axis in patients with nonalcoholic fatty liver disease (NAFLD), nonalcoholic steatohepatitis (NASH), or end-stage liver disease. A: Ductular reaction was evaluated by cytokeratin-19 (CK-19) immunohistochemistry and demonstrates that NASH and end-stage liver disease patients display increased ductular reaction compared with control samples. Cyclin-dependent kinase 4 inhibitor (p18) expression was measured by immunohistochemistry in normal livers and NASH patients. B: There is an increase in p18-positive cholangiocytes in NASH patients compared with normal livers. C: Histamine levels increase in patients with NAFLD, NASH, and end-stage liver disease compared with controls. D: HDC and H1 through H4 HR gene expression is significantly up-regulated in NASH patients compared with controls. Data are expressed as means ± SEM (A–D). n ≥ 6 reactions for enzyme immunoassay (C); n ≥ 9 reactions for real-time quantitative PCR. ∗P < 0.05 versus control. Original magnification, ×40 (A and B).
Discussion
In this study, it was found that after HFD feeding, liver weight and liver/body weight ratios are increased, which were further perturbed in Hdc−/− mice fed HFD. Concomitantly, hepatocyte ballooning, steatosis, and lipid droplet size increase after HFD feeding and are further increased in Hdc−/− mice fed HFD. Although HFD-induced hepatocyte damage and steatosis are increased in Hdc−/− mice, biliary damage and hepatic fibrosis were decreased in Hdc−/− HFD mice compared with controls. In WT HFD mice, there was increased biliary senescence and fibrosis, which were ablated in Hdc−/− HFD mice. To analyze if cholangiocytes play a role in HSC activation, in vitro hHSCs treated with isolated cholangiocyte supernatants from WT HFD mice had increased activation; these factors were significantly decreased in hHSCs treated with cholangiocyte supernatants from Hdc−/− HFD mice. Leptin signaling was then examined, because this may play a role in weight gain and steatosis. Biliary Ob-R expression increased in WT HFD mice, but decreased in Hdc−/− HFD mice. This loss of Ob-R expression, coupled with increased leptin levels, may indicate leptin resistance. To look at the relationship between histamine and leptin, in vitro cholangiocytes were treated with either NEG- or HDC-shRNA and we found that Ob-R expression significantly decreased in HDC-shRNA–transfected cholangiocytes. Finally, these findings were confirmed in human patients diagnosed as having NAFLD, NASH, and end-stage liver disease. It was demonstrated that the HDC/histamine/HR axis, ductular reaction, and senescence are significantly up-regulated in these patients compared with controls.
Currently, the development of NASH can be described by the two-hit hypothesis and can be induced by a multitude of factors, including proinflammatory cytokines and adipocytokines.35, 36 Considering that histamine has been shown to play a role in hepatic inflammatory and fibrogenic responses12, 13, 14, 15 and can modulate the adipocytokine, leptin,21, 37, 38 it is highly probable that HDC/histamine/leptin signaling influences NASH development and progression. In fact, Hdc−/− mice fed HFD had significantly increased liver/body weight ratios, along with enhanced steatosis, when compared with WT mice fed HFD, demonstrating that histamine regulation of appetite via leptin/Ob-R is disrupted, leading to overly obese mice. Recent work has demonstrated that WT HFD mice showed an increased number of hepatic lipid droplets and increased average lipid droplet area when compared with WT mice fed CD.39 Comparatively, when looking at liver architecture in mice, WT HFD mice show an increased number and size of hepatic lipid droplets compared with WT CD mice.5, 40 However, Hdc−/− HFD mice have an even further increase in the number of hepatic lipid droplets and lipid droplet size. These data imply that Hdc−/− mice (that have depleted levels of histamine) are more susceptible to developing obesity than WT mice. Specifically, it has been shown that Hdc−/− mice fed HFD have increased visceral adiposity and weight gain.41 In addition, H1 HR−/− mice fed CD develop obesity with increasing age.17, 41 In this respect, we believe that neuronal histamine signaling is critical for the development of obesity.
NASH patients who present with ductular reaction are at an increased risk of developing bridging fibrosis, which can lead to cirrhosis if untreated.10 Histamine enhances biliary proliferation during bile duct ligation–induced cholestasis and in the Mdr2−/− model of primary sclerosing cholangitis.12, 14, 15 Previous work from our laboratory has shown that Hdc−/− mice subjected to bile duct ligation have reduced IBDM and biliary proliferation that is correlated with decreased histamine levels.15 Furthermore, in vitro knockdown of biliary HDC decreased cholangiocyte proliferative capacity and phosphorylated extracellular signal–regulated kinase/extracellular signal–regulated kinase signaling.15 These findings implicate the important role that histamine may play during biliary injury.
Aside from ductular reaction, cholangiocyte senescence can occur after biliary damage.8, 42 Cellular senescence causes irreversible growth arrest and can lead to a senescence-associated secretory phenotype, wherein the cell enters a proinflammatory state.43, 44 Although the role of hepatocyte senescence has been strongly studied in NASH,6, 7, 45 the role of cholangiocyte senescence in this disease has yet to be elucidated. However, cholangiocyte senescence/senescence-associated secretory phenotype regulates various cholangiopathies, including biliary atresia, primary biliary cholangitis, and primary sclerosing cholangitis.46, 47, 48 This study is the first to show that HFD feeding induces biliary senescence in WT mice, which is significantly decreased in Hdc−/− HFD mice. These data provide further evidence that loss of HDC may provide biliary protection during HFD feeding. To correlate these findings with human pathology, an increase was found in p18 in patients diagnosed as having NASH compared with controls.
A key feature that distinguishes NASH from NAFLD is the presence of hepatic fibrosis.2, 28, 49 After feeding, WT HFD mice show enhanced hepatic fibrosis, indicative of NASH development. When Hdc−/− mice are challenged with HFD, these parameters are significantly decreased. These findings support the concept that histamine plays a profibrogenic role during NASH development, and these results can be supported by previous work showing that histamine enhances hepatic fibrosis during bile duct ligation–induced cholestasis and in the Mdr2−/− model of primary sclerosing cholangitis.12, 14, 15 These studies found that cholangiocytes (both intrahepatic and extrahepatic) and infiltrating mast cells are the major sources of HDC and histamine secretion during liver injury, suggesting that biliary and mast cell HDC expressions are key contributors to hepatic fibrosis. Considering that NASH patients with ductular reaction (also shown in the current study) have a higher risk of developing bridging fibrosis, and histamine can affect both fibrogenesis and biliary proliferation, modulation of biliary HDC may be therapeutic during NASH development.
To understand the mechanism by which histamine regulates weight gain, histamine/leptin/Ob-R signaling was studied. Previously published data have shown that central administration of leptin decreased food intake in rats, whereas central administration of α-fluoromethylhistidine (an HDC inhibitor) increased food intake; however, prior administration of α-fluoromethylhistidine blocked the leptin-induced reduction in food intake, providing evidence that histamine can modulate leptin signaling.50 Furthermore, another study found that Hdc−/− mice fed CD or HFD have increased serum leptin levels.51 These data show that histamine secretion was completely ablated in both serum and cholangiocyte supernatants compared with controls, suggesting both autocrine (by cholangiocytes) and paracrine (potentially the hypothalamus or mast cells) regulation. More significantly, in novel data presented herein, patients diagnosed as having NASH, NAFLD, and end-stage liver disease have increased histamine serum levels and an up-regulation of HDC and HR expression compared with controls, postulating that this axis is a critical regulator of fatty liver disease.
Increased leptin levels, coupled with decreased Ob-R expression, are characteristic of leptin resistance; therefore, these findings demonstrate that loss of HDC contributes to leptin resistance. This finding is supported by previous work that demonstrated that loss of histamine signaling promotes leptin resistance in epididymal adipose tissue.51 To identify whether this loss of Ob-R was linked directly to HDC expression, in vitro, cholangiocytes were treated with either NEG- or Hdc-shRNA (to knock down Hdc) and it was found that cholangiocytes treated with Hdc-shRNA had decreased Ob-R expression when compared with NEG-shRNA–treated cholangiocytes. This finding is supported in the same study by Jorgensen et al51 that found that Hdc−/− mice challenged with HFD have decreased Ob-R expression in epididymal adipose tissue when compared with WT HFD mice. Although the role of HDC/histamine on leptin levels has been published before, the role of HDC/histamine on Ob-R expression is poorly understood. These findings are the first to identify that HDC directly influences Ob-R expression in cholangiocytes.
In this study, we aimed to discuss the role of histamine/leptin signaling during HFD feeding, as well as provide novel evidence supporting the role of hepatic histamine signaling during HFD-induced biliary damage and hepatic fibrosis. These findings provide evidence that loss of HDC can exacerbate HFD-induced obesity and hepatic steatosis through down-regulation of Ob-R and increased leptin resistance (Figure 11). Although the loss of histamine signaling may enhance steatosis, we demonstrate that loss of HDC may protect cholangiocytes from HFD-induced damage and decrease the amount of hepatic fibrosis associated with NASH. Considering the multifunctional role of histamine during NAFLD/NASH and the finding that the HDC/histamine/HR axis increases in patients with NASH, more studies are necessary to completely understand the mechanistic properties underlying these pathologic events.
Figure 11.

Working model. In WT mice fed high-fat diet (HFD), hepatocyte ballooning steatosis, biliary damage/senescence, fibrosis, and hepatic stellate cell (HSC) activation are increased. Furthermore, there is increased leptin and histamine signaling, causing dysregulation of these peptides. In the Hdc−/− mice fed HFD, there are greater increases in hepatocyte damage, ballooning, and steatosis compared with WT HFD mice, primarily because of the loss of histamine-regulated leptin signaling. However, in Hdc−/−mice fed HFD, there is decreased biliary damage, cholangiocyte senescence, fibrotic reaction, and HSC activation. The dysregulation of leptin signaling [demonstrated by increased leptin/decreased leptin receptor (Ob-R)] may be regulated by both autocrine (cholangiocytes) and paracrine (hypothalamus or mast cells) pathways. IBDM, intrahepatic biliary mass.
Acknowledgments
We thank Dr. Ronald Faris (Brown University, Providence, RI) for rat monoclonal IgG2a antibody.
L.K. drafted, wrote, and edited the manuscript, designed the study, analyzed data, and performed immunofluorescence analysis; L.H. cultured cells and performed real-time PCR, enzyme immunoassay, and immunohistochemistry; J.D. performed animal studies, collected and prepared tissues, and performed immunohistochemistry and staining; J.M.B. designed the study and analyzed human tissue; W.D. collected human tissue, analyzed data, and edited the manuscript; K.P. analyzed human tissue and performed real-time PCR and enzyme immunoassay; Q.C. organized and performed immunohistochemistry on human tissue for cytokeratin-19 and p18; M.I.N.R. collected consent from patients with nonalcoholic fatty liver disease and isolated blood and serum for histamine analysis; L.S. provided clinical implication input and edited the manuscript; A.S. pathologically evaluated livers from mice and humans; S.D.M. performed leptin-histamine signaling studies, designed the study, and edited the manuscript; F.M. conceived the study, wrote the manuscript, and analyzed data; G.A. designed the study and edited the manuscript; H.F. conceived the study and designed experiments, wrote and edited the manuscript, and prepared figures.
Footnotes
Supported in part by the US Department of Veteran's Affairs VA Merit award 1I01BX003031 (H.F.), Biomedical Laboratory Research and Development Service VA Research Career Scientist Award (G.A.), VA Merit award 5I01BX000574 (G.A.), NIH National Institute of Diabetes and Digestive and Kidney Diseases Biomedical Laboratory Research and Development Service and RO1 DK108959 (H.F.) and RO1 DK082435 (S.D.M.), the PSC Partners Seeking a Cure (H.F. and S.D.M.), and the Dr. Nicholas C. Hightower Centennial Chair of Gastroenterology from Baylor Scott & White Health (G.A.). This material is the result of work supported with resources and the use of facilities at the Central Texas Veterans Health Care System (Temple, TX).
Disclosures: None declared.
The content is the responsibility of the author(s) alone and does not necessarily reflect the views or policies of the Department of Veterans Affairs or the US government.
Supplementary data related to this article can be found at https://doi.org/10.1016/j.ajpath.2017.11.016.
Supplemental Data
Supplemental Figure S1.

Fibrosis evaluation in isolated cholangiocytes. As shown by real-time quantitative PCR, cholangiocytes isolated from WT high-fat diet (HFD) mice have increased expression of the fibrotic markers fibronectin-1 (FN-1; A) and α-smooth muscle actin (α-SMA; B) when compared with WT control diet (CD) mice; however, these parameters are decreased in cholangiocytes isolated from Hdc−/− HFD mice when compared with WT HFD mice. Data are expressed as means ± SEM. n ≥ 6 reactions in triplicate (A and B). ∗P < 0.05 versus WT CD; †P < 0.05 versus WT HFD.
Supplemental Figure S2.

Evaluation of collagen type 1a protein expression. By immunofluorescence and semiquantitative analysis, collagen type 1a expression is significantly increased in WT high-fat diet (HFD) mice compared with WT control diet (CD) mice and found primarily around the portal area. The protein expression of collagen type 1a is significantly down-regulated in HDC HFD mice compared with WT HFD mice. Data are expressed as means ± SEM. n ≥ 6 reactions in triplicate. ∗P < 0.05 versus WT CD; †P < 0.05 versus WT HFD. Original magnification, ×40. CK-19, cytokeratin-19.
Supplemental Figure S3.

Determination of human hepatic stellate cell (hHSC) activation, in vitro. hHSCs treated with supernatants extracted from cholangiocytes isolated from WT high-fat diet (HFD) mice show increased synaptophysin-9 (SYP-9; A) and α-smooth muscle actin (α-SMA; B) expression when compared with hHSCs treated with supernatants from WT control diet (CD) mice. However, these parameters were decreased in hHSCs treated with cholangiocyte supernatants from Hdc−/− HFD mice when compared with WT HFD mice. Data are expressed as means ± SEM. n ≥ 6 reactions in triplicate (A and B). ∗P < 0.05 versus hHSCs + WT CD cholangiocyte supernatants; †P < 0.05 versus hHSCs + WT HFD cholangiocyte supernatants. BS, basal.
References
- 1.Fitzgerald K.R. Review of article: prevalence of obesity and trends in the distribution of body mass index among US adults, 1999-2010 by Katherine M. Flegal, PhD; Margaret D. Carroll, MSPH; Brian K. Kit, MD; Cynthia L. Ogden, PhD (JAMA 2012;307:491-7) J Vasc Nurs. 2013;31:131–132. doi: 10.1016/j.jvn.2013.06.004. [DOI] [PubMed] [Google Scholar]
- 2.Brunt E.M. Pathology of nonalcoholic steatohepatitis. Hepatol Res. 2005;33:68–71. doi: 10.1016/j.hepres.2005.09.006. [DOI] [PubMed] [Google Scholar]
- 3.Bugianesi E., Marietti M. Non-alcoholic fatty liver disease (NAFLD)Recenti Prog Med. 2016;107:360–368. doi: 10.1701/2318.24928. Italian. [DOI] [PubMed] [Google Scholar]
- 4.Takahashi Y., Soejima Y., Fukusato T. Animal models of nonalcoholic fatty liver disease/nonalcoholic steatohepatitis. World J Gastroenterol. 2012;18:2300–2308. doi: 10.3748/wjg.v18.i19.2300. [DOI] [PMC free article] [PubMed] [Google Scholar]
- 5.Mells J.E., Fu P.P., Kumar P., Smith T., Karpen S.J., Anania F.A. Saturated fat and cholesterol are critical to inducing murine metabolic syndrome with robust nonalcoholic steatohepatitis. J Nutr Biochem. 2015;26:285–292. doi: 10.1016/j.jnutbio.2014.11.002. [DOI] [PMC free article] [PubMed] [Google Scholar]
- 6.Aravinthan A., Scarpini C., Tachtatzis P., Verma S., Penrhyn-Lowe S., Harvey R., Davies S.E., Allison M., Coleman N., Alexander G. Hepatocyte senescence predicts progression in non-alcohol-related fatty liver disease. J Hepatol. 2013;58:549–556. doi: 10.1016/j.jhep.2012.10.031. [DOI] [PubMed] [Google Scholar]
- 7.Aravinthan A., Mells G., Allison M., Leathart J., Kotronen A., Yki-Jarvinen H., Daly A.K., Day C.P., Anstee Q.M., Alexander G. Gene polymorphisms of cellular senescence marker p21 and disease progression in non-alcohol-related fatty liver disease. Cell Cycle. 2014;13:1489–1494. doi: 10.4161/cc.28471. [DOI] [PMC free article] [PubMed] [Google Scholar]
- 8.Tabibian J.H., O'Hara S.P., Splinter P.L., Trussoni C.E., LaRusso N.F. Cholangiocyte senescence by way of N-ras activation is a characteristic of primary sclerosing cholangitis. Hepatology. 2014;59:2263–2275. doi: 10.1002/hep.26993. [DOI] [PMC free article] [PubMed] [Google Scholar]
- 9.Muff M.A., Masyuk T.V., Stroope A.J., Huang B.Q., Splinter P.L., Lee S.O., Larusso N.F. Development and characterization of a cholangiocyte cell line from the PCK rat, an animal model of autosomal recessive polycystic kidney disease. Lab Invest. 2006;86:940–950. doi: 10.1038/labinvest.3700448. [DOI] [PubMed] [Google Scholar]
- 10.Sorrentino P., Tarantino G., Perrella A., Micheli P., Perrella O., Conca P. A clinical-morphological study on cholestatic presentation of nonalcoholic fatty liver disease. Dig Dis Sci. 2005;50:1130–1135. doi: 10.1007/s10620-005-2719-1. [DOI] [PubMed] [Google Scholar]
- 11.Glaser S., Meng F., Han Y., Onori P., Chow B.K., Francis H., Venter J., McDaniel K., Marzioni M., Invernizzi P., Ueno Y., Lai J.M., Huang L., Standeford H., Alvaro D., Gaudio E., Franchitto A., Alpini G. Secretin stimulates biliary cell proliferation by regulating expression of microRNA 125b and microRNA let7a in mice. Gastroenterology. 2014;146:1795–1808.e12. doi: 10.1053/j.gastro.2014.02.030. [DOI] [PMC free article] [PubMed] [Google Scholar]
- 12.Jones H., Hargrove L., Kennedy L., Meng F., Graf-Eaton A., Owens J., Alpini G., Johnson C., Bernuzzi F., Demieville J., DeMorrow S., Invernizzi P., Francis H. Inhibition of mast cell-secreted histamine decreases biliary proliferation and fibrosis in primary sclerosing cholangitis Mdr2-/- mice. Hepatology. 2016;64:1202–1216. doi: 10.1002/hep.28704. [DOI] [PMC free article] [PubMed] [Google Scholar]
- 13.Johnson C., Hargrove L., Graf A., Kennedy L., Hodges K., Harris R., Francis T., Ueno Y., Francis H. Histamine restores biliary mass following carbon tetrachloride-induced damage in a cholestatic rat model. Dig Liver Dis. 2015;47:211–217. doi: 10.1016/j.dld.2014.12.006. [DOI] [PubMed] [Google Scholar]
- 14.Kennedy L.L., Hargrove L.A., Graf A.B., Francis T.C., Hodges K.M., Nguyen Q.P., Ueno Y., Greene J.F., Meng F., Huynh V.D., Francis H.L. Inhibition of mast cell-derived histamine secretion by cromolyn sodium treatment decreases biliary hyperplasia in cholestatic rodents. Lab Invest. 2014;94:1406–1418. doi: 10.1038/labinvest.2014.129. [DOI] [PubMed] [Google Scholar]
- 15.Graf A., Meng F., Hargrove L., Kennedy L., Han Y., Francis T., Hodges K., Ueno Y., Nguyen Q., Greene J.F., Francis H. Knockout of histidine decarboxylase decreases bile duct ligation-induced biliary hyperplasia via downregulation of the histidine decarboxylase/VEGF axis through PKA-ERK1/2 signaling. Am J Physiol Gastrointest Liver Physiol. 2014;307:G813–G823. doi: 10.1152/ajpgi.00188.2014. [DOI] [PubMed] [Google Scholar]
- 16.Wood J.D. Histamine, mast cells, and the enteric nervous system in the irritable bowel syndrome, enteritis, and food allergies. Gut. 2006;55:445–447. doi: 10.1136/gut.2005.079046. [DOI] [PMC free article] [PubMed] [Google Scholar]
- 17.Masaki T., Chiba S., Yasuda T., Noguchi H., Kakuma T., Watanabe T., Sakata T., Yoshimatsu H. Involvement of hypothalamic histamine H1 receptor in the regulation of feeding rhythm and obesity. Diabetes. 2004;53:2250–2260. doi: 10.2337/diabetes.53.9.2250. [DOI] [PubMed] [Google Scholar]
- 18.Francis H., Franchitto A., Ueno Y., Glaser S., DeMorrow S., Venter J., Gaudio E., Alvaro D., Fava G., Marzioni M., Vaculin B., Alpini G. H3 histamine receptor agonist inhibits biliary growth of BDL rats by downregulation of the cAMP-dependent PKA/ERK1/2/ELK-1 pathway. Lab Invest. 2007;87:473–487. doi: 10.1038/labinvest.3700533. [DOI] [PMC free article] [PubMed] [Google Scholar]
- 19.Francis H., Glaser S., Demorrow S., Gaudio E., Ueno Y., Venter J., Dostal D., Onori P., Franchitto A., Marzioni M., Vaculin S., Vaculin B., Katki K., Stutes M., Savage J., Alpini G. Small mouse cholangiocytes proliferate in response to H1 histamine receptor stimulation by activation of the IP3/CaMK I/CREB pathway. Am J Physiol Cell Physiol. 2008;295:C499–C513. doi: 10.1152/ajpcell.00369.2007. [DOI] [PMC free article] [PubMed] [Google Scholar]
- 20.Francis H.L., DeMorrow S., Franchitto A., Venter J.K., Mancinelli R.A., White M.A., Meng F., Ueno Y., Carpino G., Renzi A., Baker K.K., Shine H.E., Francis T.C., Gaudio E., Alpini G.D., Onori P. Histamine stimulates the proliferation of small and large cholangiocytes by activation of both IP(3)/Ca(2+) and cAMP-dependent signaling mechanisms. Lab Invest. 2012;92:282–294. doi: 10.1038/labinvest.2011.158. [DOI] [PMC free article] [PubMed] [Google Scholar]
- 21.Itateyama E., Chiba S., Sakata T., Yoshimatsu H. Hypothalamic neuronal histamine in genetically obese animals: its implication of leptin action in the brain. Exp Biol Med (Maywood) 2003;228:1132–1137. doi: 10.1177/153537020322801006. [DOI] [PubMed] [Google Scholar]
- 22.Yoshimatsu H. Hypothalamic neuronal histamine regulates body weight through the modulation of diurnal feeding rhythm. Nutrition. 2008;24:827–831. doi: 10.1016/j.nut.2008.06.014. [DOI] [PubMed] [Google Scholar]
- 23.Alpini G., Glaser S.S., Ueno Y., Pham L., Podila P.V., Caligiuri A., LeSage G., LaRusso N.F. Heterogeneity of the proliferative capacity of rat cholangiocytes after bile duct ligation. Am J Physiol. 1998;274:G767–G775. doi: 10.1152/ajpgi.1998.274.4.G767. [DOI] [PubMed] [Google Scholar]
- 24.Francis H., DeMorrow S., Venter J., Onori P., White M., Gaudio E., Francis T., Greene J.F., Jr., Tran S., Meininger C.J., Alpini G. Inhibition of histidine decarboxylase ablates the autocrine tumorigenic effects of histamine in human cholangiocarcinoma. Gut. 2012;61:753–764. doi: 10.1136/gutjnl-2011-300007. [DOI] [PMC free article] [PubMed] [Google Scholar]
- 25.Wan Y., Meng F., Wu N., Zhou T., Venter J., Francis H., Kennedy L., Glaser T., Bernuzzi F., Invernizzi P., Glaser S., Huang Q., Alpini G. Substance P increases liver fibrosis by differential changes in senescence of cholangiocytes and hepatic stellate cells. Hepatology. 2017;66:528–541. doi: 10.1002/hep.29138. [DOI] [PMC free article] [PubMed] [Google Scholar]
- 26.Glaser S.S., Gaudio E., Rao A., Pierce L.M., Onori P., Franchitto A., Francis H.L., Dostal D.E., Venter J.K., DeMorrow S., Mancinelli R., Carpino G., Alvaro D., Kopriva S.E., Savage J.M., Alpini G.D. Morphological and functional heterogeneity of the mouse intrahepatic biliary epithelium. Lab Invest. 2009;89:456–469. doi: 10.1038/labinvest.2009.6. [DOI] [PMC free article] [PubMed] [Google Scholar]
- 27.Hargrove L., Kennedy L., Demieville J., Jones H., Meng F., DeMorrow S., Karstens W., Madeka T., Greene J., Jr., Francis H. Bile duct ligation-induced biliary hyperplasia, hepatic injury, and fibrosis are reduced in mast cell-deficient KitW-sh mice. Hepatology. 2017;65:1991–2004. doi: 10.1002/hep.29079. [DOI] [PMC free article] [PubMed] [Google Scholar]
- 28.Takahashi Y., Fukusato T. Histopathology of nonalcoholic fatty liver disease/nonalcoholic steatohepatitis. World J Gastroenterol. 2014;20:15539–15548. doi: 10.3748/wjg.v20.i42.15539. [DOI] [PMC free article] [PubMed] [Google Scholar]
- 29.Ray D., Han Y., Franchitto A., DeMorrow S., Meng F., Venter J., McMillin M., Kennedy L., Francis H., Onori P., Mancinelli R., Gaudio E., Alpini G., Glaser S.S. Gonadotropin-releasing hormone stimulates biliary proliferation by paracrine/autocrine mechanisms. Am J Pathol. 2015;185:1061–1072. doi: 10.1016/j.ajpath.2014.12.004. [DOI] [PMC free article] [PubMed] [Google Scholar]
- 30.Friedman S.L. Hepatic stellate cells: protean, multifunctional, and enigmatic cells of the liver. Physiol Rev. 2008;88:125–172. doi: 10.1152/physrev.00013.2007. [DOI] [PMC free article] [PubMed] [Google Scholar]
- 31.Friedman S.L. Hepatic fibrosis: overview. Toxicology. 2008;254:120–129. doi: 10.1016/j.tox.2008.06.013. [DOI] [PubMed] [Google Scholar]
- 32.Yoshimatsu H., Itateyama E., Kondou S., Tajima D., Himeno K., Hidaka S., Kurokawa M., Sakata T. Hypothalamic neuronal histamine as a target of leptin in feeding behavior. Diabetes. 1999;48:2286–2291. doi: 10.2337/diabetes.48.12.2286. [DOI] [PubMed] [Google Scholar]
- 33.Masaki T., Yoshimatsu H., Chiba S., Watanabe T., Sakata T. Targeted disruption of histamine H1-receptor attenuates regulatory effects of leptin on feeding, adiposity, and UCP family in mice. Diabetes. 2001;50:385–391. doi: 10.2337/diabetes.50.2.385. [DOI] [PubMed] [Google Scholar]
- 34.Jorgensen E.A., Knigge U., Warberg J., Kjaer A. Histamine and the regulation of body weight. Neuroendocrinology. 2007;86:210–214. doi: 10.1159/000108341. [DOI] [PubMed] [Google Scholar]
- 35.Duvnjak M., Lerotic I., Barsic N., Tomasic V., Virovic Jukic L., Velagic V. Pathogenesis and management issues for non-alcoholic fatty liver disease. World J Gastroenterol. 2007;13:4539–4550. doi: 10.3748/wjg.v13.i34.4539. [DOI] [PMC free article] [PubMed] [Google Scholar]
- 36.Polyzos S.A., Kountouras J., Zavos C. Nonalcoholic fatty liver disease: the pathogenetic roles of insulin resistance and adipocytokines. Curr Mol Med. 2009;9:299–314. doi: 10.2174/156652409787847191. [DOI] [PubMed] [Google Scholar]
- 37.Wang K.Y., Tanimoto A., Yamada S., Guo X., Ding Y., Watanabe T., Watanabe T., Kohno K., Hirano K., Tsukada H., Sasaguri Y. Histamine regulation in glucose and lipid metabolism via histamine receptors: model for nonalcoholic steatohepatitis in mice. Am J Pathol. 2010;177:713–723. doi: 10.2353/ajpath.2010.091198. [DOI] [PMC free article] [PubMed] [Google Scholar]
- 38.Ishizuka T., Hatano K., Murotani T., Yamatodani A. Comparison of the effect of an H(3)-inverse agonist on energy intake and hypothalamic histamine release in normal mice and leptin resistant mice with high fat diet-induced obesity. Behav Brain Res. 2008;188:250–254. doi: 10.1016/j.bbr.2007.11.001. [DOI] [PubMed] [Google Scholar]
- 39.Smagris E., Gilyard S., BasuRay S., Cohen J.C., Hobbs H.H. Inactivation of Tm6sf2, a gene defective in fatty liver disease, impairs lipidation but not secretion of very low density lipoproteins. J Biol Chem. 2016;291:10659–10676. doi: 10.1074/jbc.M116.719955. [DOI] [PMC free article] [PubMed] [Google Scholar]
- 40.Ganz M., Bukong T.N., Csak T., Saha B., Park J.K., Ambade A., Kodys K., Szabo G. Progression of non-alcoholic steatosis to steatohepatitis and fibrosis parallels cumulative accumulation of danger signals that promote inflammation and liver tumors in a high fat-cholesterol-sugar diet model in mice. J Transl Med. 2015;13:193. doi: 10.1186/s12967-015-0552-7. [DOI] [PMC free article] [PubMed] [Google Scholar]
- 41.Fulop A.K., Foldes A., Buzas E., Hegyi K., Miklos I.H., Romics L., Kleiber M., Nagy A., Falus A., Kovacs K.J. Hyperleptinemia, visceral adiposity, and decreased glucose tolerance in mice with a targeted disruption of the histidine decarboxylase gene. Endocrinology. 2003;144:4306–4314. doi: 10.1210/en.2003-0222. [DOI] [PubMed] [Google Scholar]
- 42.McDaniel K., Meng F., Wu N., Sato K., Venter J., Bernuzzi F., Invernizzi P., Zhou T., Kyritsi K., Wan Y., Huang Q., Onori P., Francis H., Gaudio E., Glaser S., Alpini G. Forkhead box A2 regulated biliary heterogeneity and senescence during cholestatic liver injury. Hepatology. 2017;65:544–559. doi: 10.1002/hep.28831. [DOI] [PMC free article] [PubMed] [Google Scholar]
- 43.Coppe J.P., Patil C.K., Rodier F., Sun Y., Munoz D.P., Goldstein J., Nelson P.S., Desprez P.Y., Campisi J. Senescence-associated secretory phenotypes reveal cell-nonautonomous functions of oncogenic RAS and the p53 tumor suppressor. PLoS Biol. 2008;6:2853–2868. doi: 10.1371/journal.pbio.0060301. [DOI] [PMC free article] [PubMed] [Google Scholar]
- 44.Rodier F., Campisi J. Four faces of cellular senescence. J Cell Biol. 2011;192:547–556. doi: 10.1083/jcb.201009094. [DOI] [PMC free article] [PubMed] [Google Scholar]
- 45.Aravinthan A., Pietrosi G., Hoare M., Jupp J., Marshall A., Verrill C., Davies S., Bateman A., Sheron N., Allison M., Alexander G.J. Hepatocyte expression of the senescence marker p21 is linked to fibrosis and an adverse liver-related outcome in alcohol-related liver disease. PLoS One. 2013;8:e72904. doi: 10.1371/journal.pone.0072904. [DOI] [PMC free article] [PubMed] [Google Scholar]
- 46.Gutierrez-Reyes G., del Carmen Garcia de Leon M., Varela-Fascinetto G., Valencia P., Perez Tamayo R., Rosado C.G., Labonne B.F., Rochilin N.M., Garcia R.M., Valadez J.A., Latour G.T., Corona D.L., Diaz G.R., Zlotnik A., Kershenobich D. Cellular senescence in livers from children with end stage liver disease. PLoS One. 2010;5:e10231. doi: 10.1371/journal.pone.0010231. [DOI] [PMC free article] [PubMed] [Google Scholar]
- 47.Sasaki M., Ikeda H., Haga H., Manabe T., Nakanuma Y. Frequent cellular senescence in small bile ducts in primary biliary cirrhosis: a possible role in bile duct loss. J Pathol. 2005;205:451–459. doi: 10.1002/path.1729. [DOI] [PubMed] [Google Scholar]
- 48.O'Hara S.P., Splinter P.L., Trussoni C.E., Gajdos G.B., Lineswala P.N., LaRusso N.F. Cholangiocyte N-Ras protein mediates lipopolysaccharide-induced interleukin 6 secretion and proliferation. J Biol Chem. 2011;286:30352–30360. doi: 10.1074/jbc.M111.269464. [DOI] [PMC free article] [PubMed] [Google Scholar]
- 49.Dattaroy D., Pourhoseini S., Das S., Alhasson F., Seth R.K., Nagarkatti M., Michelotti G.A., Diehl A.M., Chatterjee S. Micro-RNA 21 inhibition of SMAD7 enhances fibrogenesis via leptin-mediated NADPH oxidase in experimental and human nonalcoholic steatohepatitis. Am J Physiol Gastrointest Liver Physiol. 2015;308:G298–G312. doi: 10.1152/ajpgi.00346.2014. [DOI] [PMC free article] [PubMed] [Google Scholar]
- 50.Toftegaard C.L., Knigge U., Kjaer A., Warberg J. The role of hypothalamic histamine in leptin-induced suppression of short-term food intake in fasted rats. Regul Pept. 2003;111:83–90. doi: 10.1016/s0167-0115(02)00260-4. [DOI] [PubMed] [Google Scholar]
- 51.Jorgensen E.A., Vogelsang T.W., Knigge U., Watanabe T., Warberg J., Kjaer A. Increased susceptibility to diet-induced obesity in histamine-deficient mice. Neuroendocrinology. 2006;83:289–294. doi: 10.1159/000095339. [DOI] [PubMed] [Google Scholar]