Abstract
The present study aimed to determine the mechanisms of action of curcumin in osteosarcoma. Human osteosarcoma U-2 OS cells was purchased from the Cell Bank of the Chinese Academy of Sciences. RNA sequencing analysis was performed for 2 curcumin-treated samples and 2 control samples using Illumina deep sequencing technology. The differentially expressed genes were identified using Cufflink software. Enrichment and protein-protein interaction network analyses were performed separately using cluster Profiler package and Cytoscape software to identify key genes. Then, the mRNA levels of key genes were detected by quantitative reverse transcription polymerase chain reaction (RT-qPCR) in U-2 OS cells. Finally, cell apoptosis, proliferation, migration and invasion arrays were performed. In total, 201 DEGs were identified in the curcumin-treated group. EEF1A1 (degree=88), ATF7IP, HIF1A, SMAD7, CLTC, MCM10, ITPR1, ADAM15, WWP2 and ATP5C1, which were enriched in ‘biological process’, exhibited higher degrees than other genes in the PPI network. RT-qPCR demonstrated that treatment with curcumin was able to significantly increase the levels of CLTC and ITPR1 mRNA in curcumin-treated cells compared with control. In addition, targeting ITPR1 with curcumin significantly promoted apoptosis and suppressed proliferation, migration and invasion. Targeting ITPR1 via curcumin may serve an anticancer role by mediating apoptosis, proliferation, migration and invasion in U-2 OS cells.
Keywords: osteosarcoma, curcumin, RNA sequencing, differentially expressed gene, anticancer role
Introduction
Osteosarcoma is the most common primary bone malignancy in children and adolescents (1), which usually occurs in the metaphyseal region of tubular long bones (2). Although numerous modern therapies, including surgery, chemotherapy and radiotherapy have been used for treating osteosarcoma, the 5-year survival rate of patients with osteosarcoma is 60–70% (3). With the improvements in treatment techniques, the mortality rate of osteosarcoma is decreasing at ~1.3% per year (4). However, the etiology of osteosarcoma is unclear. Therefore, identification of the key genes associated with osteosarcoma is important for treatment of the disease.
As a type of plant polyphenol, curcumin is extracted from Curcuma longa (5) and exhibits anti-tumor, anti-inflammatory, antioxidant and anticoagulation capacities (6–9). Previous studies have demonstrated that curcumin serves functions in the progression of a number of types of cancer, including osteosarcoma (10), pancreatic cancer (11) and colon cancer (12). Fossey et al (13) revealed that FLLL32, a novel compound obtained from curcumin, inhibited signal transducers and activators of transcription 3 (STAT3) and induced apoptosis in osteosarcoma. Chang et al (14) indicated that curcumin induced apoptosis in the osteosarcoma MG63 cell line via mediating the reactive oxygen species/cytochrome c/caspase-3 pathway. Leow et al (15) demonstrated that curcumin and PKF118-310 may delay tumorigenesis and metastasis of osteosarcoma through inhibiting the Wnt/β-catenin signaling pathway. Taken together, these studies indicate that curcumin exhibits an effect on the pathogenesis of osteosarcoma through different pathways. Despite these aforementioned data, the target genes of curcumin in osteosarcoma remain unclear.
RNA sequencing (RNA-seq), which is based on deep-sequencing technology, is a more developed approach compared with transcriptome profiling (16). Several developments in RNA-seq, including mapping of the transcription start site, characterization of small RNA and detection of strand-specific, gene fusion and alternative splicing events, have been identified (17). In the present study, RNA-seq data analysis was performed on human osteosarcoma U-2 OS cells, which were treated by curcumin or dimethyl sulfoxide (DMSO). Differentially expressed genes (DEGs) between the curcumin-treated and control groups were identified, and the functions of the DEGs were predicted by functional and pathway enrichment analyses. A protein-protein interaction (PPI) network involving the DEGs was also constructed to additionally determine the target genes of curcumin in osteosarcoma. In addition, the mRNA levels of the top 10 nodes in the PPI network were confirmed, and it was identified that the mRNA levels of clathrin heavy chain (CLTC) and inositol 1,4,5-triphosphate receptor type 1 (ITPR1) in curcumin-treated cells were significantly increased. In addition, the effects of curcumin and ITPR1 on proliferation, apoptosis, migration and invasion in human osteosarcoma U-2 OS cells were investigated.
Materials and methods
Cell cultivation and curcumin treatment
The human osteosarcoma U-2 OS cell line was purchased from Cell Bank of Chinese Academy of Sciences (Shanghai, China). The U-2 OS cells were inoculated in RPMI-1640 medium (Gibco; Thermo Fisher Scientific, Inc., Waltham, MA, USA) supplemented with 10% fetal bovine serum (FBS; Gibco; Thermo Fisher Scientific, Inc.) and 1% penicillin-streptomycin (Gibco; Thermo Fisher Scientific, Inc.) and cultured at 37°C in a 5% CO2 incubator (Thermo Fisher Scientific, Inc.). When the passaged cells reached 80–90% confluence, the cells were digested using pancreatin (Gibco; Thermo Fisher Scientific, Inc.). The digested cells were centrifuged at 1,000 × g and 4°C for 5 min, and then supernatant was discarded. Subsequently, the cells were preserved in frozen stock solution containing 10% DMSO (Sigma-Aldrich; Merck KGaA, Darmstadt, Germany), 40% FBS and 50% RPMI-1640 medium, and stored in program frozen box.
The U-2 OS cells were seeded in 6-well plates (2×10⁶ cell/well) and incubated in 5 ml serum-free medium in a 5% CO2 incubator (Thermo Fisher Scientific, Inc.) at 37°C overnight. Curcumin (Sigma-Aldrich; Merck KGaA, 15 µmol/l) was dissolved in DMSO. Subsequently, U-2 OS cells were treated with 15 µM curcumin at 37°C in a 5% CO2 incubator for 48 h (curcumin group). Concurrently, in the control groups, U-2 OS cells were treated with an equal volume of DMSO. Finally, the cells were washed twice with cold PBS.
All studies were approved by the Scientific and Ethical Committee of the 309th Hospital of Chinese People's Liberation Army (Beijing, China) and performed in accordance with the ethical standards.
RNA sequencing data
Total RNA was isolated from the U-2 OS cells using TRIzol® (Takara Bio, Inc., Otsu, Japan) according to the manufacturer's protocol and quantified by spectrophotometry. Then, a transcriptome library was constructed using NEBNext® Ultra™ RNA Library Prep kit for Illumina® (cat. no. E7530; New England Biolabs, Inc., Ipswich, MA, USA) following the manufacturer's protocol. RNA was separated into RNA fragments (~200 nt), followed by double-stranded cDNA being synthesized and end-repaired. Then, adaptor ligation and polymerase chain reaction (PCR) enrichment (denaturation step: 98°C for 30 sec; 12 cycles: 98°C for 10 sec and annealing temperature 65°C for 75 sec; final extension step: 65°C for 5 min) were performed using the primers and reagents supplied with the NEBNext® Ultra RNA Library Prep kit. The quality of the library was analyzed using Bioanalyzer 2100 (Agilent Technologies, Inc., Santa Clara, CA, USA), and RNA was sequenced on Hiseq 2500 (Illumina, Inc., San Diego, CA, USA).
Data quality control and screening of DEGs
Subsequent to quality controls of the reads, they were mapped to the reference human genome (hg19) using TopHat (18) and assembled by Bowtie 1 software (19). Combined with sequence alignment results from TopHat and hg19 annotation information downloaded from the University of California, Santa Cruz (UCSC) database (https://www.astro.ucsc.edu/) (20), the DEGs between curcumin and control groups were identified using Cufflink software (21). P<0.01 and |log2 fold change (FC)| ≥1 were set as cut-off criteria.
Functional and pathway enrichment analysis
Gene Ontology (GO, http://geneontology.org/) analysis develops a series of controlled and structured vocabularies for annotating functions of genes and their products (22). The Kyoto Encyclopedia of Genes and Genomes (KEGG; http://www.kegg.jp/) is a biological database, which stores genomic, chemical and systemic functional information (23). Using the cluster profiler (24) package in R, GO functional and KEGG pathway enrichment analyses were performed for upregulated and downregulated genes, respectively. The raw P-value was adjusted by the Benjamini-Hochberg method (25), and the adjusted P-value (also known as false discovery rate, FDR) <0.05 was used as a threshold.
Construction of PPI network
Human Protein Reference Database (HPRD) includes curated proteomic information and describes human PPIs (26). Using HPRD Release 9 (http://www.hprd.org/query) (26), pairs of interacting human proteins were downloaded, and the self-interacting protein pairs were removed. The DEGs were mapped with the downloaded PPI pairs, and those pairs involving the identified DEGs were extracted. Finally, the PPI network was visualized using Cytoscape software (version 2.8.0; www.cytoscape.org) and named as the DEG PPI network (27). Proteins are represented by nodes, the degree is the number of nodes which interact with the node in question, and the higher the degree the more important the protein in the PPI network.
Quantitative reverse transcription polymerase chain reaction (RT-qPCR) analysis
The cells treated with curcumin were dissolved in TRIzol® reagent (Takara Bio, Inc.) for extraction of total RNA. Primers for key genes are summarized in Table I. Using SYBR® Premix Ex Taq™ (Applied Biosystems; Thermo Fisher Scientific, Inc.), RT-qPCR amplification was performed according to the following thermocycling conditions: 50°C for 3 min, 95°C for 3 min, followed by 40 cycles of 95°C for 10 sec and 58°C for 30 sec. Gene expression was quantified and calculated by the comparative threshold (Cq) cycle method (2−ΔΔCq) (28).
Table I.
Primer sequences for specific genes.
| Name of primer | Primer sequences (5′-3′) |
|---|---|
| EEF1A1-hf | TGCCTGGGTCTTGGATAAAC |
| EEF1A1-hr | GCCTGAGATGTCCCTGTAAT |
| ATF7IP-hf | TTCCGCCCCAAAAGATTCAGA |
| ATF7IP-hr | CTGCTTCAAGTTGCTGACGATC |
| HIF1A-hf | ACTTCTGGATGCTGGTGATT |
| HIF1A-hr | GTTCAAACTGAGTTAATCCC |
| SMAD7-hf | ACCTTAGCCGACTCTGCGAACT |
| SMAD7-hr | TTTCAGCGGAGGAAGGCACA |
| CLTC-hf | TTGAATACGGTTGCTCTTGT |
| CLTC-hr | ATGCCAGTCAGAAGTAACCA |
| MCM10-hf | CTTTGAATACGGTTGCTCTT |
| MCM10-hr | GTACGGTAATTGATAATCTGG |
| ITPR1-hf | CCTGGTTGATGATCGTTGTGTT |
| ITPR1-hr | GCTTTTGGGCAGAGTAGCGGTT |
| ADAM15-hf | ATCCCTGCTGTGATTCTTTGACC |
| ADAM15-hr | TGGGCATAGGAGGCACAACG |
| WWP2-hf | CCCCGAATCCCAACACGACT |
| WWP2-hr | TCCCATCCAGCAGGCAGAGC |
| ATP5C1-hf | AAAAGCGAGGTTGCTACACT |
| ATP5C1-hr | ATGACTGACGCATCTCCAAA |
| GAPDH-hf | TGACAACTTTGGTATCGTGGAAGG |
| GAPDH-hr | AGGCAGGGATGATGTTCTGGAGAG |
EEF1A1, eukaryotic translation elongation factor 1α1; ATF7IP, activating transcription factor 7 interacting protein; HIF1A, hypoxia-inducible factor-1α; SMAD7, SMAD family member 7; CLTC, clathrin heavy chain; MCM10, minichromosome maintenance 10 replication initiation factor; ITPR1, inositol 1,4,5-triphosphate receptor type 1; ADAM15, a disintegrin and metalloprotease domain 15; WWP2, WW domain containing E3 ubiquitin protein ligase 2; ATP5C1, ATP synthase, H+ transporting, mitochondrial F1 complex, gamma polypeptide 1; h, human; f, forward; r, reverse.
RNA interference assay
The cells in the siRNA group were digested by pancreatin at 37°C for 5 min, and then complete medium was added to neutralize the pancreatin. Subsequently, the cells were centrifuged at 1,000 × g for 5 min at 4°C, and the supernatant was discarded. Subsequent to being counted, the cells were seeded in 6-well plates (8×10⁵ cell/well) and cultured in 2 ml antibiotic-free complete medium in a 5% CO2 incubator (Thermo Fisher Scientific, Inc.) at 3°C overnight. The ITPR1 small interfering (siRNA) were synthesized with the forward, 5′-AGACAGAAAACAGGAAAUUTT-3′ and reverse primer, (5′-AAUUUCCUGUUUUCUGUCUCA-3′). The ITPR1 siRNA (final concentration, 66 nM/l) and Lipofectamine® 2000 reagent (1:25 vol/vol; Invitrogen; Thermo Fisher Scientific, Inc.) diluted with Opti-MEM medium (Gibco; Thermo Fisher Scientific, Inc.) were mixed and allowed to rest for 20 min. Subsequently, the cells were added to the siRNA mixture (500 µl/well) and Opti-MEM medium was replaced with complete medium following transfection for 6 h at room temperature. In addition, the cells were cultivated in a 5% CO2 incubator (Thermo Fisher Scientific, Inc.) at 37°C for 48 h. The cells were then collected for RT-qPCR assay. The cells in the negative control group were treated with scrambled siRNA (final concentration, 66 nM/l) (Shanghai Biotend Biological Technology, Co., Ltd., Shanghai, China) as control and cultured like the cells in the siRNA group. The cells in the control group were treated without siRNA but otherwise culture the same as the cells in the siRNA group.
Cell proliferation assay
Subsequent to being digested and counted, the cells were seeded in a 96-well plate (4×10⁴ cell/well) and cultured in 100 ml antibiotic-free RPMI-1640 medium supplemented with 10% FBS (both FBS; Gibco; Thermo Fisher Scientific, Inc.) in a 5% CO2 incubator (Thermo Fisher Scientific, Inc.) at 37°C overnight. Then, the cells were separately transfected at room temperature with the siRNA mixture, negative control siRNA and Lipofectamine 2000 reagent (Invitrogen; ThermoFisher Scientific Inc.) for 6 h. Subsequent to treatment with curcumin (Sigma-Aldrich; Merck KGaA), the cells were incubated with cell counting kit-8 at 37°C (CCK8; 10 µl/well; Dojindo Molecular Technologies, Inc., Kumamoto, Japan) for 2 h. Finally, the absorption values under 450 nm were measured using an Epoch™ Microplate Spectrophotometer (BioTek Instruments, Inc., Winooski, VT, USA) to calculate viability.
Flow cytometry
The U-2 OS cells were digested and counted, followed by seeding in a 6-well plate (8×10⁵ cell/well) and cultivation in 2 ml antibiotic-free RPMI-1640 (Gibco; Thermo Fisher Scientific, Inc.) in a 5% CO2 at 37°C overnight. Following transfection at room temperature for 6 h, the cells were treated with curcumin. The cells were digested by pancreatin, washed by PBS and resuspended in 1X binding buffer (BD Biosciences, San Jose, CA, USA). Subsequently, 100 µl of the above solution was transferred to flow cytometry tube, and stained with 5 µl fluorescein is isothiocyanate-Annexin V (BD Biosciences) and 5 µl propidium iodide (50 µg/ml; BD Biosciences) in the dark for 15 min at 25°C. Additionally, 400 µl 1X binding buffer (BD Biosciences) was added prior to flow cytometry using FCS Express 4 (De Novo Software, Glendale, CA).
Wound healing assay
Lines were drawn on the base of 6-well plate with an equal interval of ~0.5–1 cm. Then, the digested and counted cells were seeded in a 6-well plate (8×10⁵ cell/well) and cultured in 2 ml RPMI-1640 medium without serum (Gibco; Thermo Fisher Scientific, Inc.) in a 5% CO2 at 37°C overnight. Then, the cells were separately transfected at room temperature with the siRNA mixture, negative control siRNA and Lipofectamine 2000 reagent (Invitrogen; Thermo Fisher Scientific Inc.) for 6 h. Afterwards, the cells were wound by drawing lines using a pipetting needle. After this, the cells were washed with PBS and then there were several channels on the surface of cultured cells. Subsequent to treatment with 15 µmol/l curcumin, images of movement of the cells were captured every 12 h and measured by Image-Pro Plus 6.0 software (Media Cybernetics Inc., Rockville, MD, USA).
Transwell assay
Subsequent to dilution with PBS (1:3 dilution), 50 µl Matrigel (1 mg/ml; Corning Incorporated, Corning, NY, USA) was solidified in a 24-well polycarbonate membrane following standing for 1 h at 37°C and resuspended following addition of 200 µl RPMI-1640 without serum (Gibco; Thermo Fisher Scientific, Inc.). The cells in each well of cell petri dish were added with 600 µl 10% FBS (Gibco; Thermo Fisher Scientific, Inc.) and then were cultured in a 6-well plate (8×10⁵ cell/well) in 2 ml RPMI-1640 medium with 10% FBS (Gibco; Thermo Fisher Scientific, Inc.) in 5% CO2 at 37°C overnight. Following this, the transferred and treated cells were digested by pancreatin (Gibco: Thermo Fisher Scientific, Inc.) and cultivated in the upper wells (1×10⁵ cell/well) in a 5% CO2 incubator (Thermo Fisher Scientific. Inc.) at 37°C for 12 h. Finally, the liquids in upper wells were discarded, and the cells that had not passed through the membranes were wiped off. The cells were stained with 0.1% crystal violet staining at room temperature for 20 min and observed under an inverted light microscope in 3 fields of view at magnification, ×200 (Olympus Corporation, Tokyo, Japan).
Statistical analysis
Using SPSS 12.0 software (SPSS Inc., Chicago, IL, USA), comparisons between groups were made using one-way ANOVA followed by a least significant difference test. All results are presented as the mean ± standard error. P<0.05 was considered to indicate a statistically significant difference.
Results
Data quality control and analysis of DEGs
Quality control of the reads was performed and then assembled using Bowtie 1 software. The results are summarized in Table II. With P<0.01 and |log2 FC| ≥1 as thresholds, the DEGs between the curcumin and control group were identified by Cufflink software. Compared with the control group, a total of 201 DEGs were identified in the curcumin-treated group, including 114 upregulated and 87 downregulated genes.
Table II.
Results from quality control and assembly of sequencing data.
| ID | Group | Number of cleaned paired-end reads | Number of aligned pair reads |
|---|---|---|---|
| 14710C-1 | Control | 11,660,638 | 8,129,145 |
| 14710C-2 | Control | 12,351,701 | 8,531,536 |
| 14710C-5 | Curcumin | 13,820,514 | 8,368,710 |
| 14710C-6 | Curcumin | 11,927,581 | 8,797,461 |
Functional and pathway enrichment analyses
The upregulated genes were significantly enriched in 3 GO terms, including ‘biological process’ (FDR=3.75×10⁻⁶), ‘cellular component organization’ (FDR=1.95×10⁻²) and ‘cellular component organization or biogenesis’ (FDR=2.08×10⁻²; Table III). The downregulated genes including hypoxia-inducible factor-1α (HIF1A) were significantly enriched in signal transduction (FDR=1.03×10⁻²), cell communication (FDR=1.89×10⁻²) and cellular process (FDR=5.62×10⁻³; Table III). In addition, there were no KEGG pathways significantly enriched for the upregulated or downregulated genes. Importantly, the GO term ‘biological process’ was enriched for upregulated genes [eukaryotic translation elongation factor 1α1 (EEF1A1), activating transcription factor 7 interacting protein (ATF7IP), SMAD family member 7 (SMAD7), CLTC, minichromosome maintenance 10 (MCM10), ITPR1, WW domain containing E3 ubiquitin protein ligase 2 (WWP2) and ATP synthase, H+ transporting, mitochondrial F1 complex, gamma polypeptide 1 (ATP5C1)], and downregulated genes [HIF1A and a disintegrin and metalloprotease 15 (ADAM15)].
Table III.
GO terms enriched for upregulated and downregulated genes.
| Go term | Description | Gene number | FDR | Gene symbol |
|---|---|---|---|---|
| Upregulated DEGs | ||||
| GO: 8150 | Biological process | 94 | 3.75×10⁻⁶ | EEF1A1, ATF7IP, SMAD7, CLTC, MCM10 |
| GO: 16043 | Cellular component organization | 41 | 1.95×10⁻² | ATF7IP, SMAD7, CLTC, CDH4, RTN3 |
| GO: 71840 | Cellular component organization or biogenesis | 41 | 2.08×10⁻² | ATF7IP, SMAD7, CLTC, CDH4, RTN3 |
| Downregulated DEGs | ||||
| GO: 8150 | Biological process | 64 | 8.18×10⁻⁴ | HIF1A, ADAM15, ARFRP1, AKAP9, ABI2 |
| GO: 50896 | Response to stimulus | 40 | 5.62×10⁻³ | HIF1A, ADAM15, ARFRP1, AKAP9, MALT1 |
| GO: 51716 | Cellular response to stimulus | 34 | 5.62×10⁻³ | HIF1A, ARFRP1, AKAP9, MALT1, MGLL |
| GO: 9987 | Cellular process | 59 | 5.62×10⁻³ | HIF1A, ADAM15, ARFRP1,RBM5, PFDN6 |
| GO: 7165 | Signal transduction | 29 | 1.03×10⁻² | HIF1A, ARFRP1, AKAP9, MALT1, RAP1GAP2 |
| GO: 23052 | Signaling | 30 | 1.79×10⁻² | HIF1A, ARFRP1, AKAP9, MALT1, RAP1GAP2 |
| GO: 44700 | Single organism signaling | 30 | 1.79×10⁻² | HIF1A, ARFRP1, AKAP9, MALT1, RAP1GAP2 |
| GO: 7154 | Cell communication | 30 | 1.89×10⁻² | HIF1A, ARFRP1, AKAP9, MALT1, RAP1GAP2 |
| GO: 71704 | Organic substance metabolic process | 46 | 1.89×10⁻² | HIF1A, ADAM15, ARFRP1,GSTO2, ADK |
| GO: 44238 | Primary metabolic process | 45 | 1.89×10⁻² | HIF1A, ADAM15, ARFRP1,GSTO2, ADK |
| GO: 50789 | Regulation of biological process | 43 | 2.04×10⁻² | HIF1A, ARFRP1, AKAP9, ABI2, RBM5 |
| GO: 50794 | Regulation of cellular process | 41 | 2.55×10⁻² | HIF1A, ARFRP1, AKAP9, ABI2, RBM5 |
| GO: 44699 | Single-organism process | 53 | 2.98×10⁻² | HIF1A, ADAM15, ARFRP1, AKAP9, ABI2 |
| GO: 1568 | Blood vessel development | 6 | 4.65×10⁻² | HIF1A, ADAM15, ANKRD17, RAPGEF1, NPRL3, NRP1 |
| GO: 43170 | Macromolecule metabolic process | 38 | 4.98×10⁻² | HIF1A, ADAM15, ABI2, RBM5, PFDN6 |
GO, Gene Ontology; DEGs, differentially expressed genes; FDR: false discovery rate; EEF1A1, eukaryotic translation elongation factor 1α1; ATF7IP, activating transcription factor 7 interacting protein; HIF1A, hypoxia-inducible factor-1α; SMAD7, SMAD family member 7; CLTC, clathrin heavy chain; MCM10, minichromosome maintenance 10 replication initiation factor; ITPR1, inositol 1,4,5-triphosphate receptor type 1; ADAM15, a disintegrin and metalloprotease domain 15; WWP2, WW domain containing E3 ubiquitin protein ligase 2; ATP5C1, ATP synthase, H+ transporting, mitochondrial F1 complex, gamma polypeptide 1; RTN3, reticulon 3; GSTO2, glutathione S-transferase Omega 2; ADK, adenosine kinase; MALT1, mucosa-associated lymphoid tissue lymphoma translocation protein 1; RAP1GAP2, RAP1 GTPase activating protein 2; AKAP9, A-kinase anchoring protein 9; MGLL, monoglyceride lipase; PFDN6, prefoldin subunit 6; RBM5, RNA binding motif protein 5; ABI2, Abl interactor 2; NRP1, neuropilin 1; NPRL3, nitrogen permease regulator 3-like protein 3.
Analysis of PPI network
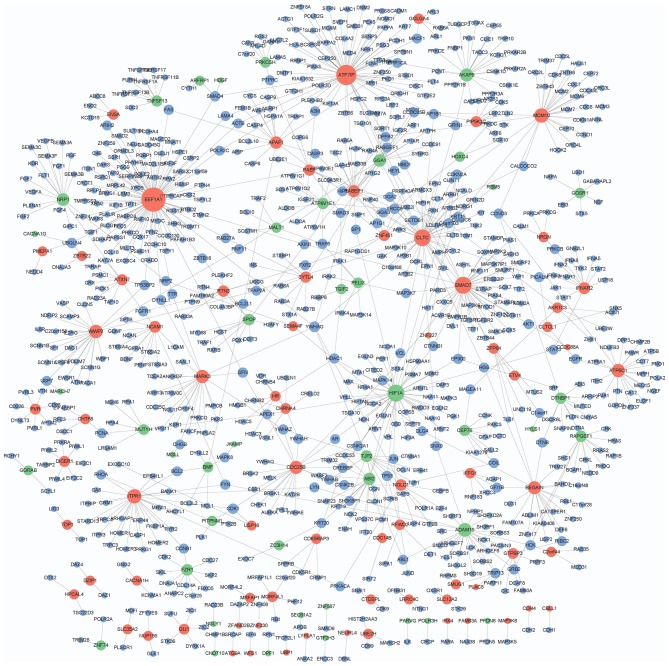
A total of 39,240 PPI pairs were downloaded from HPRD Release 9. The DEG.PPI network had 929 interactions and 913 node genes, including 73 upregulated, 43 downregulated and 797 genes with no significant change in expression (Fig. 1). In particular, EEF1A1 (degree=88), ATF7IP (degree=64), HIF1A (degree=44), SMAD7 (degree=43), CLTC (degree=42), MCM10 (degree=28), ITPR1 (degree=27), ADAM15 (degree=24), WWP2 (degree=22) and ATP5C1 (degree=21) exhibited higher degrees in the DEG.PPI network.
Figure 1.
Protein-protein interaction network that involves the identified differentially expressed genes. Red and green nodes represent upregulated and downregulated genes, respectively. Blue nodes indicate the genes with no significant change in expression.
Effects of curcumin treatment on the mRNA levels of EEF1A1, ATF7IP, HIF1A, SMAD7, CLTC, MCM10, ITPR1, ADAM15, WWP2 and ATP5C1 in U-2 OS cells
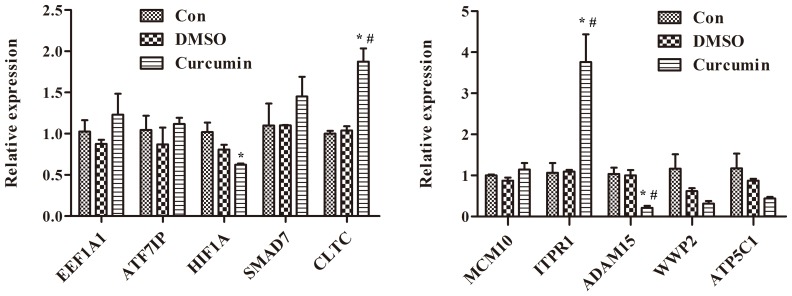
The mRNA levels of EEF1A1, ATF7IP, HIF1A, SMAD7, CLTC, MCM10, ITPR1, ADAM15, WWP2 and ATP5C1, which were the top 10 nodes with higher degrees in the PPI network, were measured. The results of RT-qPCR demonstrated that treatment with curcumin significantly increased the mRNA levels of CLTC and ITPR1 compared with DMSO-treated and control cells (P<0.01; Fig. 2). Additionally, the differential expression of ITPR1in curcumin-treated cells was more marked compared with CLTC.
Figure 2.
Treatment with curcumin significantly increases the mRNA levels of CLTC and ITPR1 and decreases the mRNA levels of ADAM15 in curcumin-treated cells compared with dimethyl sulfoxide-treated and control cells, *P<0.01 compared with control cells, #P<0.01 compared with dimethyl sulfoxide-treated cells. EEF1A1, eukaryotic translation elongation factor 1α1; ATF7IP, activating transcription factor 7 interacting protein; HIF1A, hypoxia-inducible factor-1α; SMAD7, SMAD family member 7; CLTC, clathrin heavy chain; MCM10, minichromosome maintenance 10 replication initiation factor; ITPR1, inositol 1,4,5-triphosphate receptor type 1; ADAM15, a disintegrin and metalloprotease 15; WWP2, WW domain containing E3 ubiquitin protein ligase 2; ATP5C1, ATP synthase, H+ transporting, mitochondrial F1 complex, gamma polypeptide 1; Con, control; DMSO, dimethyl sulfoxide.
RNA interference assay of ITPR1
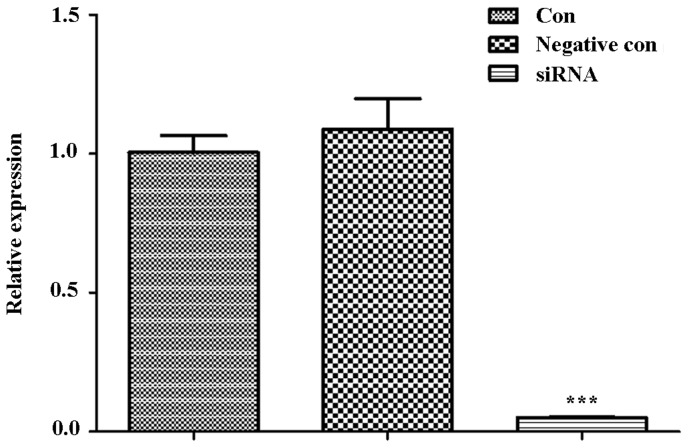
With ITPR1 siRNA sequences, RNA interference assay was performed in U-2 OS cells. Then, the cells were collected for RT-qPCR analysis. The result of RT-qPCR demonstrated that ITPR1 was significantly decreased in cells transferred with ITPR1 siRNA sequences compared with the negative control cells and control cells (P<0.001; Fig. 3).
Figure 3.
ITPR1 is significantly decreased in cells transferred with ITPR1 siRNA sequences in comparison with negative control cells and control cells. ***P<0.001 when comparing the siRNA group with the negative control and control cells (compared separately). ITPR1, inositol 1,4,5-triphosphate receptor type 1; si, small interfering; con, control.
Effects of curcumin treatment and ITPR1 expression on proliferation in U-2 OS cells
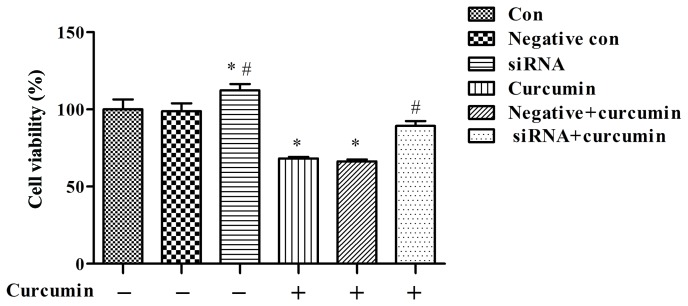
The cell proliferation assay indicated that curcumin treatment was able to significantly suppress the proliferation of U-2 OS cells than the control group not treated with curcumin (P<0.05; Fig. 4), and the effect of curcumin-mediated suppression decreased subsequent to ITPR1 knockdown (P<0.01 vs. negative + curcumin; Fig. 4).
Figure 4.
Treatment with curcumin significantly suppresses proliferation of U-2 OS cells, and the effect of curcumin-mediated suppression decreases following knockdown of inositol 1,4,5-triphosphate receptor type 1. *P<0.05, compared with negative control cells and control cells; #P<0.01, compared with negative and curcumin-treated cells. si, small interfering; con, control.
Effects of curcumin treatment and ITPR1 expression on apoptosis of U-2 OS cells
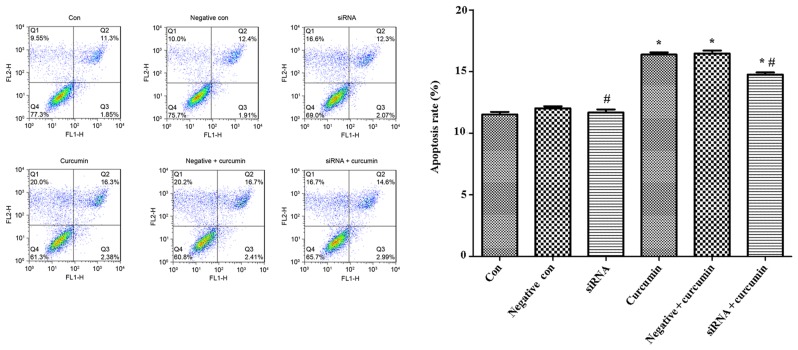
Flow cytometry was used to analysis the apoptotic rate of U-2 OS cells, and the results indicated that treatment with curcumin was able to significantly promote apoptosis of U-2 OS cells compared with the control not treated with curcumin (P<0.05; Fig. 5), while the apoptotic rate of U-2 OS cells transfected with ITPR1 siRNA sequences was significantly decreased (P<0.05; Fig. 5).
Figure 5.
Treatment with curcumin significantly promotes apoptosis of U-2 OS cells, while the apoptotic rate of U-2 OS cells transfected with inositol 1,4,5-triphosphate receptor type 1 siRNA sequences were significantly decreased. *P<0.05, compared with negative control cells and control cells; #P<0.05, compared with negative and curcumin-treated cells. si, small interfering; con, control.
Effects of curcumin treatment and ITPR1 expression on migration of U-2 OS cells
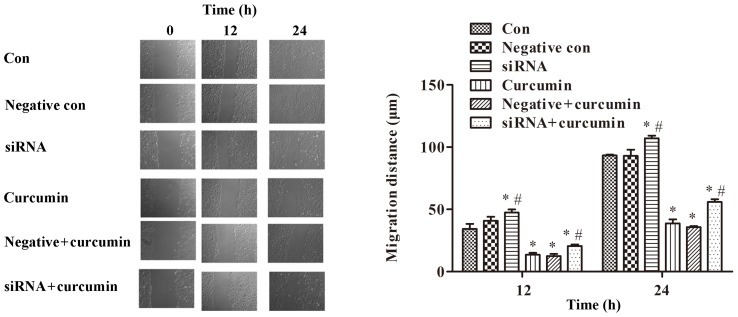
A wound healing assay was performed to detect the migration of U-2 OS cells. The results indicated that treatment with curcumin significantly inhibited cell migration (P<0.01; Fig. 6). Compared with the control group, ITPR1 interference promoted migration of U-2 OS cells (P<0.01; Fig. 6). Meanwhile, ITPR1 interference significantly promoted migration of U-2 OS cells compared with curcumin-treated cells (P<0.05; Fig. 6).
Figure 6.
Treatment with curcumin significantly inhibits cell migration, while ITPR1 interference promotes migration of U-2 OS cells (magnification, ×200). *P<0.01, compared with negative control cells and control cells (Note: for siRNA treated cells at 12 h, the *P<0.01 is compared with control cells); #P<0.05, compared with negative and curcumin-treated cells. si, small interfering; con, control. ITPR1, inositol 1,4,5-triphosphate receptor type 1.
Effects of curcumin treatment and ITPR1 expression on invasion of U-2 OS cells
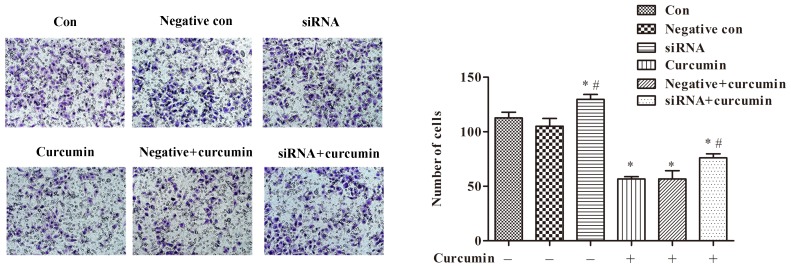
Additionally, a Transwell assay was utilized to investigate the effects of curcumin treatment and ITPR1 expression on invasion of U-2 OS cells. The results of the Transwell assay suggested that treatment with curcumin was able to significantly inhibit invasion of U-2 OS cells compared with the control not treated with curcumin (P<0.05; Fig. 7). In addition, ITPR1 interference relieved the inhibitory effect of curcumin treatment on cell invasion (P<0.05; Fig. 7).
Figure 7.
Treatment with curcumin significantly inhibits invasion of U-2 OS cells, and inositol 1,4,5-triphosphate receptor type 1 interference relieves the inhibitory effect of curcumin on cell invasion (magnification, ×200). *P<0.05 compared with negative control cells and control cells; #P<0.05 compared with negative and curcumin-treated cells. si, small interfering; con, control.
Discussion
In the present study, RNA-sequencing was used to perform transcriptomic analysis of human osteosarcoma U-2 OS cells treated with curcumin or DMSO. A total of 201 DEGs were identified in the curcumin-treated group, including 114 upregulated and 87 downregulated genes. Functional enrichment indicated that downregulated HIF1A was involved in biological processes, including signal transduction, cell communication and cellular process. HIF1A serves a key role in progression, invasion and metastasis of a number of types of human cancer, including osteosarcoma (29). It has been demonstrated that small hairpin RNA (shRNA)-mediated knockdown of HIF1A was able to efficiently inhibit the hypoxia transduction pathway and block the growth of osteosarcoma cells (30). HIF1A functions in osteosarcoma progression and the oxygen-dependent degradation of HIF1A may be critical for osteosarcoma (31). HIF1A is highly relevant to the primary occurrence or recurrence, size, clinical stage, pathological grade and angiogenesis of the osteosarcoma of the jaw, and may serve as a therapeutic target for the disease (32). Therefore, the present study hypothesized that HIF1A may also be involved in osteosarcoma.
EEF1A1 is overexpressed in methotrexate-treated osteosarcoma Saos-2 cell line, and may promote cell growth through the increase of protein translation (33). Concurrently, the inhibition of EEF1A1 may protect myotubes from apoptosis (34). Blanch et al (35) revealed that EEF1A1 exhibited effects on tumor protein (p) 53 and p73 through regulating human homologue of Mdm2 (HDM2) in a number of types of cancer, including osteosarcoma (35). Furthermore, several studies have demonstrated that the p53-family proteins participate in tumorigenesis via the mediation of the genes associated with cell cycle progression and apoptosis (36,37). In osteosarcoma Saos2 cells, SMAD7 may suppress bone morphogenetic protein 2 (BMP2)-induced differentiation and BMP/SMAD signaling through interacting with nuclear factor-κB (38). Previous studies have reported that SMAD7 overexpression may inhibit tumor progression and lung metastasis of osteosarcoma (39,40). Taken together, these data suggested that EEF1A1 and SMAD7 may participate in osteosarcoma. In the PPI network of the present study, EEF1A1 (degree=88), ATF7IP (degree=64), HIF1A (degree=44), SMAD7 (degree=43), CLTC (degree=42), MCM10 (degree=28), ITPR1 (degree=27), ADAM15 (degree=24), WWP2 (degree=22) and ATP5C1 (degree=21) exhibited the highest degrees. These genes were involved in the GO term ‘biological process’, indicating that they may be involved in the anticancer role of curcumin in human osteosarcoma U-2 OS cells through biological processes.
To additionally investigate the mechanisms of action of curcumin on human osteosarcoma U-2 OS cells, the mRNA levels of EEF1A1, ATF7IP, HIF1A, SMAD7, CLTC, MCM10, ITPR1, ADAM15, WWP2 and ATP5C1 in U-2 OS cells were analyzed. RT-qPCR demonstrated that treatment with curcumin significantly increased the mRNA levels of CLTC and ITPR1 in curcumin-treated cells, while the mRAN levels of ADAM15 dramatically decreased in curcumin-treated cells. Notably, the differential expression of ITPR1 was more significant compared with CLTC. Then, the effects of curcumin treatment and ITPR1 expression on proliferation, apoptosis, migration and invasion in U-2 OS cells were investigated. The results indicated that treatment with curcumin was able to significantly promote apoptosis and suppress proliferation, migration and invasion. It was also indicated that ITPR1 may contribute to the effects mediated by curcumin. A previous study had suggested that curcumin suppressed proliferation, invasion, survival, metastasis and angiogenesis of a number of types of cancer via interacting with cell signaling proteins including enzymes and inflammatory cytokines (41). Lee et al (42) with other previous studies demonstrated that treatment with curcumin promoted G1/S and G2/M cell cycle arrest and that activation of the caspase-3 signaling pathway induced apoptosis in human osteosarcoma cells (14,43). Li et al (44) indicated that curcumin inhibited proliferation of osteosarcoma via the inactivation of the Notch-1 signaling pathway. The ITPR1 gene encodes the intracellular calcium release channel type 1 InsP3R that can bind sensitized cells and cytochrome c to apoptotic stimuli (45–47). In osteoblastic cells, including G-292 osteosarcoma cells, exposure to interleukin-1β, tumor necrosis factor α and other apoptotic stimuli increase mRNA and protein levels of ITPR1 (48). These finding suggest that curcumin may serve an anticancer role in human osteosarcoma U-2 OS cells by regulating ITPR1.
In conclusion, a total of 201 DEGs were identified in the curcumin-treated group compared with the control group. Curcumin may serve an anticancer role by regulating apoptosis, proliferation, migration and invasion in human osteosarcoma U-2 OS cells. In addition, ITPR1 may be involved in the mechanism of action of curcumin treatment of osteosarcoma.
References
- 1.Broadhead ML, Clark J, Myers DE, Dass CR, Choong PF. The molecular pathogenesis of osteosarcoma: A review. Sarcoma. 2011;2011:959248. doi: 10.1155/2011/959248. [DOI] [PMC free article] [PubMed] [Google Scholar]
- 2.Ottaviani G, Jaffe N. The epidemiology of osteosarcoma. Pediatric and adolescent osteosarcoma. Springer; 2010. pp. 3–13. [DOI] [PubMed] [Google Scholar]
- 3.He JP, Hao Y, Wang XL, Yang XJ, Shao JF, Guo FJ, Feng JX. Review of the molecular pathogenesis of osteosarcoma. Asian Pac J Cancer Prev. 2014;15:5967–5976. doi: 10.7314/APJCP.2014.15.15.5967. [DOI] [PubMed] [Google Scholar]
- 4.Deng BY, Hua YQ, Cai ZD. Establishing an osteosarcoma associated protein-protein interaction network to explore the pathogenesis of osteosarcoma. Eur J Med Res. 2013;18:57. doi: 10.1186/2047-783X-18-57. [DOI] [PMC free article] [PubMed] [Google Scholar] [Retracted]
- 5.Chen Y, Liu WH, Chen BL, Fan L, Han Y, Wang G, Hu DL, Tan ZR, Zhou G, Cao S, Zhou HH. Plant polyphenol curcumin significantly affects CYP1A2 and CYP2A6 activity in healthy, male Chinese volunteers. Ann Pharmacother. 2010;44:1038–1045. doi: 10.1345/aph.1M533. [DOI] [PubMed] [Google Scholar]
- 6.Rattigan Y, Maitra A. Metabolomic profiling of curcumin effects on pancreatic cancer: Insights into anti-tumor activity. Pancreatology. 2013;13:e68. doi: 10.1016/j.pan.2012.12.292. [DOI] [Google Scholar]
- 7.Motterlini R, Foresti R, Bassi R, Green CJ. Curcumin, an antioxidant and anti-inflammatory agent, induces heme oxygenase-1 and protects endothelial cells against oxidative stress. Free Radic Biol Med. 2000;28:1303–1312. doi: 10.1016/S0891-5849(00)00294-X. [DOI] [PubMed] [Google Scholar]
- 8.Chattopadhyay I, Biswas K, Bandyopadhyay U, Banerjee RK. Turmeric and curcumin: Biological actions and medicinal applications. Curr Sci. 2004;87:44–53. [Google Scholar]
- 9.Qiong L, Ran X. Pharmacological effects of curcumin and bladder cancer treatment research progress. Zhongyaoyao li yulinchuang. 2012;3:050. [Google Scholar]
- 10.Walters DK, Muff R, Langsam B, Born W, Fuchs B. Cytotoxic effects of curcumin on osteosarcoma cell lines. Invest New Drugs. 2008;26:289–297. doi: 10.1007/s10637-007-9099-7. [DOI] [PubMed] [Google Scholar]
- 11.Bao B, Ali S, Kong D, Sarkar SH, Wang Z, Banerjee S, Aboukameel A, Padhye S, Philip PA, Sarkar FH. Anti-tumor activity of a novel compound-CDF is mediated by regulating miR-21, miR-200, and PTEN in pancreatic cancer. PLoS One. 2011;6:e17850. doi: 10.1371/journal.pone.0017850. [DOI] [PMC free article] [PubMed] [Google Scholar] [Retracted]
- 12.Jaiswal AS, Marlow BP, Gupta N, Narayan S. Beta-catenin-mediated transactivation and cell-cell adhesion pathways are important in curcumin (diferuylmethane)-induced growth arrest and apoptosis in colon cancer cells. Oncogene. 2002;21:8414–8427. doi: 10.1038/sj.onc.1205947. [DOI] [PubMed] [Google Scholar]
- 13.Fossey SL, Bear MD, Lin J, Li C, Schwartz EB, Li PK, Fuchs JR, Fenger J, Kisseberth WC, London CA. The novel curcumin analog FLLL32 decreases STAT3 DNA binding activity and expression and induces apoptosis in osteosarcoma cell lines. BMC Cancer. 2011;11:112. doi: 10.1186/1471-2407-11-112. [DOI] [PMC free article] [PubMed] [Google Scholar]
- 14.Chang Z, Xing J, Yu X. Curcumin induces osteosarcoma MG63 cells apoptosis via ROS/Cyto-C/Caspase-3 pathway. Tumour Biol. 2014;35:753–758. doi: 10.1007/s13277-013-1102-7. [DOI] [PubMed] [Google Scholar]
- 15.Leow PC, Tian Q, Ong ZY, Yang Z, Ee PL. Antitumor activity of natural compounds, curcumin and PKF118-310, as Wnt/β-catenin antagonists against human osteosarcoma cells. Invest New Drugs. 2010;28:766–782. doi: 10.1007/s10637-009-9311-z. [DOI] [PubMed] [Google Scholar]
- 16.Wang Z, Gerstein M, Snyder M. RNA-Seq: A revolutionary tool for transcriptomics. Nat Rev Genet. 2009;10:57–63. doi: 10.1038/nrg2484. [DOI] [PMC free article] [PubMed] [Google Scholar]
- 17.Ozsolak F, Milos PM. RNA sequencing: Advances, challenges and opportunities. Nat Rev Genet. 2011;12:87–98. doi: 10.1038/nrg2934. [DOI] [PMC free article] [PubMed] [Google Scholar]
- 18.Trapnell C, Pachter L, Salzberg SL. TopHat: Discovering splice junctions with RNA-Seq. Bioinformatics. 2009;25:1105–1111. doi: 10.1093/bioinformatics/btp120. [DOI] [PMC free article] [PubMed] [Google Scholar]
- 19.Langmead B. Aligning short sequencing reads with Bowtie. Curr Protoc Bioinformatics. 2010 Dec; doi: 10.1002/0471250953.bi1107s32. [DOI] [PMC free article] [PubMed] [Google Scholar]
- 20.Fujita PA, Rhead B, Zweig AS, Hinrichs AS, Karolchik D, Cline MS, Goldman M, Barber GP, Clawson H, Coelho A, et al. The UCSC genome browser database: Update 2011. Nucleic Acids Res. 2010;39(Database Issue):D876–D882. doi: 10.1093/nar/gkq963. [DOI] [PMC free article] [PubMed] [Google Scholar]
- 21.Trapnell C, Hendrickson DG, Sauvageau M, Goff L, Rinn JL, Pachter L. Differential analysis of gene regulation at transcript resolution with RNA-seq. Nat Biotechnol. 2013;31:46–53. doi: 10.1038/nbt.2450. [DOI] [PMC free article] [PubMed] [Google Scholar]
- 22.Gene Ontology Consortium: The gene ontology (GO) project in 2006. Nucleic Acids Res. 2006;34(Database Issue):D322–D326. doi: 10.1093/nar/gkj021. [DOI] [PMC free article] [PubMed] [Google Scholar]
- 23.Kanehisa M, Araki M, Goto S, Hattori M, Hirakawa M, Itoh M, Katayama T, Kawashima S, Okuda S, Tokimatsu T, Yamanishi Y. KEGG for linking genomes to life and the environment. Nucleic Acids Res. 2008;36(Database Issue):D480–D484. doi: 10.1093/nar/gkm882. [DOI] [PMC free article] [PubMed] [Google Scholar]
- 24.Yu G, Wang LG, Han Y, He QY. clusterProfiler: An R package for comparing biological themes among gene clusters. OMICS. 2012;16:284–287. doi: 10.1089/omi.2011.0118. [DOI] [PMC free article] [PubMed] [Google Scholar]
- 25.Benjamini Y, Hochberg Y. Controlling the false discovery rate: A practical and powerful approach to multiple testing. J R Stat Soc Series B Stat Methodol. 1995;57:289–300. [Google Scholar]
- 26.Keshava Prasad TS, Goel R, Kandasamy K, Keerthikumar S, Kumar S, Mathivanan S, Telikicherla D, Raju R, Shafreen B, Venugopal A, et al. Human protein reference database-2009 update. Nucleic Acids Res. 2009;37(Database Issue):D767–D772. doi: 10.1093/nar/gkn892. [DOI] [PMC free article] [PubMed] [Google Scholar]
- 27.Shannon P, Markiel A, Ozier O, Baliga NS, Wang JT, Ramage D, Amin N, Schwikowski B, Ideker T. Cytoscape: A software environment for integrated models of biomolecular interaction networks. Genome Res. 2003;13:2498–2504. doi: 10.1101/gr.1239303. [DOI] [PMC free article] [PubMed] [Google Scholar]
- 28.Livak KJ, Schmittgen TD. Analysis of relative gene expression data using real time quantitative PCR and the 2(-Delta Delta C(T)) method. Methods. 2001;25:402–408. doi: 10.1006/meth.2001.1262. [DOI] [PubMed] [Google Scholar]
- 29.Chau NM, Rogers P, Aherne W, Carroll V, Collins I, McDonald E, Workman P, Ashcroft M. Identification of novel small molecule inhibitors of hypoxia-inducible factor-1 that differentially block hypoxia-inducible factor-1 activity and hypoxia-inducible factor-1alpha induction in response to hypoxic stress and growth factors. Cancer Res. 2005;65:4918–4928. doi: 10.1158/0008-5472.CAN-04-4453. [DOI] [PubMed] [Google Scholar]
- 30.Wu Q, Yang SH, Ye SN, Wang RY. Therapeutic effects of RNA interference targeting HIF-1 alpha gene on human osteosarcoma. Zhonghua Yi Xue Za Zhi. 2005;85:409–413. (In Chinese) [PubMed] [Google Scholar]
- 31.El Naggar A, Clarkson P, Zhang F, Mathers J, Tognon C, Sorensen PH. Expression and stability of hypoxia inducible factor 1α in osteosarcoma. Pediatr Blood Cancer. 2012;59:1215–1222. doi: 10.1002/pbc.24191. [DOI] [PubMed] [Google Scholar]
- 32.Chen WL, Feng HJ, Li HG. Expression and significance of hypoxemia-inducible factor-1alpha in osteosarcoma of the jaws. Oral Surg Oral Med Oral Pathol Oral Radiol Endod. 2008;106:254–257. doi: 10.1016/j.tripleo.2008.01.029. [DOI] [PubMed] [Google Scholar]
- 33.Selga E, Oleaga C, Ramírez S, de Almagro MC, Noé V, Ciudad CJ. Networking of differentially expressed genes in human cancer cells resistant to methotrexate. Genome Med. 2009;1:83. doi: 10.1186/gm83. [DOI] [PMC free article] [PubMed] [Google Scholar]
- 34.Ruest LB, Marcotte R, Wang E. Peptide elongation factor eEF1A-2/S1 expression in cultured differentiated myotubes and its protective effect against caspase-3-mediated apoptosis. J Biol Chem. 2002;277:5418–5425. doi: 10.1074/jbc.M110685200. [DOI] [PMC free article] [PubMed] [Google Scholar]
- 35.Blanch A, Robinson F, Watson IR, Cheng LS, Irwin MS. Eukaryotic translation elongation factor 1-alpha 1 inhibits p53 and p73 dependent apoptosis and chemotherapy sensitivity. PLoS One. 2013;8:e66436. doi: 10.1371/journal.pone.0066436. [DOI] [PMC free article] [PubMed] [Google Scholar]
- 36.Kastan MB, Canman CE, Leonard CJ. P53, cell cycle control and apoptosis: Implications for cancer. Cancer Metastasis Rev. 1995;14:3–15. doi: 10.1007/BF00690207. [DOI] [PubMed] [Google Scholar]
- 37.Yang A, Kaghad M, Wang Y, Gillett E, Fleming MD, Dötsch V, Andrews NC, Caput D, McKeon F. p63, a p53 homolog at 3q27-29, encodes multiple products with transactivating, death-inducing, and dominant-negative activities. Mol Cell. 1998;2:305–316. doi: 10.1016/S1097-2765(00)80275-0. [DOI] [PubMed] [Google Scholar]
- 38.Eliseev RA, Schwarz EM, Zuscik MJ, O'Keefe RJ, Drissi H, Rosier RN. Smad7 mediates inhibition of Saos2 osteosarcoma cell differentiation by NFkappaB. Exp Cell Res. 2006;312:40–50. doi: 10.1016/j.yexcr.2005.09.016. [DOI] [PubMed] [Google Scholar]
- 39.Lamora A, Talbot J, Bougras G, Amiaud J, Leduc M, Chesneau J, Taurelle J, Stresing V, Le Deley MC, Heymann MF, et al. Overexpression of smad7 blocks primary tumor growth and lung metastasis development in osteosarcoma. Clin Cancer Res. 2014;20:5097–5112. doi: 10.1158/1078-0432.CCR-13-3191. [DOI] [PubMed] [Google Scholar]
- 40.Won KY, Kim YW, Park YK. Expression of Smad and its signalling cascade in osteosarcoma. Pathology. 2010;42:242–247. doi: 10.3109/00313021003631288. [DOI] [PubMed] [Google Scholar]
- 41.Kunnumakkara AB, Anand P, Aggarwal BB. Curcumin inhibits proliferation, invasion, angiogenesis and metastasis of different cancers through interaction with multiple cell signaling proteins. Cancer Lett. 2008;269:199–225. doi: 10.1016/j.canlet.2008.03.009. [DOI] [PubMed] [Google Scholar]
- 42.Lee DS, Lee MK, Kim JH. Curcumin induces cell cycle arrest and apoptosis in human osteosarcoma (HOS) cells. Anticancer Res. 2009;29:5039–5044. [PubMed] [Google Scholar]
- 43.Jin S, Xu HG, Shen JN, Chen XW, Wang H, Zhou JG. Apoptotic effects of curcumin on human osteosarcoma U2OS cells. Orhop Surg. 2009;1:144–152. doi: 10.1111/j.1757-7861.2009.00019.x. [DOI] [PMC free article] [PubMed] [Google Scholar]
- 44.Li Y, Zhang J, Ma D, Zhang L, Si M, Yin H, Li J. Curcumin inhibits proliferation and invasion of osteosarcoma cells through inactivation of Notch-1 signaling. FEBS J. 2012;279:2247–2259. doi: 10.1111/j.1742-4658.2012.08607.x. [DOI] [PubMed] [Google Scholar]
- 45.Li C, Wang X, Vais H, Thompson CB, Foskett JK, White C. Apoptosis regulation by Bcl-x(L) modulation of mammalian inositol 1,4,5-trisphosphate receptor channel isoform gating; Proc Natl Acad Sci USA; 2007; pp. 12565–12570. [DOI] [PMC free article] [PubMed] [Google Scholar]
- 46.Orrenius S, Zhivotovsky B, Nicotera P. Regulation of cell death: The calcium-apoptosis link. Nat Rev Mol Cell Biol. 2003;4:552–565. doi: 10.1038/nrm1150. [DOI] [PubMed] [Google Scholar]
- 47.Boehning D, Patterson RL, Snyder SH. Apoptosis and calcium: New roles for cytochrome c and inositol 1,4,5-trisphosphate. Cell Cycle. 2004;3:250–252. doi: 10.4161/cc.3.3.705. [DOI] [PubMed] [Google Scholar]
- 48.Bradford PG, Maglich JM, Kirkwood KL. IL-1 beta increases type 1 inositol trisphosphate receptor expression and IL-6 secretory capacity in osteoblastic cell cultures. Mol Cell Biol Res Commun. 2000;3:73–75. doi: 10.1006/mcbr.2000.0194. [DOI] [PubMed] [Google Scholar]


