Abstract
We have improved our microfluidic cell culture device that generates an in vitro landscape of stress heterogeneity. We now can do continuous observations of different cancer cell lines and carry out downstream analysis of cell phenotype as a function of position on the stress landscape. We use this technology to probe adaption and evolution dynamics in prostate cancer cell metapopulations under a stress landscape of a chemotherapeutic drug (docetaxel). The utility of this approach is highlighted by analysis of heterogenous prostate cancer cell motility changes as a function of position in the stress landscape. Because the technology presented here is easily adapted to a standard epifluorescence microscope it has the potential for broad application in preclinical drug development and assays of likely drug efficacy.
INTRODUCTION
In this article, we present an engineered microenvironment and cell culturing platform which allows for the quantitative study of the interactions of multiple cell types at a cell-by cell resolution in response to neighboring cells and their local microenvironment over a period of several weeks. The resulting massive data base presents a stunningly detailed image of cancer cell dynamics in the presence of a chemotherapy gradient.
Cancer develops as a complex ecosystem. This ecology recapitulates Darwinian natural selection in the context of an evolving and dynamic landscape that applies spatial and time dependent selective pressures which present spatial opportunities for genetic and epigenetic changes which increase fitness. While animal models can to a certain degree reproduce this ecology that drives cancer progression, better ex vivo models are needed for quantitative studies of evolution under high-stress conditions both to predict the progression of cancer and test the efficacy of drugs under stress. In our previous work, we have demonstrated that microfluidic based cancer-on-chips models have the potential to give insight into evolution and population dynamics[1, 2]. Wu et al. utilized a microfabricated ecology but with a fixed linear doxorubicin gradient to create a strong Darwinian selective pressure that drove forward the rapid emergence of doxorubicin resistance in multiple myeloma cells[1]. Han et al. next presented a PDMS microfluidic device that provided wide ranges of drug and nutrient gradients that induced the drug resistance in stage IV U87 glioblastoma cells to doxorubicin [2] but without the ability to track cells in real time. Thus the previous designs of the experiment platforms have imposed serious limitations in acquiring higher spatial resolution and near-continuous time lapse images of cancer cells in a drug gradient. Furthermore, spatially resolved downstream experiment capacities were restricted due to the device assembly.
Discovery of key interactions between host cells and cancer cells and development of improved therapeutic strategies requires a cell culturing system with a complex fitness gradient, in which the behaviors of each individual cell and the interactions of multiple cell types can be tracked, adjusted and monitored in real time. The engineered microenvironment and cell culturing platform presented here allows for the quantitative study of the dynamics of multiple cell types in response to each other as well as varying environmental conditions over time.
BASIC TECHNOLOGY DESIGN
Animal models remain the most effective preclinical platform to predict clinical response to putative drugs but at great cost and extended time frames of months. Uncovering key interactions between host cells and cancer cells and developing improved therapeutic strategies under the conditions found in vivo requires not only a cell culturing system with complex fitness gradients, in which the behavior of each individual cell and the interactions of multiple cell types can be tracked and monitored in real time, but also a means to localize cell populations transiently so that local interactions can take precedence over “mean field” interactions averaged over all cell types.
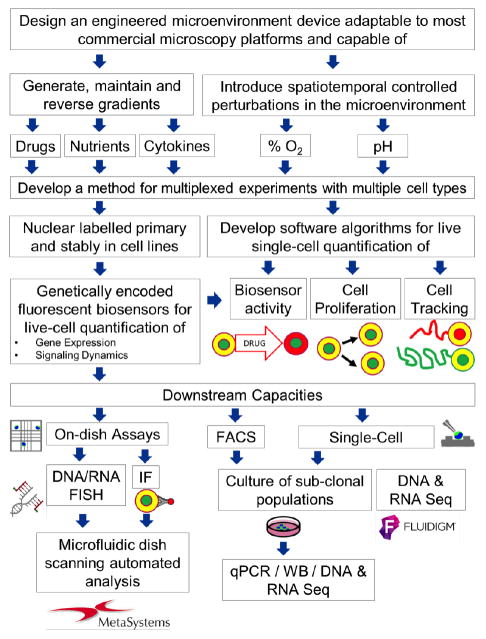
The overview of the experimental design is presented in the block diagram in Fig. 1. In order to model the characteristics of the heterogeneous microenvironment including the adaptive cellular response to the stress gradient as well as the interactions among various types of cells in a tumor community, we have developed a micro-engineered microfluidic cell culture device that mimics in vivo stresses such as oxygen and nutrient heterogeneity that are not modeled in current in vitro assays. We utilize standard photolithography and soft lithography technology to fabricate the PDMS-based microfluidic device.
FIG. 1.
The block diagram of the full experimental platform.
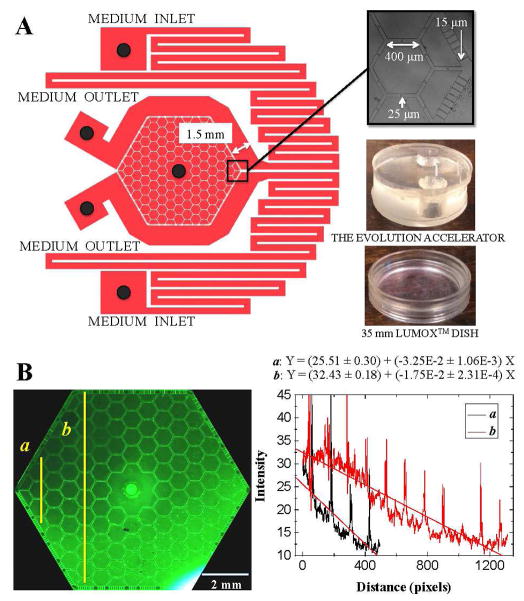
The tri-layered PDMS based device cultures cells at the bottom level within 109 interconnected hexagonal and 24 half-hexagonal chambers in the center. The hexagonal array pattern was chosen for two reasons: (1) maximization of precious chip area because a hexagon is the highest sided regular polygon that can cover space; (2) a connected hexagon maximizes the number of interconnection channels between adjacent parts of the cancer cell metapopulation while still providing localized confinement.
The floor of the lowest level of the PDMS device upon which the cells move is a 35 mm diameter hydrophilic 20 micron thick Lumox™ gas permeable film (Sarstedt, D-51588 Nümbrecht, Germany). Two coupled pairs of syringes with different concentration of chemicals, e.g. drugs, nutrients or cytokines, pump differing chemicals into the external flow channels. The chemicals advect and diffuse into the hexagonal chambers through the 15 micron wide and 180 microns long slits between the periphery channels and the hexagonal array. The slit width dimensions were chosen to provide hydrodynamic resistance and hence reduce advective fluid flow into the interior of the hexagonal array, since too much flow can cause cell detachment [?].
The generation of a complex gradient is demonstrated in Fig. 2B, where one input syringe contain ~ 0.1 mM of fluorescein while the other input syringe is free of the dye fluorescein. The gradient near the medium inlets/outlets (as shown in the line profile a in Fig. 2B) can be twice as large as the gradient near the center (as shown in the line profile b in Fig. 2B).
FIG. 2.
(A) The microfluidic device has two separate medium inlets, two outlets, and one central port for cell seeding or extraction of excessive medium. Note that between the medium inlets and the cell culture arrays, a pair of serpentine channels that allow the medium equilibrate with the atmosphere passed below the gas-permeable membrane. The black dots in the medium inlets, outlets and the center represent the through-holes where the medium is injected or extracted. (B) The generation of gradient is presented. The syringes pump the medium with ~ 0.1 mM of fluorescein and no fluorescein respectively into the chip through the 2 medium inlets on the right, extracted out from the chip at the 2 medium outlets on the left. The concentration of fluorescein is proportional to the intensity of fluorescence signal, and is profiled near the medium inlets/outlets a and near the center b.
MATERIALS AND METHODS
The full technology platform was designed to be a portable cell culture platform that can be installed on any inverted Epi-fluorescent microscope. The full platform is composed of three components: the PDMS microfluidic device with growth medium pump, the gas supply that can control oxygen and CO2 levels, and a customized 3-well plate with thermal control unit.
PDMS microfluidic device fabrication
The PDMS microfluidic device was fabricated by standard photolithography of the Si wafer followed by soft lithography. The reverse patterned Si wafer was silanized for PDMS release. PDMS Sylgard 184 (Dow Corning, Midland, MI) was poured up to create a 2 mm film in height onto a previously silanized Si wafer mold, degassed in a vacuum chamber for 30 minutes, and then heat cross-linked at 70°C overnight. The cured PDMS film was peeled from the mold, followed by punching through-holes at the inlet ports with biopsy needles and cut to 27 mm in diameter using a circular punch. Two 7 mm circles were cut out around the inlets on the reservoir layer, and the through-holes at the inlet ports on the capping layer were punched in advance. Subsequently, three stacks of PDMS were bonded with oxygen plasma, followed by punching the through-holes at the outlets and the center port.
The gas supply system
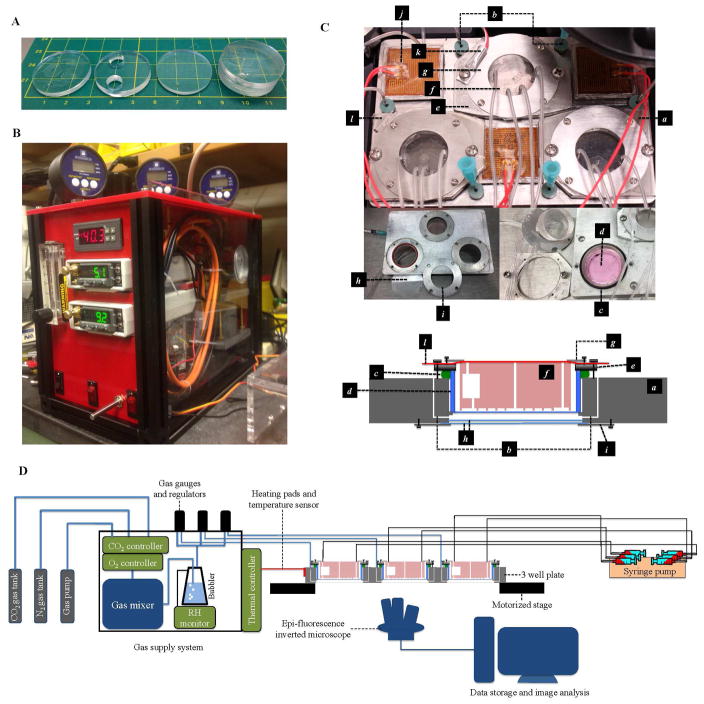
As shown in Fig. 3 B and D, our gas supply system consists of the CO2 and O2 concentration control units, a gas pump, a gas mixing chamber, a humidifier (bubbler), and three separate sets of gas valves and pressure gauges. The CO2 and O2 controller adjust the mixing rate of the gas from CO2 tank, N2 tank and the gas pump that works as an unregulated O2 source. The gas is mixed in the mixing chamber, humidified by a bubbler and a relative humidity monitor that increase the relative humidity (RH) up to 85%, and then led to three independent gas valves with pressure gauges in order to control and monitor the gas flow rate that supports the cells cultured in the customized 3-well sample plate.
FIG. 3. The experimental setup.
(A) The PDMS device. From left to right: the patterned layer, the reservoir layer, the capping layer, and the assembled device. The three stacks of PDMS layers were bonded by oxygen plasma treatment. The reservoirs trap bubbles in the tubing. (B) The gas supply system. (C) The components of the customized 3 well sample plate. a, the main body of 3 well plate; b, a pair of gas channels that allow conditioned atmosphere to be pumped in and vented out through the septa at the entrance of the gas channels; c, an O-ring designed to seal the space between the well plate and the Lumox™ dish; d, the 35 mm diameter Lumox™ dish; e, the dish holder; f, the PDMS device; g, the PDMS chip holders; h, the double layer 35 mm glass windows designed to maintain thermal isolation and prevent water condensation; i, glass window holder; j, heating pads; k, temperature sensor; l, the Microseal™ B Adhesive Sealer (Biorad, Hercules, California 94547 USA) that keeps the chip from drying out. (D) The setup of the experiment, including the gas supply system, gas channels connection, the medium supply connection and the imaging system.
The customized 3-well sample plate and thermal control unit
The stainless steel 3-well sample plate is designed to hold up to 3 Lumox™ dishes capped by the PDMS device, while being able to provide suitable environmental factors for cell culture. With the thermal control unit and the custom made gas supply system which are compatible to the 3-well plate, our cell culture platform can support cell culture on a motorized stage without the need for a full incubator enclosure.
The components of the 3-well sample plate is illustrated in Fig. 3. Each of the three wells is identical and independent. Each well comes with a pair of gas channels (b in Fig. 3 C), a Lumox™ dish holder (e), a PDMS chip holder (g), a glass window holder (i), and a pair of 35 mm glass windows (MatTek Corporation, Ashland, MA) (h). The Lumox™ dish holder clamps the Lumox™ dish(d) surrounded by an O-ring(c), squeezing the O-ring to create an airtight space between the Lumox™ dish and the well. The PDMS chip holder pushes the PDMS device(f) downward. The gas supply system is connected to the gas channels, pressurizing the space between the Lumox™ dish and the well, and pushing the Lumox™ membrane against the PDMS device to secure the sealing of the device. The temperature sensing unit (k) and heating pads (j) are connected to the 3-well plate and actively control the temperature around 37 °C. A sheet of Microseal™ B Adhesive Sealer(l) was taped on top of the PDMS device, clamped by the PDMS chip holder to prevent the chip from drying out. The double layer glass windows are designed to keep the space between the Lumox™ membrane and the well thermal isolated so that there’s no water condensation due to temperature difference at the interface. The entire 3-well sample plate is set on the motorized stage of an inverted microscope for long-term image acquisition.
EXPERIMENT: PC3-EPI AND PC3-EMT CO-CULTURING IN DOCETAXEL GRADIENT
The epithelial to mesenchymal transition (EMT) of cancer cells is thought to play a significant role in invasion and metastasis and is associated with resistance to chemotherapy [4]. Visualizing and tracking the emergence of EMT in a tumor cell population is a major goal in cancer cell biology. Utilizing the technology platform we have discussed above we sought simulate a tumor tissue with both epithelial (PC3-EPI) and mesenchymal (PC3-EMT) phenotypes experiencing a chemotherapy stress gradient, observing, and analyzing the behaviors of cells individually and collectively, recording how they respond to chemotherapy and develop drug resistance in real time.
The human prostate cancer line PC3, originally established from a patient with bone metastasis, was obtained from the American Type Culture Collection (ATCC, Manassas, VA). PC3-EPI and PC3-EMT cells were generated in our lab as previously described by Roca et al. [5]. PC3-EPI is a E-cadherin/CDH1 positive/vimentin negative PC3 clone and PC3-EMT is its M2 macrophage-induced mesenchymal derivative that has a E-cadherin negative/vimentin positive phenotype.. All cells were routinely maintained in RPMI 1640 (Gibco, Grand Island, NY) supplemented with 10% fetal bovine serum (Sigma-Aldrich, St. Louise, MI) and 1X Anti-anti (Gibco, Grand Island, NY) at 37 °C in a humidified atmosphere containing 5% CO2.
Cell seeding
Epithelial PC3 cells and PC3-EMT were separately cultured to confluence and then trypsinized and counted with a Cellometer Auto T4 (Nexcelom, Lawrence, MA). The two cell types were then mixed, centrifuged and re-suspended in 2 mL of complete media and seeded into the 35 mm diameter Lumox™ dish,. For each experiment a total of 2.5 × 10⁴ cells are seeded in each of the 3 dishes, leaving the dishes inside an incubator overnight until the cells attached to the surface of the membrane.
Installation of PDMS device
Each PDMS device requires four 10 mL BD Luer-Lok™ tip syringes loaded onto the syringe pump and individually connected to a 50 cm Tygon microbore tube by a Luer lock 23G dispensing needle into one hollow steel pins inserted into the PDMS chip. Sterile medium was pre-warmed at 37° C and then degassed for 20 minutes in a vacuum chamber. In this experiment a pair of syringes were loaded with RPMI 1640 supplemented with 10% fetal bovine serum and 1x Anti-anti, while the other pair of syringes contain the same growth medium formula with 10 nM docetaxel. Two 10mL syringes per chip were fully loaded in sterile conditions with the adequate media and placed in the infusion deck of the pump while other two were placed empty in the withdraw deck. The normoxia ambient gas composition (20% O2, 5% CO2 and 75% N2) with > 80% humidity was provided by the homemade gas supply unit. The conditioned atmosphere was then led into 3 individual gas channels in the sample wells and vented through gas outlet channels. The flow rate of normoxia gas can be regulated by the gas valves and the gauge pressure maintained at 0.2 psi (1.4×10⁴ Pa) to push the membrane against the PDMS hexagonal array. See Fig. 3 D. The medium flow rate around the array was set at 20 μL/hr.
Real-time imaging of cells
As shown in Fig. 3 C, bottom of the 3 wells was imaged through a 35 mm diameter 100 micron thick glass window (MatTek Corporation, Ashland, MA) so that the cells in the array could be observed using an inverted microscope. Time lapse images were acquired using Micro-Manager (https://micro-manager.org) to control the Nikon Eclipse Ti microscope.. A full scan at 10x magnification of each of the 3 chips was acquired every 30 minutes in both bright field and fluorescent channels. Images were processed with Photoshop software (Adobe Photoshop CS4, Adobe Systems Inc, CA, USA) and imported into ImageJ software (http://imagej.nih.gov/ij/index.html).
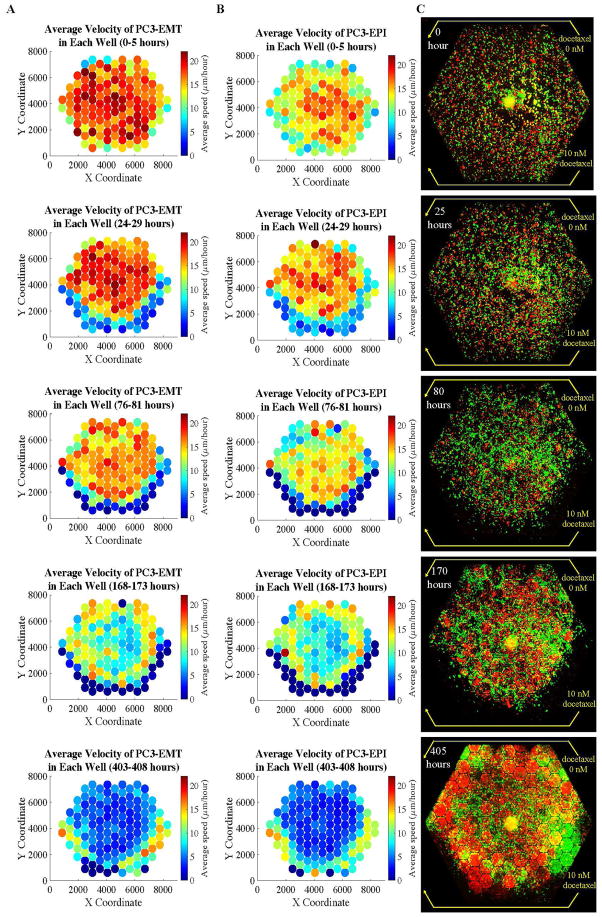
Time-lapse microscopy was performed daily for 41 fields per chip every 30 minutes. Accumulated distance was analyzed using Fiji software (http://fiji.sc) with plugins including Manual Tracking, Chemotaxis and Migration Tool Version, and TrackMate. The result of cell motility and migration in a population consisting of two different subclones of PC3 cells is presented in Fig. 4. With the tracking algorithm, we obtain the velocity of each cell in each time frame. Usually the variance-to-mean ratio of the speed of a single cell is smaller than 1, so we picked the median speed of a single cell as a representative quantity, and took an average of those median speed of cells in each micro-habitat. The distribution of the averaged speed of PC3-EMT and PC3-EPI at different time points is illustrated in Fig. 4 a and b.
FIG. 4. The distribution of velocities and populations of PC3-EPI (red cells) and PC3-EMT (green cells) in the complex ecology with docetaxel gradient.
The experiment was done under the existence of docetaxel gradient across the chip, from 10 nM at the bottom three edges to 0 nM at the top three edges. The distribution of the averaged speed of (A) PC3-EMT and (B) PC3-EPI in each micro-habitat is illustrated as the 2D color-scaled graph. (C) The red and green fluorescent images were taken respectively with 10X objective, stitched and displayed together to show a global view of the distribution of the two cell lines at different time points.
RESULTS AND DISCUSSION
The preliminary experiment presented here shows the potential of this technology. GFP-expressing PC3-EMT and the mCherry-expressing PC3-EPI cell lines were co-cultured in the presence of a 10 nM docetaxel gradient along 3 edges of the array as shown in Fig. 4 C. Previous work from our group [7]. demonstrated PC3-EMT cells inherently migrate faster than PC3-Epi cells with respect to accumulated distance in control conditions, with this experiment we probed our ability not only to quantify that different motility phenotype simultaneously for both sub-populations, but also to determine how the given motility distribution changes for each sub-group over time in the presence of a docetaxel gradient.
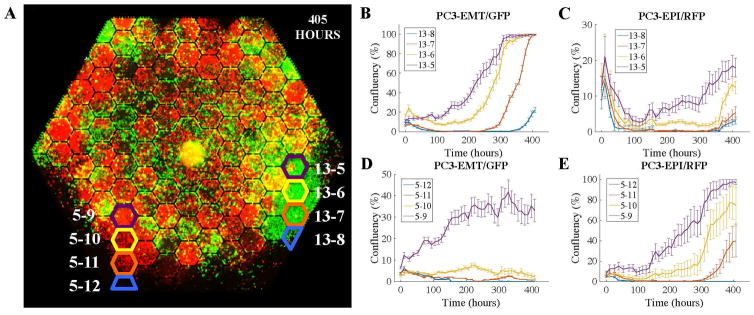
In the first 100 hours, both cell lines died out at the bottom, while the cells in lower-drug region continued to proliferate. A sharp boundary of cells was formed between the living cells and a region cleared of living cells. However, after 150 hours, the population started to expand and reached the high drug concentration zone where the cells died out in the first place. At the end of the experiment, the cells almost occupied the entire chip with a striking patchiness of different cell origins, that is, large red and green clumps (see Fig. 4 C, 405 hours). This may represent a building of niche construction in the complex ecology. The dynamics of the emergence of drug resistance is demonstrated in Fig. 5 where the population of cells at the PC3-EMT-rich plaque and the PC3-EPI-rich plaque was quantified in terms of cell confluency. At both PC3-EMT-rich region (Fig. 5 B and C) and PC3-EPI-rich region (Fig. 5 D and E), PC3-EMT cells died out in the first 100 hours, while the PC3-EPI cells died out within 50 hours. The microhabitats around the periphery were cleared out due to chemotherapy induced cell death, and then refilled by chemotherapy resistant cells in sequence from the lower dosage region into higher dosage region due to collective migration and cell population expansion starting from roughly 200 hours.
FIG. 5. Density of PC3-EMT (green cells) and PC3-EPI (red cells) as a function of time at high docetaxel region.
(A) The rule of labeling. Microhabitat i – j corresponds to the jth hexagon in column i. (B)–(E) The confluency of PC3-EMT and PC3-EPI at the high docetaxel region. The curves show the dynamics of the cells dying out in beginning and the re-emergence of the cells in terms of the variation of population.
The re-emergence of cancer cells at high docetaxel concentration is a evidence of the acquisition of chemotherapy resistance within 10 days. This result mimics the rapid emergence of doxorubicin resistance of multiple myeloma [1] and U87 glioblastoma cells [2] in other related microfluidic devices. Image stacks with high spatial and temporal resolution can be acquired in both fluorescence and bright field channels. The population dynamics of different cell lines can be investigated at a global point of view, while most importantly the behavior of each individual cell were being tracked and monitored throughout the span of the experiment. Events including cell division, cell fusion, cell migration, the change in cell morphology and cell motility are studied at cellular level in real time, and the quantitative analysis of those parameters can be made with respect to different spatial or population division, providing greater perspective to approach the dynamics in a complex ecology with a heterogenous fitness landscape.
One of the key elements to be observed is the migration and proliferation of both epithelial and cells after the rapid fixation in the metapopulation under stress. Time-lapse microscopy was performed daily for 41 fields per chip every 30 minutes. Accumulated distance was analyzed using Fiji software (http://fiji.sc) with plugins including Manual Tracking, Chemotaxis and Migration Tool Version, and TrackMate. The result of cell motility and migration in a population consisting of two different sub-clones of PC3 cells is presented in Fig. 4. With the tracking algorithm, we obtain the velocity of each cell in each time frame. Usually the variance-to- mean ratio of the speed of a single cell is smaller than 1, so we picked the median speed of a single cell as a representative quantity, and took an average of those median speed of cells in each microhabitat. The distribution of the averaged speed of PC3-EMT and PC3-EPI at different time point is illustrated in Fig. 4 A and B.
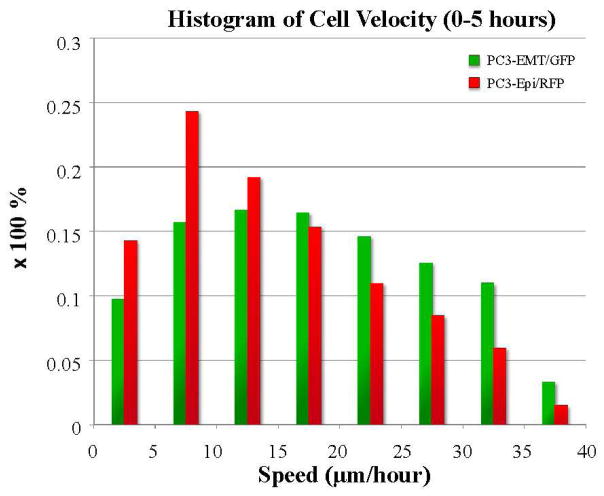
The histograms of velocity of the entire PC3-EPI and PC3-EMT population are demonstrated in Fig. 6. The cell tracking analysis provides further insight into the composition of a subpopulation and their phenotypic expression as a function of time and space. The cellular response to the environmental stress gradient can be monitored in real time in terms of cell morphology and motility. PC3- EMT, a mesenchymal sub-clone of PC3 cells, tends to be more motile than the epithelial phenotype PC3-EPI roughly by a factor of 2, in accordance with the cell motility previously reported by Shiraishi et al. [7]. Both the motility of PC3-EMT and PC3-EPI was uniformly distributed in the beginning. As cells at high-drug region died out, the speed decreased at the edges. When the cells proliferated and aggregated to a higher degree of confluency, the cells started to slow down. After the emergence of docetaxel resistance, the cells moved towards the high-drug region, generating a sharp wavefront of cell migration into the high drug regions.
FIG. 6. The histogram of velocity of PC3-EPI and PC3-EMT.
The velocity of each individual cell was tracked through out the experiment. The median speed of each cell within the first 5 hours of the experiment was selected for the histogram plot. The bar graph shows the differences in cell motility previously described by Shiraishi et al. comparing two different subclones of PC3 cells. [5] PC3-EMT, a mesenchymal subclone of PC3 cells tend to be more motile than the epithelial one PC3-EPI.
Although we have not done this in this experiment, at any time, the thin Lumox™ window allows sampling of the cells or metabolic fluid locally on the device with a micro-translation stage and NanoFil™ syringe pump (World Precision Instruments, Sarasota, FL 34240). The syringe carries 36 G blunt needle, penetrating through the 20 μm-thick Lumox™ membrane, extracting as small as 50 to 100 nL medium from the chip. We may also harvest, subculture and sequence the cells from specific locations and compare the genetic contents and evolution dynamics of cells under different level of environmental stress.
SUMMARY
The preliminary data has demonstrated that the technology presented here is capable of culturing multiple cell types in a heterogeneous micro-environment for up to 2 weeks under stable physical conditions and allows high-resolution real time imaging. The system provides a multifunctional platform that allows the sophisticated adjustment of a time-dependent chemical gradient, ambient gas composition, as well as downstream experiments including the culture of sub-clonal populations and local metabolite extraction and analysis using mass spectrometry. During the experiment, time-lapse scanning image acquisition provides abundant information about the change in cell morphology, population dynamics, cell motility and cell migration over time on a cellular level.
Population dynamics is qualitatively different from single-cell behaviors. The engineered microenvironment device allows at the quantitative study at the single-cell level of signaling dynamics and gene expression by monitoring in real-time the interactions of multiple cell types in response to each other as well as varying environmental conditions over time. This technologyis expected to work as a powerful in vitro model for cancer tumors, and provide a tool for preclinical drug development and screening.
Acknowledgments
We would like to thank fruitful discussions with Donald Coffey, James Frost, Robert Gatenby and Robert Axelrod. This work was supported by NIH grants U54CA163214 (K.J.P.), 1PO1CA093900 (K.J.P.), U01CA143055 (K.J.P.), U54CA143803 (K.J.P, R.H.A), NSF DBI13-58737 (W.M.) and the Prostate Cancer Foundation.
References
- 1.Wu A, Zhang QC, Lambert G, Khin Z, Gatenby RA, Kim HJ, Pourmand N, Bussey K, Davies PCW, Sturm JC, Austin RH. Ancient hot and cold genes and chemotherapy resistance emergence. PNAS. 2015;112(33):10467–10472. doi: 10.1073/pnas.1512396112. [DOI] [PMC free article] [PubMed] [Google Scholar]
- 2.Han Jeonghun, Jun Yukyung, Kim So Hyun, Hoang Hong-Hoa, Jung Yeonjoo, Kim Suyeon, Kim Jaesang, Austin Robert H, Lee Sanghyuk, Park Sungsu. Rapid emergence and mechanisms of resistance by U87 glioblastoma cells to doxorubicin in an in vitro tumor microfluidic ecology. PNAS. 2016;113(50):14283–14288. doi: 10.1073/pnas.1614898113. [DOI] [PMC free article] [PubMed] [Google Scholar]
- 3.Zhang Q, Lambert G, Liao D, Kim H, Robin K, Tung C-K, Pourmand N, Austin RH. Acceleration of Emergence of Bacterial Antibiotic Resistance in Connected Microenvironments. Science. 2011;333:1764– 1767. doi: 10.1126/science.1208747. [DOI] [PubMed] [Google Scholar]
- 4.Zheng Xiaofeng, Carstens Julienne L, Kim Jiha, Scheible Matthew, Kaye Judith, Sugimoto Hikaru, Wu Chia-Chin, LeBleu Valerie S, Kalluri Raghu. Epithelial-to-mesenchymal transition is dispensable for metastasis but induces chemoresistance in pancreatic cancer. Nature. 2015;527:525530. doi: 10.1038/nature16064. [DOI] [PMC free article] [PubMed] [Google Scholar]
- 5.Roca H, et al. Transcription factors OVOL1 and OVOL2 induce the mesenchymal to Epithelial transition in human cancer. PLoS One. 2013;8:e76773. doi: 10.1371/journal.pone.0076773. [DOI] [PMC free article] [PubMed] [Google Scholar]
- 6.Jaqaman, et al. Robust single-particle tracking in live-cell time-lapse sequences. Nature Methods. 2008;5(8) doi: 10.1038/nmeth.1237. [DOI] [PMC free article] [PubMed] [Google Scholar]
- 7.Shiraishi, et al. Glycolysis is the primary bioenergetic pathway for cell motility and cytoskeletal remodeling in human prostate and breast cancer cells. Oncotarget. 2014;6(1) doi: 10.18632/oncotarget.2766. [DOI] [PMC free article] [PubMed] [Google Scholar]
- 8.Zhang, et al. The asparaginyl hydroxylase factor inhibiting HIF-1alpha is an essential regulator of metabolism. Cell Metabolism. 2014;11(5):364–78. doi: 10.1016/j.cmet.2010.03.001. [DOI] [PMC free article] [PubMed] [Google Scholar]


