

Abstract
Background:
Gene expression data are characteristically high dimensional with a small sample size in contrast to the feature size and variability inherent in biological processes that contribute to difficulties in analysis. Selection of highly discriminative features decreases the computational cost and complexity of the classifier and improves its reliability for prediction of a new class of samples.
Methods:
The present study used hybrid particle swarm optimization and genetic algorithms for gene selection and a fuzzy support vector machine (SVM) as the classifier. Fuzzy logic is used to infer the importance of each sample in the training phase and decrease the outlier sensitivity of the system to increase the ability to generalize the classifier. A decision-tree algorithm was applied to the most frequent genes to develop a set of rules for each type of cancer. This improved the abilities of the algorithm by finding the best parameters for the classifier during the training phase without the need for trial-and-error by the user. The proposed approach was tested on four benchmark gene expression profiles.
Results:
Good results have been demonstrated for the proposed algorithm. The classification accuracy for leukemia data is 100%, for colon cancer is 96.67% and for breast cancer is 98%. The results show that the best kernel used in training the SVM classifier is the radial basis function.
Conclusions:
The experimental results show that the proposed algorithm can decrease the dimensionality of the dataset, determine the most informative gene subset, and improve classification accuracy using the optimal parameters of the classifier with no user interface.
Keywords: Cancer classification, fuzzy support vector machine, gene expression, genetic algorithm, particle swarm optimization algorithm
Introduction
The DNA microarray technology allows monitoring of thousands of genes simultaneously in a single experiment. The use of this technology to monitor changes in expression levels of genes among samples can help physicians efficiently and accurately diagnose disease, classify tumors and cancer types, and propose effective treatment procedure. Gene expression is a dynamic process that provides valuable knowledge about biological networks and cellular states. The expression level of each gene indicates the activation and transcription of that gene in cell states.
The gene expression pattern of a cell or a tissue determines the structure and function of that cell or tissue. On a microarray chip, the number of genes are exceeding more than a thousand, in contrast of small number of samples. Thus, the curse of dimensionality, noisiness, and stochastic nature of this data are major problems that arise in microarray data analysis and lead to many data mining and machine learning challenges.[1,2,3,4] Determination of a small subset of relevant genes in a given dataset as a solution for high-dimensional problem can improve the classification accuracy.[3,4] Furthermore, the problem of stability can be tackled using other biological databases and bioinformatics tools such as protein–protein interaction and pathway databases.[4,5]
Several methods have been proposed for informative gene selection and classification. The Taguchi-genetic algorithm (GA) and Taguchi-particle swarm optimization (PSO) use correlation-based feature selection and are hybrid methods where k-NN serves as a classifier[6,7,8] and Shen et al.[9] used a modified PSO and a support vector machine (SVM). Li et al.[10] and Hernandeze et al.[11] developed a hybrid GA and SVM model. Tong and Schierz developed a hybrid GA and a neural network classifier[12] and Li et al. and Yang et al.[13,14] used k-NN to apply to microarray data. Chuang et al.[15] proposed improved PSO and used the k-NN method for tumor classification. Shen et al.[16] developed a hybrid PSO and Tabu search with LDA classification for cancer classification.
Martinez et al.[17] proposed an algorithm based on swarm intelligence feature selection. Lee and Leu[18] used a GA with dynamic parameter settings, a Chi-square test for homogeneity and SVM for cancer classification. Alba et al.[19] combined a PSO and a GA individually with a SVM to find small samples of informative genes. Zhenyu et al.[20] proposed a multiple kernel SVM-based data mining and knowledge discovery system. Wang and Simon[21] used single genes to create classification models such as k-NN, SVM, and the random forest models. Shah and Kusiak[22] developed an integrated algorithm involving a GA and correlation-based heuristics for data preprocessing and a decision tree and SVM to make predictions. Chuang et al.[23] and Mao et al.[24] applied fuzzy SVMs to gene expression profiles to classify multiple cancer types. Ng and Chan[25] combined an information-theoretic approach with sequential forward floating searches and a decision tree. Yeh et al.[26] applied a GA and decision tree to build a model of selected genes. In,[27] hybrid PSO and GA algorithms are used as a feature selection method and also, in,[28] a novel-weighted SVM based on PSO are used for gene selection and tumor classification are applied on gene expression data. Chu and Wang[29] used principal component analysis, a class separability measure, the Fisher's ratio and t-test for gene selection and a voting scheme for multigroup classification using a binary SVM.
The present study used a hybrid GA and PSO algorithm as the feature selection method. The fitness function of each gene subset was determined using the fuzzy support vector machine (FSVM) classifier. The use of fuzzy logic in the SVM training phase decreased the effect of redundant noisy data by determining the importance of each sample in the training stage. The t-test method was initially used to preprocess the original gene expression data and the proposed hybrid method was then applied to select the most important subsets of genes using 10-fold cross validation. The 10-fold cross-validation accuracy of each gene subset was the evaluation criteria. One purpose of this study was to increase the classification accuracy by selecting the best parameters for a classifier using the proposed hybrid PSO/GA/FSVM algorithm without need for user trial and error. The use of a suitable combination of optimization algorithms for feature selection and selection of the proper model for the classifier improve classification results to allow accurate prediction of blind test samples.
Materials and Methods
The proposed method was evaluated using four public microarray datasets. There are several types of blood cancer and it is important to distinguish between them. The first dataset comprised 72 samples of acute lymphoblastic leukemia (ALL) and mixed lineage leukemia (MLL) cancer types with 12582 genes by Armstrong Scott.[30] The second dataset comprised 72 samples of ALL and acute myeloid leukemia (AML) cancer types with 7129 genes by Golub et al.[31] The third dataset generated by Alon et al.[32] contains the expression of 2000 genes in 62 samples for normal and colon tumor tissues. The last dataset comprised 49 samples with 7129 genes by West.[33] Table 1 provides the details of the datasets.
Table 1.
Datasets which used for testing the efficiency of proposed method

Genetic algorithm and particle swarm optimization
A GA is a computational optimization method that searches all parts of a solution space using different groups of feature subsets to find the best answer. The initial population is generated randomly, and then, all chromosomes are evaluated using a fitness function. The GA operators are selection, crossover, and mutation. The crossover operator creates new population by combining two chromosomes, depending on the selection operator. The crossover operator in a GA can eliminate fragmentation and genetic variation in the population. Mutation is another operator that creates a variety of solutions. The process continues to the last generation in which the best fitness is satisfied. PSO, like GA, is an algorithm inspired by the social behavior of birds in a flock.[34] This algorithm was developed by Eberhart and Kennedy.[35] In PSO, each particle moves in the search space at a velocity that is adjusted using its own memory and its neighbors’ experiences. The fitness values are obtained using a fitness function.
Support vector machine
In machine learning and data mining tasks, SVMs are supervised learning algorithms associated with learning models that are used for classification and regression analysis problems. The current standard incarnation was proposed by Cortes and Vapnik.[36] SVM is specifically designed for two-class analysis problems.
Let data set  I = 1, n, be, where Xi is the set of training samples and yi are the associated labels. Each yi can take one of two values (+1 or −1) depending the class.[36,37] In the linear case, classification of new data can be done by using the following formula:

Where C is the soft margin constant parameter with an upper bound in the Lagrange multipliers. For the nonlinear case, SVM transforms the input data into higher dimensional feature space using a kernel function, so it can be solved as a separable case. With the use of a kernel function, the optimization problem becomes:


Where C is the soft margin constant parameter with an upper bound in the Lagrange multipliers. The most familiar kernel functions are:
Linear kernel function  polynomial kernel function
  (p: degree), Gaussian kernel function
  (σ: Standard deviation) and sigmoid kernel function
  (β0: Slope and β1: Intercept constant).
The Gaussian kernel is one of the most useful functions and the common SVM kernel can be used in different kinds of problems. Each kernel function has its own parameters and the related parameters must be properly set to increase classification accuracy.[38]
Proposed algorithm
The proposed algorithm is a combination of the GA and PSO algorithms. The goal is to combine the properties of both algorithms by integration of GA operators into the PSO algorithm. The main difference between GA and PSO is that there are no crossovers and mutation operators in PSO; thus, it is more likely to be caught in a local minimum. The best particle in PSO can be remembered and so that it has an effect on other particles. This property increases convergence.[39,40,41,42] The hybrid PSO/GA requires the following 11 steps.
Step 1
Step 1 is the preparation of data by filtering and normalization. Most genes in databases are not useful and do not have the desired patterns for analysis of microarray data. These genes must be removed because: (a) their expression value is very low; (b) they show little change in expression value in whole samples; (c) they have low standard deviations and do not substantially change around the mean expression value and; (d) they have low information entropy. The t-test can then be used to examine the data to select the top-ranked genes and apply them as an input to the hybrid PSO/GA system.
Step 2
The initial values of each parameter used in the algorithm are set as shown in Table 2.
Table 2.
Parameters in particle swarm optimization genetic algorithm

Step 3
Step 3 is to create the initial population. At first, a population with N chromosomes is randomly generated. Primary binary initialization is applied so that (1) denotes the existence of a feature in the training system and (0) denotes the absence of that feature. The lengths of the particles or chromosomes are determined by adding the number of features selected based on a statistical method (segment 1) and the 17 additional genes used to determine the optimal parameters of a classifier in the hybrid algorithm.
Table 3 shows the details of the subparts (segment 2 through segment 6). Subparts 1 and 2 contain 2 bits of chromosome that determines the type of kernel function as linear, polynomial, a radial basis function (RBF), or sigmoid. The third subpart (5 bits) represents values of C (penalty factor), which lie between 0.1 and 100000. The fourth subpart (6 bits) determines the RBF kernel parameter, which is between 0.001 and 0.128. The fifth segment (2 bits) represents the value of polynomial kernel parameter (d), which can be 1, 2, 3, or 4. The sixth segment (2 bits) represents the value of the sigmoid kernel parameter, which can be 1, 2, 3, or 4.[43]
Table 3.
A sample chromosome of particle swarm optimization genetic algorithm/fuzzy support vector machine population

Step 4
In this step, the fitness values for all particles are calculated to determine the functionality of each particle; this is called validation of particles. The data are divided into training and evaluation parts using 10-fold cross-validation as input for the cost function. This step is carried out for every particle to determine it as either a training or testing particle based on the selected features that exist in that particle.
The importance of each sample in the SVM training phase is examined. Standard SVM assumes that the training samples occur in pairs, such as (xi, yi) and yi∈ (−1, +1) next, the importance of each sample is considered in each pair as (xi, yi, si) where si denotes the level of importance of each sample. The membership degree of sample X is assigned rather than its class, which can be achieved by a slight alteration of the main formula as:

The difference between standard SVM and FSVM is the upper limit of the Lagrange multipliers; ai in FSVM equals siC, while this value in SVM equals C. Next, the membership is computed for si of each sample xi rather than the class.
Lin and Wang[44] obtained the value of si from the ratio of the distance of the sample from the center of the class to the distance of the farthest sample in same class from the center of the class. This method is sensitive to outliers and is not suitable for this kind of problem. The proposed method computes the weight and importance of each sample as:

Where ε is a small value equal to 0.001 and μ,  are the mean vector and covariance matrix of the sample class, respectively. For simplicity and to decrease computation, the covariance matrix is assumed to be a diagonal matrix. Using this method and entering the extent of each sample in the training phase decrease the effect of outliers by multiplication of each sample weight in the sample error.[45]
Step 5
Update the best particle as g,best and the best personal memories of each particle xi,best with the velocity and position of the particles as:

In a binary algorithm, velocity is defined as a change in the means of probability and the velocity is explained by the probability of being in position 1.[46] Velocity is considered to be between 0 and 1, which explains the probability of being in position 1. The velocity is calculated using Eq. 8 and by mapping the values of 0 and 1 by limiting the sigmoid function. The final position of particle (i) is determined as:

σ is a random number with uniform distribution in the range of 0 and 1.
To increase the velocity of divergence of the system, the limitation of velocity in the system must be considered based on maximum and minimum velocity. The roulette wheel approach has been used for selection in the proposed method. After the steps for parent selection, the steps executes the genetic operators commence. Single point, double point, and uniform crossover by random probability are used to benefit these crossover methods simultaneously.
Step 6
Again evaluate the amount of the fitness function.
Step 7
Combine the offspring and sort them based on the fitness value. Then, select the best parents using the elitism method and a defined population size.
Step 8
Go back to step 5 and repeat the steps until the termination condition is reached. The termination condition is the number of generations.
Step 9
When there is no further progress, the best features with the best parameters for the classifier have been selected. These features and parameters can be applied to a blind test with no interference in the training and validation phases.
Step 10
Determine the occurrence frequency of each feature in the whole process. On average, biomarkers that have been repeated more than 6 times in the best locations are reported.
Step 11
The rules can be found using the best features extracted by the decision-tree algorithm. Figure 1 is a flowchart of the process. This flowchart summarizes how the system works and the relationships between the feature selection method and the classifier.
Figure 1.

Hybrid algorithm flowchart (particle swarm optimization/genetic algorithm/fuzzy support vector machine)
Results
The accuracy, sensitivity, precision, and specificity values were evaluated by applying the proposed algorithm to four public data sets. These values are statistical indicators for evaluation of binary classification. The goal is to find the best possible combination and compare this modified algorithm with others methods. Tables 4 and 5 show the result of application of the algorithm to the databases. Proportional to the number of samples in each database, 5–60 genes were selected and the hybrid algorithm was applied to them. All algorithms were implemented in MATLAB and LIBSVM software.
Table 4.
The results of applying hybrid (particle swarm optimization/genetic algorithm) to support vector machine classifier

Table 5.
The results of applying hybrid (particle swarm optimization/genetic algorithm) to fuzzy support vector machine classifier

This section introduces the biomarkers obtained using the hybrid algorithm. The results indicate the good performance of algorithm for finding small subsets of features with high accuracy by decreasing the effect of outliers and noisy data and finding good similarity between these biomarkers and the biomarkers introduced by others in the literature.
Discussion and Analysis of Results
To investigate the accuracy of the proposed PSO/GA/FSVM hybrid algorithm, the results were examined in greater detail. Figure 2 shows the most frequent genes identified while running the algorithm with 10-fold cross-validation to determine which genes occurred more frequently in each database. Figure 2a shows the results for leukemia cancer types (ALL, AML), where 25 biomarkers were selected by the proposed hybrid algorithm. The most frequent genes selected comprised 19 genes for cancer types ALL and MLL in Figure 2b, 14 genes for colon cancer in Figure 2c and 18 genes for breast cancer in Figure 2d. All these genes repeated more than 6 times in the 10 runs of the algorithm.
Figure 2.

Occurrence frequency of genes by hybrid particle swarm optimization/genetic algorithm/fuzzy support vector machine algorithm with 10-fold cross validation. (a) Acute lymphoblastic leukemia, acute myeloid leukemia (b) acute lymphoblastic leukemia, mixed lineage leukemia (c) colon cancer (d) breast cancer
A heat map was used to examine the biomarkers as a graphical representation of the changes in the behavior of the genes in the dataset. For example, it is desirable for the behavior of genes in cancer samples to be similar to one another and different from healthy samples. One group of genes may exhibit with low expression in normal samples and another group may exhibit high expression in normal samples. These genes can interact to aid in the accurate separation of cancer samples from normal samples.
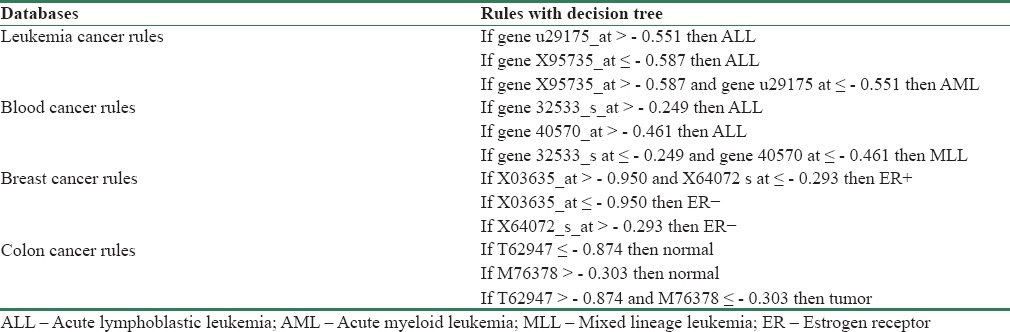
Figure 3 shows heatmaps of two types of leukemia [Figure 3a and b, colon [Figure 3c] and breast cancer [Figure 3d]. The red denotes values above the mean, black denotes the mean, and green denotes values below the mean of a gene across all columns. The decision-tree algorithm was applied to biomarkers obtained using the proposed hybrid approach to find rules in common to them. Several criteria are specified to determine features or traits, including information gain, gain ratio, and the Gini index. The C5.0 decision-tree algorithm by SPSS Clementine 12 software[47] was employed.(4-SPSS clementine is a software package used for logical batched and non-batched statistical analysis which was acquired by IBM in 2009). Table 6 shows the rules discovered using the hybrid PSOGA/FSVM. Three rules with 93% accuracy were found using 10-fold cross-validation on the blood cancer types (ALL, MLL). Classification was performed using the u29175 and X95735 genes. Gene X95735 has high expression in AML samples; gene u29175 has low expression in this cancer type (AML). The table also shows the rules for the other databases for blood cancer types ALL and MLL, breast cancer, and colon cancer. The classification accuracy for the cancer data and for highly ranked genes was 93%, 89%, and 80%, respectively.
Figure 3.

Heatmaps on 4 cancer data show the differences behavior of genes in 2 classes of data. (a-d) the result for leukemia cancer in types acute lymphoblastic leukemia and mixed lineage leukemia, acute lymphoblastic leukemia and acute myeloid leukemia, colon, and breast cancer data, respectively
Table 6.
Extracted rules by decision tree on 4 cancer database
Comparisons were made between the proposed algorithm and other algorithms. Table 7 shows the results of the comparison based on classification accuracy.
Table 7.
Summarizes results and comparison with literatures

The paper[48] by the same authors employed a multilayer perceptron (MLP) for the classification. However, the running procedure of algorithm takes more time than the FSVM and SVM classifier. One of the advantages of the FSVM classifier is its high speed in running procedure. In MLP classifier, all the samples have the same weight in training phase; but in second paper, we use FSVM as the classifier and the importance of each sample in training phase.
The extracted biomarkers from the proposed algorithm and those reported in other studies which were present in Tables 8 and Table 9 were also compared. For blood cancer types ALL and MLL, the proposed algorithm found 24 biomarkers; 11 were the same as biomarkers from Armstrong. The biomarkers that were common for blood cancer were 36678, 34699, 33305, 32579, 41710, 32533, 33412, 32749, 37027, 2036, and 40570. For the ALL and AML cancers, the algorithm found 19 biomarkers, 11 of which were the same as those presented by Golub et al. These common biomarkers were X17042, U50136, X95735, M55150, M92287, U29175, M31211, M16038, U05259, M31303, and M31523.
Table 8.
Discovered biomarkers for leukemia and blood cancer (acute lymphoblastic leukemia, acute myeloid leukemia, mixed lineage leukemia)
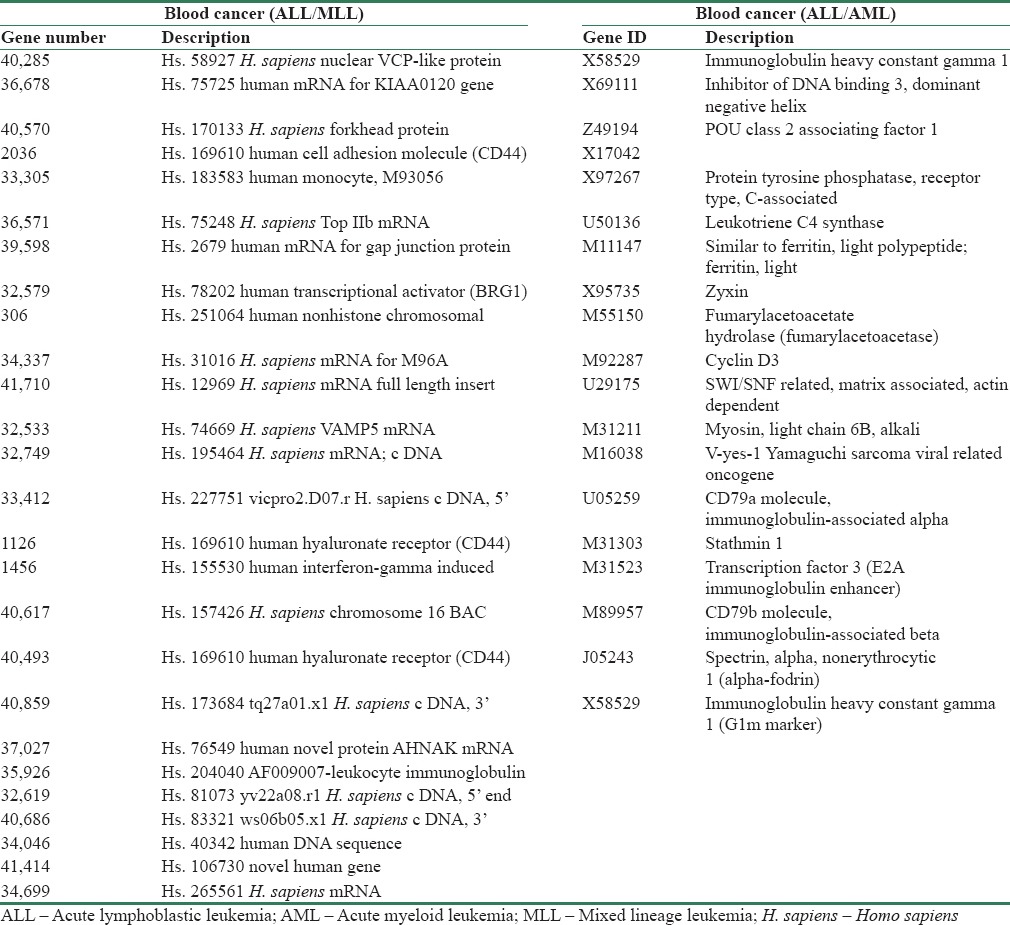
Table 9.
Discovered biomarkers for colon and breast cancer by particle swarm optimization/genetic algorithm/fuzzy support vector machine

For breast and colon cancer, 7 out of 18 biomarkers were in common with the results presented by West for breast cancer and 3 out of 14 were in common for colon cancer with the results presented by Alon et al. The biomarkers in common for breast cancer were M35851, X52003, X58072, X14474, U95740, U68385, and U22376. The biomarkers in common for colon cancer were T57619, T58861, and X55715.
Conclusions
The results of the present study provide a comprehensive comparison of the proposed algorithm and those from previously published sources. The proposed algorithm is a hybrid of PSO and GA with FSVM classifier. This classifier has the ability to enter the importance of each sample into training of the system for further prediction without the need for trial-and-error to determine classifier parameters. Good results have been demonstrated for the proposed algorithm. The classification accuracy for leukemia data is 100%, for colon cancer is 96.67%, and for breast cancer is 98%. These results are better than the others works because the algorithm can determine the training parameters and small feature subsets in the databases perfectly with no user interface. The results show that the best kernel used in training the SVM classifier is the RBF.
Financial support and sponsorship
None.
Conflicts of interest
There are no conflicts of interest.
References
- 1.Schena M, Shalon D, Davis RW, Brown PO. Quantitative monitoring of gene expression patterns with a complementary DNA microarray. Science. 1995;270:467–70. doi: 10.1126/science.270.5235.467. [DOI] [PubMed] [Google Scholar]
- 2.Schena M, Shalon D, Heller R, Chai A, Brown PO, Davis RW, et al. Parallel human genome analysis: Microarray-based expression monitoring of 1000 genes. Proc Natl Acad Sci U S A. 1996;93:10614–9. doi: 10.1073/pnas.93.20.10614. [DOI] [PMC free article] [PubMed] [Google Scholar]
- 3.Dehnavi AM, Sehhati MR, Rabbani H. Hybrid method for prediction of metastasis in breast cancer patients using gene expression signals. J Med Signals Sens. 2013;3:79–86. [PMC free article] [PubMed] [Google Scholar]
- 4.Sehhati MR, Dehnavi AM, Rabbani H, Javanmard SH. Using protein interaction database and support vector machines to improve gene signatures for prediction of breast cancer recurrence. J Med Signals Sens. 2013;3:87–93. [PMC free article] [PubMed] [Google Scholar]
- 5.Sehhati M, Mehridehnavi A, Rabbani H, Pourhossein M. Stable gene signature selection for prediction of breast cancer recurrence using joint mutual information. IEEE/ACM Trans Comput Biol Bioinform. 2015;12:1440–8. doi: 10.1109/TCBB.2015.2407407. [DOI] [PubMed] [Google Scholar]
- 6.Chuang LY, Yang CH, Wu KC, Yang CH. A hybrid feature selection method for DNA microarray data. Comput Biol Med. 2011;41:228–37. doi: 10.1016/j.compbiomed.2011.02.004. [DOI] [PubMed] [Google Scholar]
- 7.Chuang LY, Yang CS, Wu KC, Yang CH. Gene selection and classification using Taguchi chaotic binary particle swarm optimization. Expert Syst Appl. 2011;38:13367–77. [Google Scholar]
- 8.Shen Q, Mei Z, Ye BX. Simultaneous genes and training samples selection by modified particle swarm optimization for gene expression data classification. Comput Biol Med. 2009;39:646–9. doi: 10.1016/j.compbiomed.2009.04.008. [DOI] [PubMed] [Google Scholar]
- 9.Shen Q, Shi WM, Kong W, Ye BX. A combination of modified particle swarm optimization algorithm and support vector machine for gene selection and tumor classification. Talanta. 2007;71:1679–83. doi: 10.1016/j.talanta.2006.07.047. [DOI] [PubMed] [Google Scholar]
- 10.Li L, Jiang W, Li X, Moser KL, Guo Z, Du L, et al. A robust hybrid between genetic algorithm and support vector machine for extracting an optimal feature gene subset. Genomics. 2005;85:16–23. doi: 10.1016/j.ygeno.2004.09.007. [DOI] [PubMed] [Google Scholar]
- 11.Hernandez Montiel LA, Huerta EB, Caporal RM. A multiple-filter-GA-SVM method for dimension reduction and classification of DNA-microarray data. Rev Mex Ing Biomed. 2011;32:32–9. [Google Scholar]
- 12.Tong DL, Schierz AC. Hybrid genetic algorithm-neural network: Feature extraction for unpreprocessed microarray data. Artif Intell Med. 2011;53:47–56. doi: 10.1016/j.artmed.2011.06.008. [DOI] [PubMed] [Google Scholar]
- 13.Li L, Weinberg CR, Darden TA, Pedersen LG. Gene selection for sample classification based on gene expression data: Study of sensitivity to choice of parameters of the GA/KNN method. Bioinformatics. 2001;17:1131–42. doi: 10.1093/bioinformatics/17.12.1131. [DOI] [PubMed] [Google Scholar]
- 14.Yang CH, Chuang LY, Yang CH. A hybrid filter/wrapper method for feature selection of microarray data. J Med Biol Eng. 2009;30:23–8. [Google Scholar]
- 15.Chuang LY, Chang HW, Tu CJ, Yang CH. Improved binary PSO for feature selection using gene expression data. Comput Biol Chem. 2008;32:29–37. doi: 10.1016/j.compbiolchem.2007.09.005. [DOI] [PubMed] [Google Scholar]
- 16.Shen Q, Shi WM, Kong W. Hybrid particle swarm optimization and tabu search approach for selecting genes for tumor classification using gene expression data. Comput Biol Chem. 2008;32:52–9. doi: 10.1016/j.compbiolchem.2007.10.001. [DOI] [PubMed] [Google Scholar]
- 17.Martinez E, Alvarez MM, Trevino V. Compact cancer biomarkers discovery using a swarm intelligence feature selection algorithm. Comput Biol Chem. 2010;34:244–50. doi: 10.1016/j.compbiolchem.2010.08.003. [DOI] [PubMed] [Google Scholar]
- 18.Lee CP, Leu Y. A novel hybrid feature selection method for microarray data analysis. Appl Soft Comput. 2011;11:208–13. [Google Scholar]
- 19.Alba E, Garcıa-Nieto J, Jourdan L, Talbi EG. IEEE 2007 Congress on Evolutionary Computation. Singapore: IEEE; 2007. Gene selection in cancer classification using PSO/SVM and GA/SVM Hybrid Algorithms; pp. 284–90. [Google Scholar]
- 20.Zhenyu C, Jianping L, Liwei W, Weixuan Xu, Yong SH. Multiple-kernel SVM based multiple-task oriented data mining system for gene expression data analysis. Expert Syst Appl. 2011;38:12151–9. [Google Scholar]
- 21.Wang X, Simon R. Microarray-based cancer prediction using single genes. BMC Bioinformatics. 2011;12:391. doi: 10.1186/1471-2105-12-391. [DOI] [PMC free article] [PubMed] [Google Scholar]
- 22.Shah S, Kusiak A. Cancer gene search with data-mining and genetic algorithms. Comput Biol Med. 2007;37:251–61. doi: 10.1016/j.compbiomed.2006.01.007. [DOI] [PubMed] [Google Scholar]
- 23.Chuang LY, Yang CH, Jin LC. Classification of multiple cancer types using fuzzy support vector machines and outlier detection methods. Biomed Eng Appl Basis Commun. 2005;17:300–8. [Google Scholar]
- 24.Mao Y, Zhou X, Pi D, Sun Y, Wong ST. Multiclass cancer classification by using fuzzy support vector machine and binary decision tree with gene selection. J Biomed Biotechnol. 2005;2005:160–71. doi: 10.1155/JBB.2005.160. [DOI] [PMC free article] [PubMed] [Google Scholar]
- 25.Ng M, Chan L. IEEE 2005 Workshop on Machine Learning for Signal Processing. Mystic, CT: IEEE; 2005. Informative gene discovery for cancer classification from microarray expression data; pp. 393–8. [Google Scholar]
- 26.Yeh JY, Wu TS, Wu MC, Chang DM. IEEE 2007 International Conference on Convergence Information Technology. Gyeongju: IEEE; 2008. Applying data mining techniques for cancer classification from gene expression data; pp. 703–8. [Google Scholar]
- 27.Li S, Wu X, Tan M. Gene selection using hybrid particle swarm optimization and genetic algorithm. Soft Comput. 2008;12:1039–48. [Google Scholar]
- 28.Abdi MJ, Hosseini SM, Rezghi M. A novel weighted support vector machine based on particle swarm optimization for gene selection and tumor classification. Comput Math Methods Med. 2012;2012:320698. doi: 10.1155/2012/320698. [DOI] [PMC free article] [PubMed] [Google Scholar]
- 29.Chu F, Wang L. Applications of support vector machines to cancer classification with microarray data. Int J Neural Syst. 2005;15:475–84. doi: 10.1142/S0129065705000396. [DOI] [PubMed] [Google Scholar]
- 30.Armstrong SA, Staunton JE, Silverman LB, Pieters R, den Boer ML, Minden MD, et al. MLL translocations specify a distinct gene expression profile that distinguishes a unique leukemia. Nat Genet. 2002;30:41–7. doi: 10.1038/ng765. [DOI] [PubMed] [Google Scholar]
- 31.Golub TR, Slonim DK, Tamayo P, Huard C, Gaasenbeek M, Mesirov JP, et al. Molecular classification of cancer: Class discovery and class prediction by gene expression monitoring. Science. 1999;286:531–7. doi: 10.1126/science.286.5439.531. [DOI] [PubMed] [Google Scholar]
- 32.Alon U, Barkai N, Notterman DA, Gish K, Ybarra S, Mack D, et al. Broad patterns of gene expression revealed by clustering analysis of tumor and normal colon tissues probed by oligonucleotide arrays. Proc Natl Acad Sci U S A. 1999;96:6745–50. doi: 10.1073/pnas.96.12.6745. [DOI] [PMC free article] [PubMed] [Google Scholar]
- 33.West M, Blanchette C, Dressman H, Huang E, Ishida S, Spang R, et al. Predicting the clinical status of human breast cancer by using gene expression profiles. Proc Natl Acad Sci U S A. 2001;98:11462–7. doi: 10.1073/pnas.201162998. [DOI] [PMC free article] [PubMed] [Google Scholar]
- 34.Boyd R, Richerson PJ. Culture and the Evolutionary Process. USA: The University of Chicago; 1985. [Google Scholar]
- 35.Eberhart R, Kennedy J. IEEE 1995 Proceeding of 6th International Symposium on Micro Machine and Human Science. Nagoya: IEEE; 1995. A new optimizer using particle swarm theory; pp. 39–43. [Google Scholar]
- 36.Cortes C, Vapnik V. Support vector networks. Mach Learn. 1995;20:273–9. [Google Scholar]
- 37.Burges CJ. A tutorial on support vector machines for pattern recognition. Data Min Knowl Discov. 1998;2:121–67. [Google Scholar]
- 38.Han J, Kamber M, Pei J. 3rd ed. Waltham, MA, USA: Elsevier Morgan Kaufmann; 2011. Data Mining, Concept and Techniques. [Google Scholar]
- 39.Kao YT, Zahara E. A hybrid genetic algorithm and particle swarm optimization for multimodal functions. Appl Soft Comput. 2008;8:849–57. [Google Scholar]
- 40.Du S, Li W, Cao K. IEEE 2006 Proceedings of the 6th World Congress on Intelligent Control and Automation. Dalian, China: IEEE; 2006. A learning algorithm of artificial neural network based on GA–PSO; pp. 3633–7. [Google Scholar]
- 41.Juang CF. A hybrid of genetic algorithm and particle swarm optimization for recurrent network design. IEEE Transactions on Systems, Man and Cybernetics Part B (34). 2004 IEEE International Joint Conference on Neural Networks. 2004:997–1006. doi: 10.1109/tsmcb.2003.818557. [DOI] [PubMed] [Google Scholar]
- 42.Robinson J, Sinton S, Yahya RS. IEEE 2002 Antennas and Propagation Society International Symposium. San Antonio: IEEE; 2002. Particle swarm, genetic algorithm, and their hybrids; pp. 314–7. [Google Scholar]
- 43.Avci E. Selecting of the optimal feature subset and kernel parameters in digital modulation classification by using hybrid genetic algorithm–support vector machines: HGASVM. Expert Syst Appl. 2009;36:1391–402. [Google Scholar]
- 44.Lin CF, Wang SD. Fuzzy support vector machines. IEEE Trans Neural Netw. 2002;13:464–71. doi: 10.1109/72.991432. [DOI] [PubMed] [Google Scholar]
- 45.Kaboodiyan J, Moradi MH. Iran: Ferdosi Mashhad University; 2004. Yek Machine Bordare Poshtibane Fyzzy Jadid ba Fuzzy Sazi dar do Marhaleh. Proc 12th Conference of Electrical Engineering. [Google Scholar]
- 46.Kennedy J, Eberhart RC. IEEE 1997 International Conference on Computational Cybernetics and Simulation. Orlando, FL: IEEE; 1997. A discrete binary version of the particle swarm algorithm; pp. 4104–9. [Google Scholar]
- 47.Quinlan JR. San Francisco, CA: Morgan Kaufmann Publishers Inc; 1993. C4.5: Programs for Machine Learning. [Google Scholar]
- 48.Moteghaed NY, Maghooli K, Pirhadi S, Garshasbi M. Biomarker discovery based on hybrid optimization algorithm and artificial neural networks on microarray data for cancer classification. J Med Signals Sens. 2015;5:88–96. [PMC free article] [PubMed] [Google Scholar]