

Understanding how antipsychotics exert their effects would allow the development of new treatments and the identification of response markers in psychosis. Crossley et al. show that the global organization of white matter tracts predicts response to treatment. Individuals with a more efficiently wired connectome tend to show better responses.
Keywords: connectome, DTI, schizophrenia, first-episode psychosis, antipsychotics
Abstract
Connectomic approaches using diffusion tensor imaging have contributed to our understanding of brain changes in psychosis, and could provide further insights into the neural mechanisms underlying response to antipsychotic treatment. We here studied the brain network organization in patients at their first episode of psychosis, evaluating whether connectome-based descriptions of brain networks predict response to treatment, and whether they change after treatment. Seventy-six patients with a first episode of psychosis and 74 healthy controls were included. Thirty-three patients were classified as responders after 12 weeks of antipsychotic treatment. Baseline brain structural networks were built using whole-brain diffusion tensor imaging tractography, and analysed using graph analysis and network-based statistics to explore baseline characteristics of patients who subsequently responded to treatment. A subgroup of 43 patients was rescanned at the 12-week follow-up, to study connectomic changes over time in relation to treatment response. At baseline, those subjects who subsequently responded to treatment, compared to those that did not, showed higher global efficiency in their structural connectomes, a network configuration that theoretically facilitates the flow of information. We did not find specific connectomic changes related to treatment response after 12 weeks of treatment. Our data suggest that patients who have an efficiently-wired connectome at first onset of psychosis show a better subsequent response to antipsychotics. However, response is not accompanied by specific structural changes over time detectable with this method.
Introduction
There is a pressing need for clinically useful prognostic markers (Kapur et al., 2012) and alternative treatments (Tregellas, 2014) for psychosis. Understanding how brain structure is related to response to treatment, and to the changes treatment induces in the brain, could help address these needs.
Previous structural MRI studies have explored the effect of antipsychotics, the treatment most commonly used in psychosis, on the brain. Studies in patients with chronic schizophrenia have shown that a cumulative exposure to antipsychotic medication is associated with a generalized reduction in grey and white matter volumes, particularly in frontal and temporal areas (Ho et al., 2011; van Haren et al., 2011). However, studying the effect of medication in patients who have been chronically unwell makes it difficult to differentiate the effect of treatment from a potential effect of the disease itself. An alternative approach is to study the changes caused by antipsychotics in patients with a first episode of psychosis after their first treatment with medication. Diffusion tensor imaging (DTI) approaches have shown to be sensitive enough to pick up white matter changes induced by learning of a new skill after a short period of training (Scholz et al., 2009; Schlegel et al., 2012), opening the possibility to study acute brain changes induced by medication. Indeed, studies in first episode patients have reported localized decreases (Wang et al., 2013; Szeszko et al., 2014) but also increases (Reis Marques et al., 2014) in fractional anisotropy throughout the brain after 6 to 12 weeks of antipsychotic treatment. So far studies have focused on localized changes in brain structure. It is still unclear whether treatment affects the overall organization of the network (Fornito et al., 2015).
A comprehensive understanding of the effects of treatment should also investigate brain characteristics that may be related to response. These markers may be directly linked to antipsychotic response, facilitating their action, or signal the existence of indirectly related characteristics which indicate a better prognosis. Supporting the presence of such markers, our previous work has shown that reduced cortical gyrification at illness onset, possibly reflecting an abnormal neurodevelopment, and fractional anisotropy reductions in the cingulum, uncinate, and corpus callosum, predict later poor response to treatment (Palaniyappan et al., 2013; Reis Marques et al., 2014). It is still not clear whether these small changes might be signalling a global difference in the brain network organization related to treatment response.
In contrast with these approaches that study localized brain changes, network science has highlighted the need to understand the brain as a network of interacting elements (Bullmore and Sporns, 2009), proposing a clear research agenda aimed at mapping all structural brain connections or connectome (Sporns et al., 2005; Sporns, 2013). Understanding this interconnected network is particularly important for brain disorders, as even localized pathological processes would eventually spread or affect the rest of the network (Fornito et al., 2015). This novel approach has contributed in integrating the brain abnormalities commonly observed in schizophrenia (Wright et al., 1999; Honea et al., 2005) into a biological model that could help explain the underlying pathological process (Fornito et al., 2012). For example, patients with schizophrenia have been found to have a less efficiently wired brain compared to controls (Zalesky et al., 2011; Wang et al., 2012; Zhang et al., 2015), where information or nerve impulses have to travel on average longer distances to reach another brain region than in controls (after accounting for brain size), with structural changes concentrated in the highly connected fronto-temporal hub regions (van den Heuvel et al., 2010, 2013; Crossley et al., 2014; Griffa et al., 2015).
We here argue that treatment in psychosis is unlikely to have just a localized effect in an interconnected brain network (Kellendonk et al., 2006; Howes and Kapur, 2009), and therefore a connectomic approach is needed to understand its mechanism of action. We thus present a network approach to explore the whole-brain structural interactions between regions, as inferred from DTI tractography, that may allow therapeutic effect to emerge and how these may be modified over time. Our objectives were 2-fold: (i) to examine, at illness onset, the network characteristics that predict subsequent response to treatment; and (ii) to explore the network changes after 12 weeks of treatment. We studied patients with a first psychotic episode, as this minimizes the potential confounders of prior exposure to antipsychotic treatment and the effect of chronicity. To our knowledge, this is the first attempt to explore connectomic correlates of subsequent treatment response and the changes associated with treatment. Based on previous literature describing reduced brain efficiency and frontotemporal hub abnormalities in schizophrenia, we hypothesized that (i) the structural network in patients who subsequently respond to treatment, in contrast to those who do not, would be more efficiently-wired at baseline; and (ii) those patients would undergo changes in frontotemporal regions in response to treatment that would increase its efficiency at follow-up.
Materials and methods
Patients in their first-episode of psychosis were recruited from the South London and Maudsley National Health Service Foundation Trust, London UK, as part of the larger Genetics and Psychosis (GAP) study (Di Forti et al., 2014). Healthy controls were recruited from the same catchment area. Details of the assessment are described in the Supplementary material. Ethical permission was obtained from the Institute of Psychiatry, Psychology and Neuroscience Ethics Committee, and written informed consent obtained from all participants.
Patients underwent two clinical and MRI assessments: the first as soon as possible after their first contact with services, and the second 12 weeks later. Healthy controls were scanned at baseline only. The Positive and Negative Symptoms in Schizophrenia (PANSS) scale was used to evaluate treatment response at the 12-week follow-up, using an adaptation of the Remission criteria of the Schizophrenia Working Group Consensus (Andreasen et al., 2005). These criteria identify an absolute threshold in severity, with patients being defined as responders to treatment if they had a final score of mild or less (PANSS item scores of ≤ 3) simultaneously on eight core symptoms of the PANSS.
DTI preprocessing and reconstruction of white matter tracts
Diffusion data were acquired on a 3 T GE Signa-HDx scanner. A multi-slice peripherally-gated doubly refocused spin echo-echo planar imaging sequence was used. Sixty contiguous near-axial slice locations with isotropic (2.4 × 2.4 × 2.4 mm) voxels were acquired, with a maximum diffusion-weighting of 1300 s/mm2, echo time of 104.5 ms, and repetition time between 12–20 R–R intervals on a cardiac-gated acquisition. Four volumes with no diffusion gradients applied were obtained, alongside with 32 diffusion-weighted images with gradient directions uniformly distributed in space. After automated quality control of the data (Simmons et al., 1999), and correction for movement and eddy currents, whole-brain tractography was performed using the Fiber Assignment by Continuous Tracking (FACT) algorithm (Basser et al., 2000), terminating if encountering an angle of more than 30° or a fractional anisotropy value <0.2.
Network construction and analysis
Graph analysis is based on the definition of a network composed of interacting elements, represented as nodes of a graph, and their interaction by the links or edges between them (Fig. 1A). We defined as nodes 401 similarly-sized regions covering the whole brain, excluding the cerebellum, as described in the Supplementary material. We highlight that regions of interest were similarly sized, avoiding larger regions to have more tracts terminating on them because of their larger surface. We then used DTI to inform the connections between the different brain regions or nodes. Following previous studies (Zalesky et al., 2011; van den Heuvel et al., 2013), we used the number of reconstructed tracts or streamlines connecting pairs of regions as a measure of the strength of the structural connectivity. We chose this metric as a measure of connection strength since it has been validated against axonal tracers in animal studies (van den Heuvel et al., 2015a; Donahue et al., 2016), and has been related to cytoarchitectonic abnormalities in cortical layer 3 of schizophrenia patients (van den Heuvel et al., 2015b). We used the number of streamlines as a weight for each network link, building a weighted graph.
Figure 1.

Summary of the methods used. (A) The structural brain network was modelled as a graph where nodes were defined by 401 similarly-sized brain regions, and the links inferred from streamlines reconstructed from DTI data connecting every pair of regions. (B) All analyses used a general linear model (GLM) and focused on three factors: being a patient, response, and antipsychotic dose for the 12-week follow-up scan. Network-based statistic was used to identify subsets of connections (linked subnetworks) that were related to one of the factors. Graph analysis was used to identify global configuration properties related to the studied factors, focusing on global and local efficiency (both metrics based on shortest-paths) and degree and strength of the nodes.
We then looked at brain differences from an anatomical perspective and a network perspective (Fig. 1B). All analyses used a general linear model (GLM) approach, focusing on response to medication, and effect of medication at follow-up. The latter specifically explored whether changes were related to the cumulative dose of antipsychotic received. We also included in our model the effect of being a patient or control, the presence of a presentation with affective symptoms, age and gender, to control for their potential effect. We briefly report differences related to being a patient or control as a way to link our results with the previous cross-sectional connectomic literature on psychosis (Zalesky et al., 2011; van den Heuvel et al., 2013; Griffa et al., 2015). Further details of the GLM approach used can be found in the Supplementary material.
To look at anatomical differences related to future response and exposure to medication, we applied a network-based statistic approach (NBS) (Zalesky et al., 2010a). This method avoids the multiple comparison problem encountered when looking at differences between many connections by using information from the spatial clustering of the abnormalities. Our statistical comparison was obtained from a linear model exploring how being a patient or control, responding to treatment, or antipsychotic dose, explained the number of streamlines in each edge, or the change in streamlines at follow-up. We here report groups of regions connected by connections significantly modulated by one of these factors (k-value of 0.005), which are larger than expected by chance. Further details about the NBS analysis performed can be found in the Supplementary material.
To provide information about the position in the network where the abnormalities identified in the NBS analyses were found, we first built a ‘normative’ connectome of healthy subjects. We did this by drawing an edge where the probability of at least a streamline connecting two regions in healthy controls was higher than P < 0.001 false discovery rate corrected. We then weighted the connections giving them the average number of streamlines existing between the two regions examined. The resulting network had a heavy-tailed degree distribution, as well as a rich-club organization. The latter was determined by looking at the probability of high-degree hubs being themselves interconnected by the strongest connections or larger number of streamlines (Opsahl et al., 2008), and comparing this with a null model (Rubinov and Sporns, 2011). For purposes of this analysis, we defined as rich-club nodes those belonging to the top 20 percentile of highly connected regions (82 regions). We selected this threshold as it is the point in the curve where the normalized rich-club coefficient increases (slope of the curve becoming steeper). Connections linking rich-club nodes were defined as ‘rich-club connections’; those connecting rich-club nodes to peripheral nodes, ‘feeder connections’; finally, connections between peripheral nodes were defined as ‘peripheral connections’.
Alongside this anatomical approach, we also explored global brain differences related to being a patient, future response or exposure to medication. We first looked at total number of streamlines, again applying a GLM approach with the factors described above. We also looked at several configuration parameters of the structural brain network. We were particularly interested in looking at configuration differences that were not due to an overall lower level of connectivity, particularly considering previous studies showing that patients with schizophrenia have lower number of reconstructed DTI streamlines (van den Heuvel et al., 2010; Zalesky et al., 2011). We therefore included the total number of streamlines as a covariate to highlight the organizational aspects. We specifically explored the following graph-analytic parameters for each weighted network built for each subject (Rubinov and Sporns, 2010): (i) global efficiency: the mean of the inverse of the shortest path between all nodes (Latora and Marchiori, 2001), which explores how efficiently information flows in the network; (ii) local efficiency: the mean of the inverse of the shortest paths between neighbours of a node, where neighbours are the nodes connected with a direct link (Latora and Marchiori, 2001). It describes the resilience of the network to potential nodal failures, as the links between neighbours of a node determine how information will flow in the network after its removal; (iii) nodal degree: the number of neighbours each node is connected to. This is a measure of how central a node is in a network; and (iv) nodal strength: the total number of streamlines connecting to a node. Another measure of centrality of a node, with the number of streamlines arguably providing information about its capacity to transfer information.
While local and global efficiency describe characteristics of the whole network, nodal degree and strength were defined for each of the 401 nodes (brain regions). This posed a multiple comparison problem, and therefore we report differences at P < 0.05 false discovery rate corrected.
Results
Participant characteristics
A total of 76 first-episode psychosis patients and 74 healthy controls had a baseline MRI assessment and were included. We obtained a second MRI at 12 weeks in 43 patients. The sociodemographic and clinical characteristics of the sample are presented in Table 1, and further characteristics have been previously reported (Reis Marques et al., 2014). There was a higher proportion of female in controls and trend-level significance for controls being younger. All analyses covary for these demographic variables. There were no statistically significant differences in epidemiological and clinical characteristics between the sample of patients with a baseline and follow-up MRI and those who had only a baseline scan (Supplementary Table 1).
Table 1.
Demographics and clinical characteristics of subjects included
| Healthy controls | Patients | Comparison | |
|---|---|---|---|
| n | 74 | 76 | |
| Age at baseline [mean (SD)] | 25.9 (6.4) | 28.1 (8.5) | P = 0.07 |
| (t-test) | |||
| Gender (% female) | 60.8 | 30.3 | P < 0.0002 |
| (χ2 14.2, df = 1) | |||
| Education: | |||
| Incomplete | 1.4% | 9.2% | P < 0.0015 |
| Completed school, | 30.1% | 48.7% | (χ2 12.2, df = 2) |
| Further education | 68.5% | 42.1% | |
| Total PANSS baseline (SD) | N.A | 58.4 (13.9) | |
| Duration of untreated psychosis, median days (IQR) | N.A | 52.5 (17–219) | |
| Cumulative antipsychotic dose received at baseline, mean chlorpromazine equivalents (SD) | N.A | 9524 (12 803) | |
| Presence of affective symptoms (%) | N.A | 42.1 | |
| Response to antipsychotic treatment (%) | N.A | 43.4 |
df = degrees of freedom; N.A = not applicable; PANSS = Positive and Negative Syndrome Scale.
After 3 months of treatment, 33 patients were classified as responders at 12 weeks and 43 as non-responders. Supplementary Table 2 shows the characteristics of the two groups. Patients who did not respond differed from those who responded in their education, being more likely to have incomplete schooling and less likely to go onto further education. However, we did not find differences in estimated premorbid IQ. In line with previous studies (Marshall et al., 2005), patients who did not respond had a longer duration of untreated psychosis (median of 62 days compared to 42), although this was not statistically significant (P = 0.12, Wilcoxon rank-sum test).
Connectome differences at baseline in patients versus controls
In line with other connectomic studies (van den Heuvel et al., 2010; Zalesky et al., 2011), patients had a lower total number of streamlines than controls (P < 0.005, GLM, Supplementary Fig. 1), with decreases in an extended network of 68 regions (P < 0.01, NBS with k = 0.005, Fig. 2A). Echoing suggestions that high-degree regions in the healthy connectome are disease hotspots (Crossley et al., 2014), the identified network was composed of regions that were highly connected in healthy controls, with a median degree almost 50% higher than a null model with a similarly-sized abnormal network, but composed of regions randomly chosen (P < 10−5 permutation tests; Fig. 2B). The healthy connectome also followed a rich-club configuration (Fig. 2C), and abnormalities in first episode were over-represented in the connections linking rich-club nodes of the network (Fig. 2D). In other words, early psychosis was related to abnormalities of a distributed brain network of regions which, in health, are highly connected and are members of a rich-club.
Figure 2.

Network characteristics differentiating patients and controls. (A) Network with reduced streamlines in patients compared to controls, including midline structures such as the cingulum, medial frontal regions and precuneus; striatal and pallidal regions; right caudate; left orbital and dorsolateral frontal cortex, as well as right insula; bilateral lateral occipital; left parahippocampal region, right inferior and middle temporal gyrus. (B) Median centrality in health of the abnormal network compared to the median centrality of similarly-sized networks built by randomly selecting regions. (C) The connectomes in healthy subjects followed a rich-club organization, with highly connected hubs concentrating the strongest links. The anatomical locations of the 82 regions considered part of this group are shown on the right. Connections between these rich-club nodes were more frequently affected in schizophrenia (D).
In terms of global network organization, controlling for the total number of streamlines (different between groups), there were no differences between patients and controls in local or global efficiency. Similarly, no significant differences in nodal degree or strength were found.
Connectome correlates of subsequent treatment response
We then addressed the first main objective of our study, examining whether there was any brain difference at baseline that could signal a future response to antipsychotics.
We found that responders and non-responders differed in terms of global network organization. Subjects who subsequently responded to treatment had a structural network with higher global efficiency at baseline compared to non-responders (P = 0.022; Fig. 3 and Supplementary Fig. 2). There was also a trend-level higher local efficiency in responders (P = 0.054) compared to non-responders.
Figure 3.
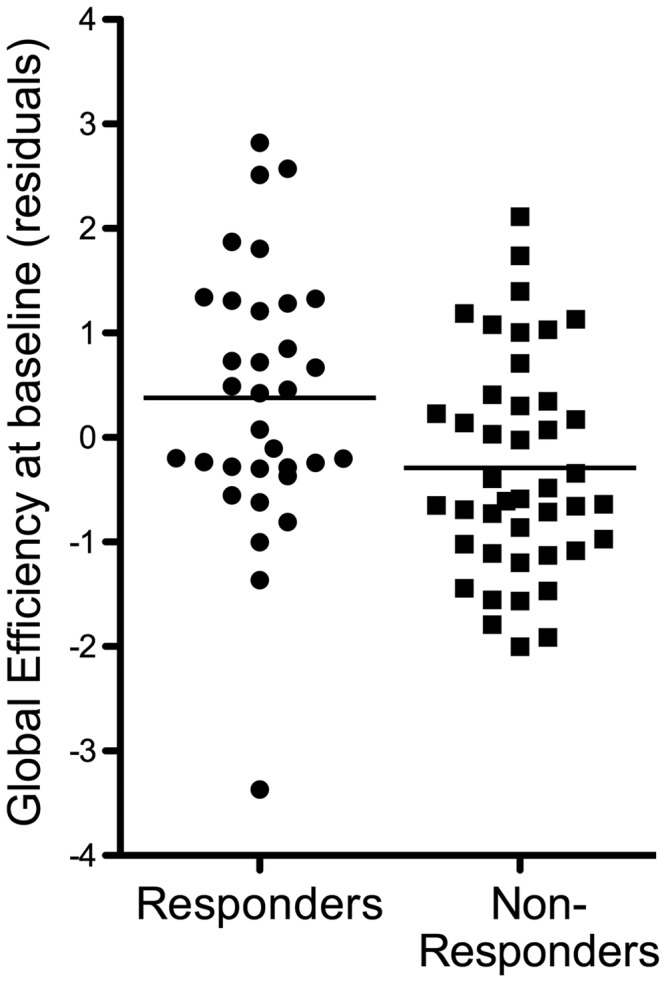
Baseline connectomic organization in patients and subsequent response. Plot showing whole-brain global efficiency in both groups of patients. Effect size is equivalent to a Cohen’s d of 0.57.
In contrast, we found no differences between responders and non-responders in the total number of streamlines at baseline (P = 0.21, Supplementary Fig. 1), or anatomically localized changes in streamline numbers (as per NBS). There were no significant differences in the role of specific brain regions in the network, as measured by their degree and strength.
Connectomic changes after antipsychotic treatment
The subgroup of 43 patients scanned after 12 weeks of treatment showed a significant increase in the total number of streamlines compared to their baseline (paired t-test, P = 0.042; Fig 4A and Supplementary Fig. 1). Our NBS analysis did not find any anatomically localized groups of connected regions that presented a significant increase in streamlines, suggesting that the observed increase is not driven by anatomically consistent changes in just one network. In fact, the NBS analysis showed a statistically significant localized decrease in streamlines in the left cingulum (Fig. 4B). As such, streamlines generally tend to increase after treatment, with the exception of this anatomically localized decrease. Changes in localized or total number of streamlines were not related to response to treatment or dose of medication received.
Figure 4.
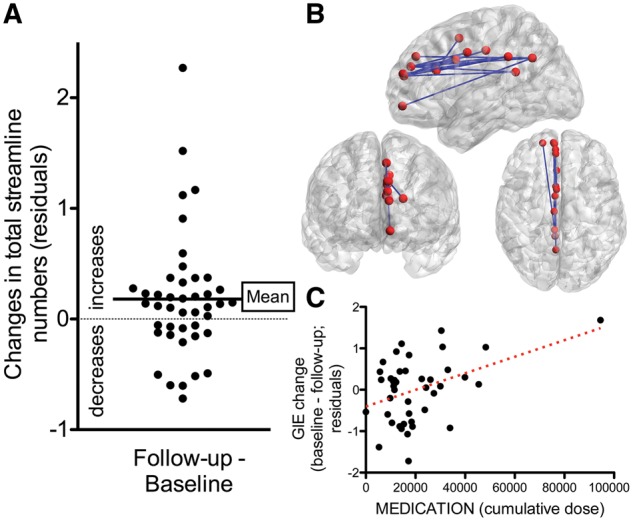
Connectomic changes after treatment. (A) There was a global increase in number of streamlines (controlled for other variables). (B) Alongside a global increase, there was a localized decrease in a network in the left cingulate, shown in anatomical space. (C) Relationship between antipsychotic dose received in the 3-month period, and changes in global efficiency. Cumulative dose is measured in chlorpromazine equivalents. Note that the significant relationship is partly driven by an outlier subject who received high doses of antipsychotics.
We then explored whether the observed changes in streamline numbers with treatment were also accompanied by configuration changes in the brain network. We did not find any significant changes over the follow-up period in the global network configuration in the whole group, with no significant differences in global efficiency or local efficiency between baseline and follow-up (paired t-tests, P = 0.27 and P = 0.9, respectively). There were no significant changes in the centrality of regions at follow-up either (degree or strength).
We initially hypothesized that global changes (specifically, a connectome becoming more efficient) would have only occurred in those who responded to treatment, which might have explained the observed lack of significant configuration changes in the whole group. However, there was no statistically significant effect of response on global or local efficiency changes. Similarly, there were no significant changes at follow-up in the centrality of the regions (degree and strength at P < 0.01) in relation to response. In other words, we did not find any significant network reorganization in response to treatment in both responders and non-responders.
Dose of antipsychotics received in the 12-week period was negatively related to changes in global efficiency (P < 0.007; Fig. 4C). Subjects receiving higher doses of antipsychotics were more likely to present decreases in global efficiency at 12-week follow-up. However, this relationship was strongly driven by one outlier subject who received high doses of medication. While the direction of the effect remained after this subject was excluded, it was no longer statistically significant (P = 0.11, GLM). Patients who responded and those who did not respond received a similar cumulative dose of antipsychotics (P = 0.6, t-test).
Discussion
We here used a connectomic approach exploring, for the first time, the relationship between therapeutic response and an interconnected brain network. We found that patients who subsequently respond to treatment show, at illness onset, a more globally efficiently wired structural brain network. Contrary to our initial hypothesis, we did not find specific changes in brain network organization related to response to treatment at 12-week follow-up. Echoing previous findings in chronic schizophrenia patients (van den Heuvel et al., 2010; Zalesky et al., 2011), we also found distributed abnormalities in first-episode patients compared to controls. These abnormalities were over-represented in the rich-club of highly connected hubs. This finding contributes to the growing data implicating these regions and their connections in the pathophysiology of schizophrenia (van den Heuvel et al., 2013; Klauser et al., 2016), and in line with studies in subjects at risk of psychosis (Collin et al., 2014; Schmidt et al., 2016), it suggests that they are present at an early stage of the disorder.
Neuroimaging markers of future treatment response
We have previously reported structural neuroimaging markers of future treatment response in this same sample, particularly highlighting reduced cortical folding in several regions (Palaniyappan et al., 2013) and reduced fractional anisotropy in their tracts (Reis Marques et al., 2014) as markers of poor response. Building on these localized results, we here show that the overall organization of the white matter tracts differs according to response. One could hypothesize that the previously reported localized fractional anisotropy changes were the voxel-level correlate of this global difference in brain organization. However, it is also possible that differences in the global configuration are due to distributed changes that vary in their location across subjects, and would not be detected by voxel-based methods of analyses. The fact that no localized differences related to response were identified with our NBS analysis also supports this. We previously suggested in the ‘Introduction’ section that changes in fronto-temporal hubs would be related to worse global efficiency in non-responders. Our results did not confirm this hypothesis, because localized changes in hubs were identified in all patients, not only those who did not respond (and had lower global efficiency). Thus, predictions of response based on a global efficiency measure could provide extra independent predictive information complementing inferences based on localized differences.
What does the higher global efficiency observed in responders mean? Network science would suggest that the higher global efficiency we found in patients who go on to respond to treatment would provide the system with shorter paths to transfer information throughout the network, making it easier and faster for information to flow. This theoretical inference receives some support from neuroimaging studies relating global efficiency to cognitive function in healthy subjects (Li et al., 2009; van den Heuvel et al., 2009). Our results of a higher global efficiency in responders resonate with the clinical observation that patients who respond to antipsychotic medication have better premorbid functioning (Perkins et al., 2004; Levine and Rabinowitz, 2010; Crespo-Facorro et al., 2013). Indeed, patients who responded had a better premorbid functioning, at least as indexed by their educational history. However, their estimated premorbid IQ was not significantly different between the two groups (Supplementary Table 2). A previous study failed to find a significant correlation between global efficiency and IQ in patients (Zalesky et al., 2011), finding it only in their cohort of healthy controls. As such, the relationship between IQ and efficiency in schizophrenia is likely to be complex. Future studies would need to clarify whether higher global efficiency in the brain connectome of patients could be the biological mechanism mediating the relationship between good premorbid functioning and treatment response. Other clinical variables not explored in this study might also be related to global efficiency and the better response to treatment, such as insight or compliance with medication.
Patients also presented a significant decrease in the number of streamlines reconstructed compared to controls. We controlled for this when assessing the global efficiency. One should keep this in mind when looking at the theoretical functioning of the brain network in patients, since less streamlines (total connectivity) would make the system less efficient to transfer information. As such, patients already have a brain network with weaker connections in which information could have more difficulties spreading; on top of that, connections in non-responders are inefficiently wired. However, all these interpretations are based on network-theory inferences on abstract networks. It is unclear whether all these insights about network functioning, including our main outcome of network efficiency, would apply to the biological instantiation of the network in the brain.
Connectomic changes following treatment
Patients underwent an increase in the total number of streamlines after the 12-week treatment period, with localized decreases in the left cingulum. These findings mirror our previous DTI results, showing that across the 12-week follow-up period there was an increase in fractional anisotropy of a large network in all subjects (Reis Marques et al., 2014). Considering that patients had a lower total number of streamlines than controls at baseline, one could see the increase with treatment as an indication of ‘brain normalization’. However, the increase was not related to response to treatment. In fact, contrary to our initial hypothesis, none of the observed longitudinal changes in the connectome differed in patients who responded and those who did not. Treatment was associated with similar brain changes in both responders and non-responders. It is possible that 12 weeks is too short a time period to observe structural response-related changes. As was previously mentioned in the introduction, DTI studies in first episode patients have shown response-specific changes in anisotropy measures after treatment (Reis Marques et al., 2014). Our measure of structural connectivity is related to fractional anisotropy, with streamlines terminating if finding a fractional anisotropy value below a prespecified cut-off. However, it is possible that it is not very sensitive to changes in fractional anisotropy, with differences between groups probably arising from changes in the direction of the tracts and their overall organization. The number of streamlines has been shown to reflect the pathophysiology of schizophrenia, specifically correlating with changes in spine density of cortical layer 3 (van den Heuvel et al., 2015b). Interestingly, this same study suggested that this macroscopic/microscopic relationship was specific to streamline counts, and not to the average fractional anisotropy of the tracts studied. Overall, although streamline counts appear to be an interesting parameter to study in schizophrenia, it is still unclear whether its changes occur in the very early stages of the disorder, specifically in the first 3 months. Future longer follow-up may clarify this.
Cumulative antipsychotics dose in the 12-week period was associated with a reduction in global efficiency at follow-up. However, these results were strongly driven by one outlier subject who received high doses of medication. Interestingly, previous graph-analytic studies using functional MRI in healthy controls have shown a reduced global efficiency after a single antipsychotic dose (Achard and Bullmore, 2007) and a dopamine depletion challenge (Carbonell et al., 2014). One could argue that although the subject might be a numerical outlier, it is biologically plausible that a non-specific blockade of an important neuromodulatory system mediating cortico-subcortical regions (Cole et al., 2013) could have a negative effect on the overall functioning of the system.
A limitation of our study is its observational design, where medication type and dose were not standardized. As such, some of the variance explained by dose of medication received might be due the presence of a more severe disorder. A significant number of patients with a first psychotic episode respond to antipsychotic medication after 12 weeks (Robinson et al., 1999). As such the group classified as non-responder would include late responders. Another limitation stems from the difficulties in defining antipsychotic response in clinical trials (Leucht et al., 2007). Using remission as the outcome studied has the advantage of being difficult to argue that it is not a ‘clinically relevant’ improvement, but at the cost of missing out important improvements in patients who did not totally achieve remission. Patients were minimally medicated, but were not antipsychotic naïve at the baseline assessment. We did not scan the healthy controls at follow-up, which would have shed light on the observed changes in patients at 12 weeks and the stability of our measures. Our longitudinal design also suffered from a number of patients not having a second scan. Reassuringly, their baseline characteristics were similar to those that were scanned. Connectomic approaches have themselves several limitations, ranging from the choice of template used (Zalesky et al., 2010b), to the meaning of structural connectivity as number of streamlines (Jones et al., 2013). They are based on the coarse characterization of connectivity obtained from diffusion MRI. Several approaches are trying to overcome this, providing whole-brain connectivity information in the healthy brain at a mesoscale level (Amunts et al., 2013).
In conclusion, our study suggests that baseline characteristics of the structural brain organization are important for future response to treatment, and that there is a lack of differential connectomic changes according to response.
Funding
This work was supported by the National Institute for Health Research (NIHR) Mental Health Biomedical Research Centre at South London and Maudsley NHS Foundation Trust and the Institute of Psychiatry, Psychology and Neuroscience, King’s College London. The views expressed are those of the authors and not necessarily those of the NHS, the NIHR or the Department of Health. The study was also partially supported by a King’s College London Translational Research Grant to P.D. N.A.C. received support from the Chilean CONICYT (PIA ACT1414 and FONDECYT 1160736). T.R.M. and P.D.’s research are supported by NARSAD. T.M., C.C., M.D. and P.D. were funded partly by the Psychiatry Research Trust.
Conflict of interest
A. David has received honoraria for lectures from Janssen and has served on advisory boards for Eli Lilly and Novartis. S. Kapur has received grant support from (in alphabetical order) AstraZeneca, Bristol-Myers Squibb, and GlaxoSmithKline and has served as a consultant and/or speaker for AstraZeneca, Bioline, Bristol-Myers Squibb–Otsuka, Eli Lilly, Janssen, Lundbeck, NeuroSearch, Pfizer, Roche, Servier, and Solvay-Wyeth. R. Murray has received honoraria for lectures from Janssen, Astra-Zeneca, Lilly, Novartis, and BMS. The following authors report no potential conflict of interest: N. Crossley, TR. Marques, H. Taylor, C. Chaddock, F. Dell’Acqua, A. Reinders, V. Mondelli, M. DiForti, A. Simmons, C. Pariante and P. Dazzan.
Supplementary material
Supplementary material is available at Brain online.
Supplementary Material
Glossary
Abbreviations
- DTI
diffusion tensor imaging
- NBS
network-based statistic
References
- Achard S, Bullmore E. Efficiency and cost of economical brain functional networks. PLoS Comput Biol 2007; 3: e17. [DOI] [PMC free article] [PubMed] [Google Scholar]
- Amunts K, Lepage C, Borgeat L, Mohlberg H, Dickscheid T, Rousseau ME, et al. BigBrain: an ultrahigh-resolution 3D human brain model. Science 2013; 340: 1472–5. [DOI] [PubMed] [Google Scholar]
- Andreasen NC, Carpenter WT Jr Kane JM, Lasser RA, Marder SR, Weinberger DR. Remission in schizophrenia: proposed criteria and rationale for consensus. Am J Psychiatry 2005; 162: 441–9. [DOI] [PubMed] [Google Scholar]
- Basser PJ, Pajevic S, Pierpaoli C, Duda J, Aldroubi A. In vivo fiber tractography using DT-MRI data. Magn Reson Med 2000; 44: 625–32. [DOI] [PubMed] [Google Scholar]
- Bullmore E, Sporns O. Complex brain networks: graph theoretical analysis of structural and functional systems. Nat Rev Neurosci 2009; 10: 186–98. [DOI] [PubMed] [Google Scholar]
- Carbonell F, Nagano-Saito A, Leyton M, Cisek P, Benkelfat C, He Y, et al. Dopamine precursor depletion impairs structure and efficiency of resting state brain functional networks. Neuropharmacology 2014; 84: 90–100. [DOI] [PubMed] [Google Scholar]
- Cole DM, Oei NY, Soeter RP, Both S, van Gerven JM, Rombouts SA, et al. Dopamine-dependent architecture of cortico-subcortical network connectivity. Cereb Cortex 2013; 23: 1509–16. [DOI] [PubMed] [Google Scholar]
- Collin G, Kahn RS, de Reus MA, Cahn W, van den Heuvel MP. Impaired rich club connectivity in unaffected siblings of schizophrenia patients. Schizophr Bull 2014; 40: 438–48. [DOI] [PMC free article] [PubMed] [Google Scholar]
- Crespo-Facorro B, de la Foz VO, Ayesa-Arriola R, Perez-Iglesias R, Mata I, Suarez-Pinilla P, et al. Prediction of acute clinical response following a first episode of non affective psychosis: results of a cohort of 375 patients from the Spanish PAFIP study. Prog Neuropsychopharmacol Biol Psychiatry 2013; 44: 162–7. [DOI] [PubMed] [Google Scholar]
- Crossley NA, Mechelli A, Scott J, Carletti F, Fox PT, McGuire P, et al. The hubs of the human connectome are generally implicated in the anatomy of brain disorders. Brain 2014; 137(Pt 8): 2382–95. [DOI] [PMC free article] [PubMed] [Google Scholar]
- Di Forti M, Sallis H, Allegri F, Trotta A, Ferraro L, Stilo SA, et al. Daily use, especially of high-potency cannabis, drives the earlier onset of psychosis in cannabis users. Schizophr Bull 2014; 40: 1509–17. [DOI] [PMC free article] [PubMed] [Google Scholar]
- Donahue CJ, Sotiropoulos SN, Jbabdi S, Hernandez-Fernandez M, Behrens TE, Dyrby TB, et al. Using diffusion tractography to predict cortical connection strength and distance: a quantitative comparison with tracers in the monkey. J Neurosci 2016; 36: 6758–70. [DOI] [PMC free article] [PubMed] [Google Scholar]
- Fornito A, Zalesky A, Breakspear M. The connectomics of brain disorders. Nat Rev Neurosci 2015; 16: 159–72. [DOI] [PubMed] [Google Scholar]
- Fornito A, Zalesky A, Pantelis C, Bullmore ET. Schizophrenia, neuroimaging and connectomics. Neuroimage 2012; 62: 2296–314. [DOI] [PubMed] [Google Scholar]
- Griffa A, Baumann PS, Ferrari C, Do KQ, Conus P, Thiran JP, et al. Characterizing the connectome in schizophrenia with diffusion spectrum imaging. Hum Brain Mapp 2015; 36: 354–66. [DOI] [PMC free article] [PubMed] [Google Scholar]
- Ho BC, Andreasen NC, Ziebell S, Pierson R, Magnotta V. Long-term antipsychotic treatment and brain volumes: a longitudinal study of first-episode schizophrenia. Arch Gen Psychiatry 2011; 68: 128–37. [DOI] [PMC free article] [PubMed] [Google Scholar]
- Honea R, Crow TJ, Passingham D, Mackay CE. Regional deficits in brain volume in schizophrenia: a meta-analysis of voxel-based morphometry studies. Am J Psychiatry 2005; 162: 2233–45. [DOI] [PubMed] [Google Scholar]
- Howes OD, Kapur S. The dopamine hypothesis of schizophrenia: version III–the final common pathway. Schizophr Bull 2009; 35: 549–62. [DOI] [PMC free article] [PubMed] [Google Scholar]
- Jones DK, Knosche TR, Turner R. White matter integrity, fiber count, and other fallacies: the do's and don'ts of diffusion MRI. Neuroimage 2013; 73: 239–54. [DOI] [PubMed] [Google Scholar]
- Kapur S, Phillips AG, Insel TR. Why has it taken so long for biological psychiatry to develop clinical tests and what to do about it? Mol Psychiatry 2012; 17: 1174–9. [DOI] [PubMed] [Google Scholar]
- Kellendonk C, Simpson EH, Polan HJ, Malleret G, Vronskaya S, Winiger V, et al. Transient and selective overexpression of dopamine D2 receptors in the striatum causes persistent abnormalities in prefrontal cortex functioning. Neuron 2006; 49: 603–15. [DOI] [PubMed] [Google Scholar]
- Klauser P, Baker ST, Cropley VL, Bousman C, Fornito A, Cocchi L, et al. White matter disruptions in schizophrenia are spatially widespread and topologically converge on brain network hubs. Schizophr Bull 2016, in press. [Epub ahead of print] p.i.i. sbw100. [DOI] [PMC free article] [PubMed] [Google Scholar]
- Latora V, Marchiori M. Efficient behavior of small-world networks. Phys Rev Lett 2001; 87: 198701. [DOI] [PubMed] [Google Scholar]
- Leucht S, Davis JM, Engel RR, Kane JM, Wagenpfeil S. Defining ‘response' in antipsychotic drug trials: recommendations for the use of scale-derived cutoffs. Neuropsychopharmacology 2007; 32: 1903–10. [DOI] [PubMed] [Google Scholar]
- Levine SZ, Rabinowitz J. Trajectories and antecedents of treatment response over time in early-episode psychosis. Schizophr Bull 2010; 36: 624–32. [DOI] [PMC free article] [PubMed] [Google Scholar]
- Li Y, Liu Y, Li J, Qin W, Li K, Yu C, et al. Brain anatomical network and intelligence. PLoS Comput Biol 2009; 5: e1000395. [DOI] [PMC free article] [PubMed] [Google Scholar]
- Marshall M, Lewis S, Lockwood A, Drake R, Jones P, Croudace T. Association between duration of untreated psychosis and outcome in cohorts of first-episode patients: a systematic review. Arch Gen Psychiatry 2005; 62: 975–83. [DOI] [PubMed] [Google Scholar]
- Opsahl T, Colizza V, Panzarasa P, Ramasco JJ. Prominence and control: the weighted rich-club effect. Phys Rev Lett 2008; 101: 168702. [DOI] [PubMed] [Google Scholar]
- Palaniyappan L, Marques TR, Taylor H, Handley R, Mondelli V, Bonaccorso S, et al. Cortical folding defects as markers of poor treatment response in first-episode psychosis. JAMA Psychiatry 2013; 70: 1031–40. [DOI] [PMC free article] [PubMed] [Google Scholar]
- Perkins D, Lieberman J, Gu H, Tohen M, McEvoy J, Green A, et al. Predictors of antipsychotic treatment response in patients with first-episode schizophrenia, schizoaffective and schizophreniform disorders. Br J Psychiatry 2004; 185: 18–24. [DOI] [PubMed] [Google Scholar]
- Reis Marques T, Taylor H, Chaddock C, Dell'acqua F, Handley R, Reinders AA, et al. White matter integrity as a predictor of response to treatment in first episode psychosis. Brain 2014; 137(Pt 1): 172–82. [DOI] [PMC free article] [PubMed] [Google Scholar]
- Robinson DG, Woerner MG, Alvir JM, Geisler S, Koreen A, Sheitman B, et al. Predictors of treatment response from a first episode of schizophrenia or schizoaffective disorder. Am J Psychiatry 1999; 156: 544–9. [DOI] [PubMed] [Google Scholar]
- Rubinov M, Sporns O. Complex network measures of brain connectivity: uses and interpretations. Neuroimage 2010; 52: 1059–69. [DOI] [PubMed] [Google Scholar]
- Rubinov M, Sporns O. Weight-conserving characterization of complex functional brain networks. Neuroimage 2011; 56: 2068–79. [DOI] [PubMed] [Google Scholar]
- Schlegel AA, Rudelson JJ, Tse PU. White matter structure changes as adults learn a second language. J Cogn Neurosci 2012; 24: 1664–70. [DOI] [PubMed] [Google Scholar]
- Schmidt A, Crossley NA, Harrisberger F, Smieskova R, Lenz C, Riecher-Rossler A, et al. Structural network disorganization in subjects at clinical high risk for psychosis. Schizophr Bull 2016, in press. [Epub ahead of print] p.i.i. sbw110. [DOI] [PMC free article] [PubMed] [Google Scholar]
- Scholz J, Klein MC, Behrens TE, Johansen-Berg H. Training induces changes in white-matter architecture. Nat Neurosci 2009; 12: 1370–1. [DOI] [PMC free article] [PubMed] [Google Scholar]
- Simmons A, Moore E, Williams SC. Quality control for functional magnetic resonance imaging using automated data analysis and Shewhart charting. Magn Reson Med 1999; 41: 1274–8. [DOI] [PubMed] [Google Scholar]
- Sporns O. The human connectome: origins and challenges. Neuroimage 2013; 80: 53–61. [DOI] [PubMed] [Google Scholar]
- Sporns O, Tononi G, Kotter R. The human connectome: a structural description of the human brain. PLoS Comput Biol 2005; 1: e42. [DOI] [PMC free article] [PubMed] [Google Scholar]
- Szeszko PR, Robinson DG, Ikuta T, Peters BD, Gallego JA, Kane J, et al. White matter changes associated with antipsychotic treatment in first-episode psychosis. Neuropsychopharmacology 2014; 39: 1324–31. [DOI] [PMC free article] [PubMed] [Google Scholar]
- Tregellas JR. Neuroimaging biomarkers for early drug development in schizophrenia. Biol Psychiatry 2014; 76: 111–9. [DOI] [PMC free article] [PubMed] [Google Scholar]
- van den Heuvel MP, de Reus MA, Feldman Barrett L, Scholtens LH, Coopmans FM, Schmidt R, et al. Comparison of diffusion tractography and tract-tracing measures of connectivity strength in rhesus macaque connectome. Hum Brain Mapp 2015a; 36: 3064–75. [DOI] [PMC free article] [PubMed] [Google Scholar]
- van den Heuvel MP, Mandl RC, Stam CJ, Kahn RS, Hulshoff Pol HE. Aberrant frontal and temporal complex network structure in schizophrenia: a graph theoretical analysis. J Neurosci 2010; 30: 15915–26. [DOI] [PMC free article] [PubMed] [Google Scholar]
- van den Heuvel MP, Scholtens LH, de Reus MA, Kahn RS. Associated microscale spine density and macroscale connectivity disruptions in Schizophrenia. Biol Psychiatry 2015b; 80: 293–301. [DOI] [PubMed] [Google Scholar]
- van den Heuvel MP, Sporns O, Collin G, Scheewe T, Mandl RC, Cahn W, et al. Abnormal rich club organization and functional brain dynamics in schizophrenia. JAMA Psychiatry 2013; 70: 783–92. [DOI] [PubMed] [Google Scholar]
- van den Heuvel MP, Stam CJ, Kahn RS, Hulshoff Pol HE. Efficiency of functional brain networks and intellectual performance. J Neurosci 2009; 29: 7619–24. [DOI] [PMC free article] [PubMed] [Google Scholar]
- van Haren NE, Schnack HG, Cahn W, van den Heuvel MP, Lepage C, Collins L, et al. Changes in cortical thickness during the course of illness in schizophrenia. Arch Gen Psychiatry 2011; 68: 871–80. [DOI] [PubMed] [Google Scholar]
- Wang Q, Cheung C, Deng W, Li M, Huang C, Ma X, et al. White-matter microstructure in previously drug-naive patients with schizophrenia after 6 weeks of treatment. Psychol Med 2013; 43: 2301–9. [DOI] [PubMed] [Google Scholar]
- Wang Q, Su TP, Zhou Y, Chou KH, Chen IY, Jiang T, et al. Anatomical insights into disrupted small-world networks in schizophrenia. Neuroimage 2012; 59: 1085–93. [DOI] [PubMed] [Google Scholar]
- Wright IC, Ellison ZR, Sharma T, Friston KJ, Murray RM, McGuire PK. Mapping of grey matter changes in schizophrenia. Schizophr Res 1999; 35: 1–14. [DOI] [PubMed] [Google Scholar]
- Zalesky A, Fornito A, Bullmore ET. Network-based statistic: identifying differences in brain networks. Neuroimage 2010a; 53: 1197–207. [DOI] [PubMed] [Google Scholar]
- Zalesky A, Fornito A, Harding IH, Cocchi L, Yucel M, Pantelis C, et al. Whole-brain anatomical networks: does the choice of nodes matter? Neuroimage 2010b; 50: 970–83. [DOI] [PubMed] [Google Scholar]
- Zalesky A, Fornito A, Seal ML, Cocchi L, Westin CF, Bullmore ET, et al. Disrupted axonal fiber connectivity in schizophrenia. Biol Psychiatry 2011; 69: 80–9. [DOI] [PMC free article] [PubMed] [Google Scholar]
- Zhang R, Wei Q, Kang Z, Zalesky A, Li M, Xu Y, et al. Disrupted brain anatomical connectivity in medication-naive patients with first-episode schizophrenia. Brain Struct Funct 2015; 220: 1145–59. [DOI] [PubMed] [Google Scholar]
Associated Data
This section collects any data citations, data availability statements, or supplementary materials included in this article.