

Predicting the underlying pathological diagnosis in behavioural variant frontotemporal dementia will be essential to exploit molecule-specific therapies. In 117 autopsied patients with behavioural variant frontotemporal dementia, Perry et al. report that certain profiles of clinical, genetic, neuropsychological, and neuroimaging data allow accurate prediction of the underlying pathological diagnosis.
Keywords: frontotemporal dementia, Alzheimer’s disease, Pick’s disease, corticobasal degeneration, frontotemporal lobar degeneration
Abstract
Accurately predicting the underlying neuropathological diagnosis in patients with behavioural variant frontotemporal dementia (bvFTD) poses a daunting challenge for clinicians but will be critical for the success of disease-modifying therapies. We sought to improve pathological prediction by exploring clinicopathological correlations in a large bvFTD cohort. Among 438 patients in whom bvFTD was either the top or an alternative possible clinical diagnosis, 117 had available autopsy data, including 98 with a primary pathological diagnosis of frontotemporal lobar degeneration (FTLD), 15 with Alzheimer’s disease, and four with amyotrophic lateral sclerosis who lacked neurodegenerative disease-related pathology outside of the motor system. Patients with FTLD were distributed between FTLD-tau (34 patients: 10 corticobasal degeneration, nine progressive supranuclear palsy, eight Pick’s disease, three frontotemporal dementia with parkinsonism associated with chromosome 17, three unclassifiable tauopathy, and one argyrophilic grain disease); FTLD-TDP (55 patients: nine type A including one with motor neuron disease, 27 type B including 21 with motor neuron disease, eight type C with right temporal lobe presentations, and 11 unclassifiable including eight with motor neuron disease), FTLD-FUS (eight patients), and one patient with FTLD-ubiquitin proteasome system positive inclusions (FTLD-UPS) that stained negatively for tau, TDP-43, and FUS. Alzheimer’s disease was uncommon (6%) among patients whose only top diagnosis during follow-up was bvFTD. Seventy-nine per cent of FTLD-tau, 86% of FTLD-TDP, and 88% of FTLD-FUS met at least ‘possible’ bvFTD diagnostic criteria at first presentation. The frequency of the six core bvFTD diagnostic features was similar in FTLD-tau and FTLD-TDP, suggesting that these features alone cannot be used to separate patients by major molecular class. Voxel-based morphometry revealed that nearly all pathological subgroups and even individual patients share atrophy in anterior cingulate, frontoinsula, striatum, and amygdala, indicating that degeneration of these regions is intimately linked to the behavioural syndrome produced by these diverse aetiologies. In addition to these unifying features, symptom profiles also differed among pathological subtypes, suggesting distinct anatomical vulnerabilities and informing a clinician’s prediction of pathological diagnosis. Data-driven classification into one of the 10 most common pathological diagnoses was most accurate (up to 60.2%) when using a combination of known predictive factors (genetic mutations, motor features, or striking atrophy patterns) and the results of a discriminant function analysis that incorporated clinical, neuroimaging, and neuropsychological data.
Introduction
Frontotemporal dementia (FTD) refers to a group of common early age-of-onset dementia syndromes (Ratnavalli et al., 2002; Knopman et al., 2004) linked to underlying frontotemporal lobar degeneration (FTLD) pathology (Mackenzie et al., 2010). FTLD, in turn, has three major molecular classes, based on the protein composition of the neuronal and glial inclusions, tau (FTLD-tau), TAR DNA-binding protein of 43 kDA (TDP-43, FTLD-TDP), or fused in sarcoma (FUS, FTLD-FUS). Rarely, Alzheimer’s disease is found as the primary diagnosis at autopsy in clinically diagnosed FTD (Alladi et al., 2007; Chare et al., 2014; Ossenkoppele et al., 2015). Behavioural variant FTD (bvFTD) is the most common FTD subtype, and its underlying pathology is the most challenging to predict.
Because disease-modifying therapies now target specific FTLD molecular subtypes, it is increasingly important for clinicians to accurately predict the underlying pathological diagnosis. Several predictive features are accepted: FTD with motor neuron disease (FTD-MND) predicts FTLD-TDP, usually type B (TDP-B); bvFTD evolving to supranuclear gaze palsy predicts progressive supranuclear palsy (PSP); and bvFTD progressing to profound semantic loss and anterior temporal atrophy predicts FTLD-TDP, type C (TDP-C). Most prior clinicopathological studies either predated current neuropathological methods or involved small numbers, with bvFTD sample sizes ranging from 17 to 47 (Hodges et al., 2004; Kertesz et al., 2005; Shi et al., 2005; Forman et al., 2006; Josephs et al., 2006; Snowden et al., 2007; Llado et al., 2008; Rohrer et al., 2011). The goals of this study were to: (i) describe the distribution of pathological diagnoses in a large, consecutive bvFTD clinicopathological series; (ii) identify the features in common among pathological causes of bvFTD; and (iii) isolate distinctive clinical, neuropsychological, genetic, or imaging features that could help clinicians diagnosing bvFTD to predict the neuropathological diagnosis.
Materials and methods
Patient selection
We sought to inform pathological prediction for clinicians considering bvFTD in any scenario, either as a straightforward syndrome or as an alternate diagnostic possibility, whether or not the patient met bvFTD research criteria that are currently in place. To this end, we searched the UCSF Memory and Aging Center database for patients evaluated from 1998 to 2012. Clinicians coded each visit with the best-fit clinical syndrome, any additional syndromes considered, and whether the patient met prevailing clinical research criteria in place at the time of evaluation. For some patients, diagnosis was stable across visits whereas for others diagnosis evolved in the face of new information. Our search captured all patients with bvFTD, FTD-MND, or right temporal FTD as the primary diagnosis or as an additional syndrome considered. For simplicity, we refer to these diagnoses as bvFTD. We also included those who met research criteria for bvFTD (Neary et al., 1998) even if no qualifying syndrome was listed. All patients underwent in-person evaluation.
We divided patients into (i) those with bvFTD as the leading diagnosis at any visit; and (ii) those for whom bvFTD was listed as an additional syndrome (‘Low confidence bvFTD’). We further divided those with bvFTD as the leading syndrome into (i) those in whom bvFTD was the leading diagnosis at each visit (‘High confidence bvFTD’); and (ii) those in whom diagnosis varied over time (‘Intermediate confidence bvFTD’) (Fig. 1). Though some patients fit the diagnostic impression of bvFTD at initial presentation and throughout the disease course, others’ diagnoses either shifted to bvFTD from another syndromic diagnosis or migrated away from bvFTD later in the course. From the bvFTD-related cohort, we determined which patients underwent autopsy.
Figure 1.
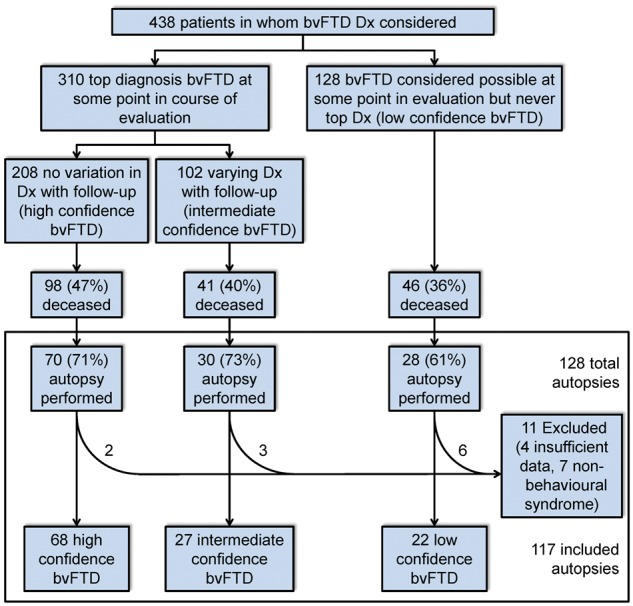
Patient ascertainment by bvFTD diagnostic certainty. Dx = diagnosis.
Clinical data abstraction
All notes were reviewed on all autopsied patients by a behavioural neurologist blinded to pathological diagnosis. Data analysed included demographic features; age of symptom onset, diagnosis, and death; first disease symptom; cognitive, behavioural, or motor symptoms that developed over the course of the disease; and neurological examination findings. Clinical narratives were supplemented by standardized, prospectively-applied research instruments. Symptoms and exam findings were determined as absent, present at first presentation, or present at any point in follow-up. The Clinical Dementia Rating scale (CDR) (Morris, 1993) and Neuropsychiatric Inventory (NPI) (Cummings et al., 1994) were also gathered. Based on the notes, the reviewing clinician verified that patients had a syndrome involving behaviour/personality changes or profound executive dysfunction. Patients who had a non-behavioural syndrome (e.g. primary progressive aphasia or a motor disorder) were excluded, even if they had been prospectively coded by clinicians as ‘FTD,’ in a way that does not reflect current diagnostic terminology. New International bvFTD Criteria Consortium (FTDC) diagnostic criteria (Rascovsky et al., 2011) were published late in the course of patient accrual and had not been prospectively included in the diagnostic process. The criteria were retrospectively applied. These criteria require that certain symptoms be present ‘early’ in the disease course. We did not apply a rigid time criterion (e.g. 3 years) to determine ‘early’ symptoms, but considered a symptom early if it developed while the patient was still mildly impaired overall. The FTDC criteria require a determination of whether a patient displays executive function deficits with relative preservation of memory and visuospatial function. This determination was made by the reviewing clinician as has been done in prior papers establishing the sensitivity and interrater reliability of these criteria (Rascovsky et al., 2011; Lamarre et al., 2013). Because we sought to ensure broad applicability of our results to clinicians considering a bvFTD diagnosis, even in the most diagnostically challenging patients, and in order to assess the sensitivity of the new criteria, we did not exclude patients who failed to meet FTDC bvFTD possible or probable criteria. Using the retrospectively applied criteria we performed additional subgroup comparisons restricted to those who met FTDC possible or FTDC probable criteria to assess whether clinical features between pathological diagnoses would differ in a presumably more homogeneous bvFTD sample.
Neuropsychological data
A battery of tests of memory, language, visuospatial ability, and executive function (Kramer et al., 2003) was administered (Supplementary material). We used the first available assessment for all patients.
Neuroimaging
Imaging acquisition
Images were acquired on one of three scanners (1.5 T, 4 T, or 3 T) with published acquisition parameters (Rosen et al., 2002a; Mueller et al., 2009; Bettcher et al., 2012), based on the scanner in use at the time of the first evaluation. See Supplementary material for preprocessing.
Imaging analysis
Frequency maps
To determine the extent of overlap in atrophy across pathological groups and to overcome the inevitable loss of individual effects in group-level analyses, we generated whole brain voxel-wise frequency maps that represent the proportion of patients or pathological subtypes showing reduced grey matter, voxel-wise, compared to controls. Supplementary material details generation of W scores. W scores, similar to z scores, show for each voxel where a patient’s grey matter probability would fall on the normal grey matter probability distribution in healthy controls, after accounting for nuisance factors (Jack et al., 1997; La Joie et al., 2012; Ossenkoppele et al., 2015). We took mean W scores for patients in each pathological group and then binarized the W-score map for each patient and pathological group at two levels, W > 1.5 and W > 3 (greater W scores correspond to more severe atrophy). We generated frequency maps to show the proportion of (i) all patients; (ii) patients with high confidence bvFTD; and (iii) pathological subtypes, with suprathreshold W scores for each brain voxel. W-score maps for white matter were also generated. To assess for any systematic difference in disease duration at the time of scan among pathological diagnoses we compared the mean interval between age at disease onset and scan date for each group. The mean interval did not differ between groups, F(9,72) = 0.73, P = 0.68, with a mean of 5.65 (standard deviation 4.2) years.
Linear discriminant analysis
To identify regions that distinguish each pathological group we performed linear discriminant analysis using each subject’s W-score map to find a linear boundary (weighted sum across all voxels) that best separates patients with each neuropathological diagnosis from all patients with other diagnoses. Maps generated depict voxels representing the strongest contributors to the linear boundaries and were reviewed at a threshold that included the top 25% of voxels where in-group patients had (i) a higher mean W value (less grey matter); or (ii) a lower mean W value (more preserved grey matter) than the out-group patients.
Genetic testing
Screening was performed on all patients with available blood or frozen tissue samples for genetic mutations known to cause autosomal dominant inheritance of FTD or Alzheimer’s disease (MAPT, C9orf72, GRN, TARDBP, FUS, PSEN1, PSEN2, and APP).
Pathological assessment
Because autopsies were performed from 2000 to 2013, at several institutions, the assessments were not uniform. Neuropathological assessments performed at UCSF (n = 85) or the University of Pennsylvania (n = 25) followed previously described procedures (Forman et al., 2006; Tartaglia et al., 2010). Patients were classified into FTLD major molecular classes (tau, TDP-43, or FUS) and subtypes (Mackenzie et al., 2010, 2011), Alzheimer’s disease (Hyman and Trojanowski, 1997; Hyman et al., 2012), or amyotrophic lateral sclerosis (ALS). When patients with FTLD-TDP failed to fit into a defined (A–D) subtype or had inclusions too sparse to classify, the term ‘unclassifiable’ (TDP-U) was used. The presence of co-pathologies was noted, including Alzheimer’s disease neuropathological change (ADNC), cerebrovascular disease, Lewy body disease (McKeith et al., 2005), cerebral amyloid angiopathy, argyrophilic grain disease, or incidental TDP-43 proteinopathy. If the original assessment lacked details required to rate the ADNC and archival tissue was available, additional staining was performed to determine ADNC level.
Classification approaches
Data-driven classification
Data reduction
To determine whether a combination of clinical or neuroimaging features could separate pathological subtypes, we employed supervised classification procedures. This began with data reduction techniques on the available data types:
Clinical information. Categorical principal component analysis (CATPCA), a type of non-linear PCA (Linting and van der Kooij, 2012), followed by varimax rotation, was applied to 87 variables, involving categorical information (i.e. the presence or absence of particular signs or symptoms), continuous data (e.g. age at onset), and NPI frequency × severity scores. Missing data were excluded for analyses of that variable.
Grey matter atrophy maps. PCA was performed using each patient’s unthresholded grey matter W-score map.
White matter atrophy maps. PCA was performed using each patient’s unthresholded white matter W-score map.
Neuropsychological testing. PCA followed by varimax rotation was applied to 12 of 14 cognitive testing variables (verbal agility and Peabody Picture Vocabulary Test excluded due to excess missing data).
Analyses included all patients with the 10 most common pathological diagnoses in the study. We excluded FTDP-17, unclassifiable tau, FTLD-UPS, and argyrophilic grain disease. We extracted all components with an eigenvalue >1, and initially reviewed solutions with up to 10 components, aiming to capture one component representing each pathological diagnosis. Loadings for each component were reviewed to determine which original variables were strongly associated. Mean component scores for all patients with a pathological diagnosis were reviewed to determine how strongly each component was associated with each pathological subtype.
Classification accuracy
To assess the accuracy of classification using components derived from the four data reduction analyses, and to prevent over-fitting the model to an individual patient, we performed cross-validation. Due to the small sample size of some of the molecular subtype groups we chose a leave-one-out approach. To classify each patient we derived complete sets of components with that patient left out, and then entered these components into a discriminant function analysis (DFA). The analyses were performed at three diagnostic levels, based on (i) the top 10 pathological diagnoses; (ii) FTLD major molecular class; and (iii) FTLD versus Alzheimer’s disease versus ALS. For each DFA, the prior probability of a pathological diagnosis was set as the frequency of that diagnosis in the overall cohort. DFA results were measured by the accuracy of the cross-validated grouping, in which each case is classified by functions derived from all cases except for that one. The components retained for each of the PCAs and CATPCA was defined as the number that resulted in the highest DFA classification accuracy.
An additional DFA was performed using the components from all four data reduction analyses. The neuropsychological testing PCA generated component scores for fewer subjects than the other analyses. To avoid limiting the analysis to only those subjects with complete neuropsychological testing profiles, and thereby reducing power, for purposes of this combined analysis we performed an additional PCA on neuropsychological data using Expectation-Maximization (SPSS v24) to impute missing data points. Since this analysis included data derived from different sources with unknown relationships we entered components into the DFA stepwise, selecting the variable at each step that minimizes the sum of the unexplained variance between groups, using F value as the criterion for variable inclusion (F > 2.50 to enter, F < 2.49 to remove).
A priori classification algorithm
In a parallel approach, we applied an algorithm designed by the authors a priori, using previously shown predictors, to determine the accuracy of current knowledge and expertise in pathological prediction. These factors included genetic status, features derived by visual inspection of MRI, demographics, and clinical signs and symptoms (MND or PSP syndrome), as described in the Supplementary material. The algorithm’s accuracy was assessed by applying it to each subject.
Combined a priori algorithm with discriminant function analysis
To maximize the strengths of both classification strategies, we combined the data-driven approach with the most definitive components of the a priori algorithm. Patients were entered into the a priori algorithm. At each of the first six branch points the results of the DFA were used to select the predicted pathological diagnosis based on those predesignated as likely for that branch point. For example, if a patient had a C9orf72 repeat expansion, the algorithm designates three possible pathological diagnoses (FTLD-TDP, types A, B, and unclassifiable). Among these options, we selected the diagnosis with the highest probability score in the DFA as the predicted pathology. For patients not captured in the first six branches of the algorithm pathological prediction solely followed DFA classification.
To model how present and potential future biomarkers will impact this classification process, we simulated a classification using the a priori algorithm, DFA, and hypothetical results of amyloid-beta and tau imaging. Actual amyloid images had been performed on a small sample of the cohort, but because of sparse coverage of the total cohort hypothetical results were used for all patients. While future tau biomarkers may use regional distributions in uptake to separate subtypes of tauopathy, for this simulation we considered results to be solely positive or negative. In this analysis, patients who would have a positive amyloid and tau scan, based on a Consortium to Establish a Registry for Alzheimer’s Disease (CERAD) neuritic plaque frequency of intermediate or high (Clark et al., 2012) and a Braak neurofibrillary tangle stage ≥5, were first classified as Alzheimer’s disease. The remaining patients were entered into the a priori algorithm as before, though at each branch point the hypothetical tau imaging results were used to narrow the possibilities before applying the DFA as described above.
Statistical analyses
Categorical demographic and clinical variables were compared by independent samples t-tests or ANOVA with post hoc comparison using Bonferroni adjustment. Categorical variables were compared by chi-square with post hoc comparison by z-tests with Bonferroni adjustment. A significance level of P < 0.05 was chosen. All analyses were performed in SPSS.
Results
Patient ascertainment and pathological diagnoses
Among 438 patients for whom a bvFTD diagnosis was considered, 128 underwent autopsy (Fig. 1) and data abstraction. Of these, 11 were excluded either for insufficient data or for having a non-behavioural syndrome upon chart review. These exclusions yielded a final cohort of 117 (Fig. 2). Of these, 98 had a primary neuropathological diagnosis of FTLD and were distributed among 12 subtypes. Remaining patients had either pathological Alzheimer’s disease (n = 15) or pure ALS without extra-motor FTLD-TDP changes (n = 4).
Figure 2.

Pathological diagnoses for all patients and grouped by clinician bvFTD diagnostic certainty. AD = Alzheimer’s disease.
Co-existing pathologies were common. Among patients with primary FTLD, 54% had some ADNC present, though in 79% of those patients the ADNC level was low. Other co-pathologies were observed, but less commonly in patients with FTLD, including 16% with cerebrovascular disease, 11% with Lewy body disease, 39% with limbic argyrophilic grain disease, and 8% with incidental or contributing TDP-43 proteinopathy. Among patients with pathological Alzheimer’s disease the most common co-pathologies were Lewy body disease in 33%, cerebrovascular disease in 13%, argyrophilic grain disease in 50%, and incidental or contributing TDP-43 in 22%. One patient with a primary pathological diagnosis of Alzheimer’s disease had mild PSP pathology. Co-existing pathologies are detailed for each patient in Supplementary Table 1 and grouped by primary pathological subtypes in Supplementary Table 2.
Nineteen patients had a C9orf72 repeat expansion, three a GRN mutation, three a MAPT mutation, and two a pathogenic TARDBP variant. One patient with Alzheimer’s disease pathology had an APP mutation. Additional genetic testing details are available in Supplementary Table 3.
Pathological diagnoses by bvFTD diagnostic certainty
The clinician’s confidence about the bvFTD diagnosis influenced the distribution of underlying pathological diagnoses, with significant differences (P < 0.001) in the distribution of diagnoses between high, intermediate, and low confidence bvFTD (Fig. 2). High confidence bvFTD was due to FTLD in 93% of patients and composed primarily of (in descending order of frequency) TDP-B, Pick’s disease, TDP-U, FTLD-FUS, and TDP-A. Alzheimer’s disease (4/68) was uncommon. Intermediate confidence bvFTD was most often due to TDP-B, followed by corticobasal degeneration (CBD), Alzheimer’s disease, and TDP-C. Alzheimer’s disease was the most common diagnosis in the low confidence bvFTD group, followed by PSP, CBD, and ALS.
Features in common among neuropathological causes of bvFTD
FTLD compared to non-FTLD
Clinical features
The assessment of demographics, symptoms, and examination findings across pathological diagnoses involved numerous omnibus and pairwise statistical comparisons (Table 1 and Supplementary Table 4). Here, for descriptive purposes, we have emphasized the points thought to have most clinical relevance. Each of the five core symptoms from the FTDC criteria were common, not only among those with FTLD (54-90% frequency), but also among those with bvFTD due to Alzheimer’s disease (40-73% frequency) and to a lesser extent ALS (0% for loss of empathy and compulsions, 25-100% frequency for the other three). The sixth FTDC diagnostic feature, a dysexecutive-predominant impairment on neuropsychological testing, was uncommon in all groups (20-30% frequency). Among patients with Alzheimer’s disease, 60% met at least possible bvFTD diagnostic criteria at some point in the illness, and though probable bvFTD criteria were met less often in patients with Alzheimer’s disease (47%) than those with FTLD (74%), this difference escaped statistical significance, perhaps due in part to the small Alzheimer’s disease sample size. Gender distribution and ages at onset, presentation, and death showed no significant differences between FTLD and Alzheimer’s disease. Among only those with high confidence bvFTD, FTDC criteria were met at similar frequencies in FTLD (97% met FTDC possible, 87% met FTDC probable) and Alzheimer’s disease (100% met FTDC probable) (Supplementary Table 5). When restricting the analysis to those who met FTDC bvFTD possible or probable criteria, those with Alzheimer’s disease displayed core FTDC criteria symptoms at an even more similar frequency to those with FTLD than was observed in the overall cohort (Supplementary Tables 6 and 7). Apathy was the most common first symptom (20%) across all with FTLD but was also the first symptom in 13% of patients with Alzheimer’s disease (Supplementary Table 8).
Table 1.
Demographics and frequency of meeting core diagnostic features across the overall autopsied cohort
| All cases | Primary neuropathological diagnosis | FTLD major molecular class | |||||
|---|---|---|---|---|---|---|---|
| n = 117 | FTLD | AD | ALS | FTLD–Tau | FTLD–TDP | FTLD–FUS | |
| n = 98 | n = 15 | n = 4 | n = 34 | n = 55 | n = 8 | ||
| Male (%) | 83 (71) | 69 (70) | 10 (66.7) | 4 (100) | 26 (76.5) | 35 (63.6) | 7 (87.5) |
| Age of onset, mean (range) | 55 (18–80) | 55.0 (18–73) | 57.3 (34–80) | 55.0 (45–68) | 57.6$ (18–73) | 55.4$ (18–73) | 41.1#,† (26–54) |
| Age at presentation, mean (range) | 60 (29–83) | 60.8 (29–78) | 62.8 (43–83) | 58.3 (47–73) | 64.4$ (53–78) | 60.1$ (44–78) | 45.0#,† (29–55) |
| Age at death, mean (range) | 64.6 (35–83) | 64.2 (35–83) | 68.1 (49–90) | 60.8 (52–74) | 67.8$ (57–83) | 64.5$ (47–80) | 48.3#,† (35–57) |
| Met possible bvFTD criteria | 78, 86 | 84*, 92* | 53*, 60* | 25, 25 | 79, 85 | 86, 95 | 88, 100 |
| Met probable bvFTD criteria | 54, 66 | 64, 74 | 33, 47 | 0, 0 | 58, 64 | 66, 79 | 75, 75 |
| Met definite bvFTD criteria | 21 | 26* | 0* | 0 | 9† | 40# | 0 |
| Early disinhibition | 77, 85 | 83*, 90* | 47*, 60* | 50, 50 | 83, 85 | 82, 91 | 88, 100 |
| Inappropriate | 52, 63 | 55, 65 | 40, 53 | 25, 50 | 56, 65 | 51, 62 | 75, 88 |
| Loss of manners | 52, 64 | 58*, 70* | 27*, 40* | 0, 0 | 56, 65 | 56, 71 | 75, 88 |
| Impulsive | 48, 61 | 54*, 68* | 13*, 20* | 25, 25 | 50, 65 | 51, 67 | 88, 88 |
| Early apathy | 79, 81 | 80, 82 | 67, 73 | 100, 100 | 77, 77 | 80, 84 | 88, 88 |
| Apathy | 79, 85 | 80, 86 | 67, 73 | 100, 100 | 77, 77 | 80, 91 | 88, 88 |
| Inertia | 17, 24 | 17, 25 | 13, 20 | 25, 25 | 9, 12 | 22, 29 | 25, 38 |
| Early loss of sympathy/empathy | 45, 50 | 48, 54 | 40, 40 | 0, 0 | 44, 47 | 47, 56 | 63, 63 |
| Lacking empathy | 33, 39 | 35, 40 | 33, 40 | 0, 0 | 32, 35 | 31, 38 | 63, 65 |
| Lacking warmth | 35, 39 | 40*, 44* | 13*, 13* | 0, 0 | 34, 35 | 42, 47 | 63, 63 |
| Early compulsive behaviour | 63, 74 | 70*, 80* | 33*, 53* | 0, 0 | 68, 79 | 69, 76 | 88, 100 |
| Simple repetitive behaviour | 26, 37 | 30, 42* | 7, 13* | 0, 0 | 21, 35 | 31, 42 | 50, 63 |
| Complex compulsions | 55, 64 | 60, 69 | 33, 53 | 0, 0 | 62, 77 | 55, 60 | 88, 88 |
| Stereotypic speech | 16, 24 | 19, 27 | 0, 13 | 0, 0 | 15, 27 | 18, 22 | 50, 63 |
| Eating behaviour | 63, 80 | 69*, 87* | 40*, 53* | 0, 25 | 65, 82 | 71, 89 | 75, 88 |
| Change in food preference | 50, 68 | 56*, 74* | 27*, 47* | 0, 25 | 50, 68 | 58, 78 | 63, 63 |
| Binge eating | 44, 61 | 48, 65 | 33, 47 | 0, 0 | 53, 74 | 42, 60 | 63, 63 |
| Oral exploration | 8, 13 | 8, 13 | 7, 13 | 0, 0 | 6, 12$ | 7, 9$ | 25, 50#,† |
| Neuropsych pattern | 28, 29 | 29, 30 | 20, 20 | 25, 25 | 37, 37 | 27, 29 | 17, 17 |
| Executive impairment | 86, 89 | 85, 89 | 100, 100 | 50, 50 | 93, 97 | 80, 84 | 86, 86 |
| Memory preserved | 41, 41 | 44, 44 | 20, 20 | 50, 50 | 53, 53 | 41, 41 | 29, 29 |
| Visuospatial preserved | 73, 74 | 75, 76 | 53, 53 | 100, 100 | 73, 73 | 74, 76 | 83, 83 |
Unless otherwise specified, results are formatted as per cent with feature at first evaluation, per cent with feature at any point in disease course. AD = Alzheimer’s disease.
Comparison of primary diagnoses (ALS not included): *significant difference between FTLD and Alzheimers disease.
Comparison of FTLD major molecular classes (FTLD–UPS not included): #significantly different from FTLD–Tau; †significantly different from FTLD–TDP; $significantly different from FTLD–FUS.
Neuropsychological testing
Patients with bvFTD due to FTLD are often expected to outperform those with underlying Alzheimer’s disease on tests of verbal memory and visuospatial ability. Here, these groups showed comparable performance on such tests (Supplementary Table 9 and, for those meeting FTDC possible or probable criteria, Supplementary Tables 10 and 11).
Neuroimaging
Mean W maps for Alzheimer’s disease and ALS indicated some atrophy (W > 1.5) in frontoinsula and anterior cingulate regions that were also affected among FTLD subtypes (Figs 3 and 4).
Figure 3.

Grey matter atrophy maps and frequency of behavioural features by pathological diagnosis. Imaging shows maps of grey matter atrophy at a threshold of W > 1.5 (red) and W > 3 (yellow). Radial plots display the frequency (0–100%) of meeting each of the six FTDC diagnostic criteria at first presentation and mean NPI subscale scores (0–12). Right side of coronal and axial images corresponds to the right side of the brain. AD = Alzheimer’s disease; Ag = agitation; Anx = anxiety; Ap = apathy; Com = compulsions; Del = delusions; Dep = depression; Dis = disinhibition; Eat = eating behaviour; Emp = loss of empathy; Eup = euphoria; Hall = hallucinations; Irr = irritability; Mot = aberrant motor behaviour; NP = neuropsychological profile; Slp = sleep.
Figure 4.

Overlap in grey matter atrophy. Imaging shows the number of patients or pathological subtypes with atrophy (W > 1.5) at each voxel. Top: Overlap in the 10 top pathological subtypes. Middle: Overlap in individual subjects (n = 82). Bottom: Overlap in patients with high confidence bvFTD (n = 42). Right side of coronal images corresponds to the right side of the brain. Right: Mean W for each diagnosis in regions of greatest overlap (≥8 diagnoses for top right, ≥65 patients for middle right, and ≥39 patients for bottom right). AD = Alzheimer’s disease; PiD = Pick’s disease.
Among FTLD major molecular classes
Clinical features
Looking either at the entire cohort or within the high confidence bvFTD group, the three FTLD major molecular classes (tau, TDP-43 or FUS) showed similar frequencies of the six core FTDC criteria at presentation or throughout follow-up. Consequently, the frequency of meeting at least possible or probable bvFTD diagnostic criteria also did not differ among the major molecular classes (Table 1 and Supplementary Table 5).
Among specific FTLD histopathological subtypes
Clinical features
Though there was a range of frequencies for meeting at least bvFTD possible (80–100%) or probable (44–100%) diagnostic criteria among the specific FTLD histopathological subtypes, these differences did not reach statistical significance. There was extensive overlap in core criteria symptoms and other cognitive and behavioural features (Supplementary Table 4). Among those with high confidence bvFTD, the symptom profiles of subtypes converged further, with no significant differences in frequency of the six core FTDC criteria features (Supplementary Table 5).
Neuroimaging
The mean W maps for the 10 most common pathological subtypes (Fig. 3) showed striking similarities across the grey matter atrophy patterns. These thresholded group-level maps were combined to provide a count of the number of subtypes showing significant atrophy (W > 1.5) at each voxel (Fig. 4, top). Eight of 10 subtypes showed overlapping atrophy of voxels in bilateral frontoinsula, anterior to mid-cingulate cortex, amygdala, and striatum. Frequency maps capturing individual patients’ grey matter W maps (Fig. 4, middle) revealed that at least 65 of 82 patients showed atrophy in these same structures, with a maximum frequency (74 patients) in the left frontoinsula (ventral anterior insula). We further built frequency maps to describe the 42 patients with high confidence bvFTD with an MRI (Fig. 4, bottom). This approach showed an even stronger convergence on these structures. All 42 high confidence bvFTD patients had left ventral frontoinsula atrophy, and 39 had bilateral frontoinsula, left anterior cingulate, left ventromedial frontal, bilateral striatum, and left amygdala atrophy.
Distinguishing features among neuropathological causes of bvFTD
FTLD compared to non-FTLD
Clinical features
Patients with bvFTD with FTLD were significantly more likely than those with Alzheimer’s disease to meet at least possible bvFTD criteria or to have particular bvFTD diagnostic criteria features (early disinhibition, including loss of manners and impulsivity; lack of warmth; early compulsive behaviour; and eating behaviour changes, including change in food preference) (Table 1). Other items more common in bvFTD due to FTLD than Alzheimer’s disease included falls, dysphagia, mental rigidity, aggression, lack of insight, dysarthria, decreased muscle bulk, fasciculations, and higher NPI apathy scores. Patients with bvFTD due to Alzheimer’s disease had more language dysfunction, myoclonus, and higher NPI depression scores than those with FTLD (Supplementary Table 4).
Neuropsychological testing
At first assessment, patients with Alzheimer’s disease performed worse than those with FTLD on executive function (Supplementary Table 9), including modified Trails, Stroop inhibition, and design fluency. The top scoring patient with Alzheimer’s disease on each test was outperformed by 39% of FTLD patients on modified Trails, 55% of patients on Stroop inhibition, and 43% on design fluency. Conversely, no patient with Alzheimer’s disease made more than one design fluency repetition error, while 66% with FTLD made more than one error.
Neuroimaging
Mean, binarized W maps for the 10 most common pathological groups (Fig. 3) suggest greater precuneus atrophy in bvFTD due to Alzheimer’s disease than seen in FTLD, though some FTLD subtypes showed mild atrophy in this area as well.
Among FTLD major molecular classes
Clinical features
Patients with bvFTD due to FTLD-FUS showed an earlier age at onset, presentation, and death compared to those with FTLD-tau or FTLD-TDP. Signs and symptoms that significantly differed in frequency among these classes included oral exploration (more in FTLD-FUS), visual misperception (none in FTLD-TDP), delusions, and signs of MND (both more common in FTLD-TDP). On the NPI, delusions were more severe in FTLD-TDP and anxiety, euphoria, apathy, disinhibition, aberrant motor behaviour, sleep disturbance, and eating changes were all more severe in FTLD-FUS than in FTLD-tau or FTLD-TDP (Table 1 and Supplementary Table 4). In the high confidence bvFTD group, complex compulsions were universal in FTLD-FUS and less common in FTLD-TDP. Binge eating was significantly more common in FTLD-tau than FTLD-TDP (Supplementary Table 5).
Neuropsychological testing
The only significant differences detected related to worse verbal memory and a higher number of design fluency repetitions among those with FTLD-FUS (Supplementary Table 9).
Among specific FTLD histopathological subtypes
Clinical features
Specific histopathological subtypes differed in age of onset, presentation, and death, again driven by the early onset age of atypical (a)FTLD-U, the only form of FTLD-FUS captured in the study. Other significant differences included early loss of sympathy/empathy including lack of warmth (more frequent in Pick’s than CBD or PSP), oral exploration (more frequent in aFTLD-U), language symptoms (more frequent in TDP-C than Pick’s or TDP-U), prosopagnosia (more common in TDP-C), falls (most common in PSP, absent in Pick’s and TDP-C), dysphagia (more in PSP and FTD-MND), delusions (more in TDP-A, B, and U), hallucinations (rarely present in CBD and TDP-B but absent or more infrequent in other groups), hyposexuality (most common in TDP-C), dysarthria (more in PSP and FTD-MND), parkinsonism or eye movement abnormalities (most in PSP), apraxia (more in CBD), and ataxia (more in PSP). Among the 12 NPI domains, six of seven significant differences related to the high symptom severity of aFTLD-U (FTLD-FUS) (Table 1 and Supplementary Table 4). In the high confidence bvFTD group, complex compulsions were universal in aFTLD-U and less common in TDP-U (Supplementary Table 5).
Also, inspection of the behavioural profile of each subtype across multiple features revealed characteristic patterns (Fig. 3). These behavioural profiles reflect anatomic differences between the subtypes. Subtypes with more anterior temporal lobe involvement (FTLD-FUS, Pick’s disease, TDP-C) exhibited more loss of empathy and compulsive behaviour than those with more dorsal frontal patterns (CBD, PSP).
Neuropsychological testing
Patients with TDP-U did better on measures of executive function, particularly Stroop inhibition. Patients with TDP-C performed worse than other subtypes on naming (Supplementary Table 9).
Neuroimaging
Mean grey matter W maps for each diagnosis (Fig. 3) highlighted the distribution and severity of volume loss (e.g. extensive frontal atrophy in Pick’s and aFTLD-U; less severe frontal atrophy in PSP). Pick’s disease involved rightward ventral and dorsal frontal and anterior temporal atrophy. CBD atrophy notably included the supplementary motor area. PSP and CBD included less anterior temporal lobe atrophy. Patients with bvFTD due to TDP-C pathology had asymmetric right anterior temporal lobe-predominant atrophy. Supplementary Fig. 1 shows the regions which by linear discriminant analysis best separate subjects with each diagnosis from the others.
Atrophy severity differed by FTLD subtype, even within the areas of overlapping atrophy across pathological diagnoses (Fig. 4, right column). Pick’s disease and FTLD-FUS had more severe atrophy in these core regions than the other diagnoses; ALS and PSP had the least.
Classification approaches
Data-driven classification
Data reduction
We derived components from each data type, determined which original variables strongly influenced that component, and assessed the association between each component and pathological diagnoses.
Clinical information. A CATPCA solution with 10 components (termed dimensions in CATPCA) derived from demographic, clinical symptom, and examination features accounted for 48.5% of the original variables’ variance. Supplementary Table 12 shows variable loadings and mean component scores for each diagnosis.
Grey matter atrophy. The first 10 PCA components accounted for 69.6% of the total variance. Variable loadings and mean component scores by diagnosis are shown in Fig. 5.
White matter atrophy. The first 10 PCA components accounted for 57.1% of the total variance. Variable loadings and mean component scores by diagnosis are shown in Supplementary Fig. 2.
Neuropsychological testing. A PCA solution with four components showed sampling adequacy (Kaiser-Meyer-Olkin 0.735), sufficient correlation of variables for PCA (Bartlett’s test of sphericity P < 0.001), and explained 69.1% of the original variables’ variance. Supplementary Table 13 contains variable loadings and mean component scores for each diagnosis.
Figure 5.

PCA of grey matter W-score maps. The top 25% of voxels contributing to the first 10 components from the principal component analysis. With each is a colour bar representing the mean score for each component of all included subjects with each of the top 10 diagnoses. n = 82. AD = Alzheimer’s disease; PiD = Pick’s disease.
Classification accuracy
Each set of components derived with one patient left out was entered into DFA to assess classification accuracy for each data type individually and together. DFA results for the top 10 diagnoses are shown in Table 2 (Supplementary Tables 14 and 15 depict classification accuracy by presence of FTLD or by major molecular class). When predicting the top 10 pathologic diagnoses, the PCA components derived from grey matter maps showed a higher classification accuracy overall than components derived from clinical data, white matter atrophy, or neuropsychological testing. Using components from all four types of data together yielded the highest classification accuracy, at 57.3% in the cross-validated DFA.
Table 2.
Discriminant function analysis cross-validated classification accuracy by pathological diagnosis (per cent correctly classified) using components derived from specified analyses
| Overall | CBD | PSP | PiD | TDP-A | TDP-B | TDP-C | TDP-U | aFTLD-U | AD | ALS | |
|---|---|---|---|---|---|---|---|---|---|---|---|
| Clinical CATPCA, n = 109 | 28.4 | 0 | 22.2 | 25.0 | 0 | 51.9 | 25.0 | 0 | 37.5 | 46.7 | 25.0 |
| Neuropsych testing PCA, n = 54 | 35.2 | 0 | 0 | 0 | 0 | 64.3 | 33.3 | 0 | 33.3 | 72.7 | 0 |
| GM PCA, n = 82 | 48.8 | 0 | 28.6 | 60.0 | 16.7 | 70.0 | 83.3 | 12.5 | 75.0 | 66.7 | 25.0 |
| WM PCA, n = 82 | 36.6 | 0 | 28.6 | 60.0 | 16.7 | 70.0 | 33.3 | 0 | 50.0 | 40.0 | 0 |
| Clinical + GM + WM + Neuropsych PCA, n = 75a | 57.3 | 16.7 | 40.0 | 50.0 | 20.0 | 77.8 | 66.7 | 50.0 | 75.0 | 66.7 | 50.0 |
| A priori algorithm + discriminant function analysis, n = 83 | 60.2 | 16.7 | 66.7 | 85.7 | 40.0 | 78.9 | 66.7 | 50.0 | 25.0 | 66.7 | 0 |
| A priori algorithm + discriminant function analysis + simulated amyloid/tau imaging, n = 89 | 70.8 | 25.0 | 42.9 | 85.7 | 57.1 | 94.4 | 87.5 | 50.0 | 50.0 | 100 | 0 |
AD = Alzheimer’s disease, aFTLD-U = atypical FTLD with ubiquitin positive inclusions, GM = grey matter, PiD = Pick’s disease, TDP-U = unclassifiable TDP-43, WM = white matter.
aMissing values imputed, stepwise component entry.
A priori algorithm classification
One hundred and one patients had all data required for the full algorithm (Fig. 6). The other 16 had no MRI scan and were excluded. Based upon the consensus visual ratings, the algorithm classified 75 of 101 to a branch that included the correct pathological diagnosis. Genetic mutations and MND were entirely accurate in classifying patients, other than errors related to the omission of ALS in the algorithm as a potential diagnosis. Excluding those classified based on genetic mutations, MND, or PSP syndrome, visual MRI reading steps correctly classified 32/53. The least predictive section of the algorithm was the visual determination of dorsal- or ventral-predominant atrophy. The branch point designed to capture FTLD-FUS set a low age cut-off, resulting in a specific but insensitive filter.
Figure 6.

A priori algorithm for bvFTD pathological prediction. The algorithm is shown on the left, with branches leading to a list of likely pathological diagnoses. On the right are the results from applying the algorithm to the bvFTD cohort, including the numbers of patients whose diagnoses were consistent or inconsistent with the algorithm’s prediction. *Sixteen patients could not be fully classified by the algorithm because of lack of imaging. AD = Alzheimer’s disease.
Combination of a priori algorithm and DFA
The highest classification accuracy of any method came from using a combination of the a priori algorithm with the DFA. The top 10 diagnoses were correctly predicted 60.2% of the time (Table 2).
Finally, we simulated a future context in which clinical and molecular imaging outcomes worked together in the diagnostic process (Supplementary Fig. 3). Incorporating hypothetical binary results of amyloid-β and tau PET, classification accuracy improved to 70.8%, although co-pathologies would have prompted six classification errors. In five patients, the presence of at least CERAD moderate amyloid plaques in a primary tauopathy would give a positive 2017-01761 and tau scan and could result in erroneous classification as Alzheimer’s disease. In another patient, comorbid mild PSP pathology resulted in misclassifying a patient with TDP-C.
Discussion
The ability to predict pathological diagnosis in patients with bvFTD would greatly facilitate trials of disease-modifying therapies, but this goal has remained elusive, in part due to the number of possible aetiologies without clear distinguishing features. In this large, prospectively diagnosed bvFTD cohort, we found all of the major FTLD subtypes, as well as Alzheimer’s disease and ALS, with a distribution that varied according to the clinician’s confidence in the bvFTD diagnosis and the consistency of the syndrome throughout follow-up. In spite of commonalities across molecular causes, the clinical, neuropsychological, and imaging variability between diagnoses suggested subtle anatomic differences that inform pathological prediction. Data-driven classification by cross-validated DFA harnessed these clinical differences, and in combination with strongly predictive factors (genetic mutations, clear-cut atrophy patterns, and motor syndromes) predicted the histopathological subtype in 60.2% of cases. By comparison, chance prediction of the most common subtype (TDP-B) in each patient would have yielded an accuracy of 24.8%.
Pathological diagnoses
In 117 patients with bvFTD, we found 14 different underlying pathologies. In 68 with a ‘high confidence’ bvFTD diagnosis, FTLD was found in 93%, while Alzheimer’s disease was uncommon (6%). In these cases, the most common pathological subtypes were those with MND (TDP-B and U), Pick’s disease, and aFTLD-U (FTLD-FUS). The presence of MND strengthened clinicians’ diagnostic confidence, and enriched the high confidence group with FTLD-TDP. When bvFTD symptoms are accompanied by elements of other clinical syndromes, the most common pathological diagnoses were Alzheimer’s disease, PSP, and CBD.
Features in common
The clinical and neuroimaging profiles of the various neuropathological diagnoses substantially overlapped. Patients representing all FTLD major molecular classes and subtypes met at least possible and probable bvFTD diagnostic criteria at comparable rates. Eight patients with a behavioural syndrome caused by FTLD did not meet FTDC possible criteria (92% sensitivity), reflecting the limitations of the current criteria. Most of those with underlying Alzheimer’s disease met at least possible bvFTD criteria. Early apathy, disinhibition, compulsivity, and eating behaviour changes all occurred in >50% of patients with the eight most common FTLD subtypes. Similarly, grey matter atrophy patterns showed striking overlap among FTLD subtypes and those with underlying Alzheimer’s disease. In particular, patients showed atrophy involving frontoinsula, anterior cingulate cortex, striatum, and amygdala, regions that atrophy in the mildest clinical stages of bvFTD (Seeley et al., 2008) and form a large-scale network in the healthy brain (Seeley et al., 2009). These findings further strengthen the link between degeneration of these regions and the symptomatology of bvFTD, regardless of its molecular cause, and suggest that diverse proteinopathies converge on these structures to produce the core bvFTD syndrome.
Distinguishing features
Alzheimer’s disease
In previous studies, the frequency of Alzheimer’s disease causing bvFTD ranged from 2% (Rosen et al., 2002b; Shi et al., 2005) to over 20% (Leger and Banks, 2014). The low frequency of Alzheimer’s disease in our high confidence bvFTD group reflects the fact that dementia specialists can usually distinguish between behavioural syndromes due to FTLD and those due to Alzheimer’s disease. Specialists inevitably evaluate more diagnostically challenging patients, however, and we chose to include such patients in this study. Among such patients there are still distinguishing features. While each FTDC diagnostic feature was seen in at least some patients with Alzheimer’s disease, some of the more ventral frontal symptoms, such as disinhibition, compulsivity, eating behaviours, and particularly emotional coldness, were less common in Alzheimer’s disease than in FTLD. Apathy and executive function impairment were common in these 15 behaviour-predominant patients with Alzheimer’s disease, as in patients with FTLD, reflecting degeneration of dorsolateral prefrontal areas. Although executive dysfunction is severe in some bvFTD-FTLD patients, it is not universal. In bvFTD due to Alzheimer’s disease, however, nearly all patients showed moderate to severe executive impairment, suggesting that attributing a behavioural syndrome to Alzheimer’s disease, even in the presence of Alzheimer’s disease biomarkers, should be done cautiously unless executive functions are impaired. Further study is warranted to determine how the neuropsychological profile in the current diagnostic criteria (Rascovsky et al., 2011) can be improved to separate bvFTD due to FTLD from the challenging ‘frontal Alzheimer’s disease’ cases, rather than distinguishing bvFTD from the typical Alzheimer’s disease syndrome. Neuroimaging indicated that patients with bvFTD due to Alzheimer’s disease show atrophy in core bvFTD regions, and nearly 50% of the time clinicians rated these patients as having the frontal-predominant atrophy needed to meet probable bvFTD criteria. Nonetheless, patients with bvFTD due to Alzheimer’s disease could often be distinguished by the presence of posterior atrophy, including posterior cingulate and precuneus, as previously described (Lehmann et al., 2010; Whitwell et al., 2011b; Ossenkoppele et al., 2015).
Amyotrophic lateral sclerosis
Interestingly, we found four patients with pure ALS at autopsy, without FTLD, in whom bvFTD was considered. Apathy and executive function impairment seemed to drive this clinical impression. The source of these findings in the absence of neurodegeneration or TDP-43 aggregation in anterior cingulate and dorsolateral prefrontal cortex warrants further exploration. One of four carried a C9orf72 repeat expansion, suggesting that neuronal dysfunction due to C9ORF72-specific pathological changes (RNA foci, loss of C9ORF72 function, dipeptide repeat proteins) may have contributed to the behavioural syndrome even though FTLD-TDP had not reached the implicated brain regions. Most other typical bvFTD symptoms were rare and atrophy was much milder in these cases.
Tau versus TDP-43 versus FUS
Distinguishing among FTLD major molecular classes still remains challenging, in part due to the heterogeneity within each class. This clinical-anatomical variability can lead to more similarity of subtypes between than within major molecular classes. For example, bvFTD due to TDP-A is clinically more similar to bvFTD due to CBD than it is to bvFTD due to TDP-C. A full MND syndrome universally predicted FTLD-TDP, consistent with previous studies (Snowden et al., 2007; Josephs et al., 2011). Yet, extrapyramidal features, though widely thought to predict FTLD-tau (Forman et al., 2006) were equally common in FTLD-tau and -TDP. Delusions, however, were more common in FTLD-TDP (Leger and Banks, 2014), even in the absence of a C9orf72 expansion.
Patients with FTLD-FUS (eight with aFTLD-U) were younger and had more severe behavioural impairment than all other groups, consistent with previous work (Urwin et al., 2010; Snowden et al., 2011). In addition to the core bvFTD atrophy pattern, severe ventromedial frontal, anterior temporal, and striatal volume loss (Josephs et al., 2010; Seelaar et al., 2010) characterized aFTLD-U and separated it from other groups in the linear discriminant analysis. This group also made more design fluency repetitions than other groups and showed poor verbal memory.
Profiles within histopathological subtypes
Pick’s disease
The five core FTDC symptoms were common among eight patients with Pick’s disease, reaching 100% during the disease course for lack of empathy and eating behaviour changes. Blinded reviewer visual rating of severe (knife-edge) fronto-insulo-temporal, or in one case, anterior temporo-insular atrophy on MRI captured 6/6 patients with Pick’s disease, though this was also present in patients with other subtypes.
Corticobasal degeneration
Lack of sympathy/empathy was less commonly seen in the 10 CBD patients, consistent with the relative preservation of the anterior temporal lobes (Rankin et al., 2006). While some extrapyramidal signs were common, many patients did not show typical motor features of corticobasal syndrome. Half never developed apraxia, even during follow-up. Myoclonus was observed in none of these patients. Atrophy involved dorsolateral frontal regions (Lee et al., 2011; Whitwell et al., 2011a). Medial frontal atrophy, including supplementary motor area, particularly distinguished CBD from other pathological entities. Impairment on neuropsychological testing was notable on executive tests, including Trails and Stroop.
Progressive supranuclear palsy
PSP is reported as an uncommon cause of bvFTD (Kertesz et al., 2005; Josephs et al., 2006). While falls, eye movement abnormalities, extrapyramidal features, and dysarthria were common, none were universally present in the nine patients with PSP except for dysphagia. Relative to the other subtypes, fewer patients met probable criteria at any point throughout follow-up, reflecting the lack of striking or disproportionate frontotemporal atrophy. Posterior cerebellum atrophy distinguished PSP from other subtypes.
TDP-A
While sporadic cases occur, six of nine with TDP-A had a genetic mutation (C9orf72 or GRN). Similar to prior reports (Rohrer et al., 2010; Whitwell et al., 2011a), we found significant dorsal frontal atrophy with some anterior temporal involvement among six with imaging. Dorsal anterior insula and frontal-opercular atrophy separated TDP-A from other subtypes by linear discriminant analysis.
TDP-B
Two-thirds of the 27 patients with TDP-B did not have a genetic mutation (C9orf72 or TARDBP) and 22% lacked pathological evidence of MND. The 20 patients with TDP-B and neuroimaging had milder frontotemporal atrophy except in subcortical regions, including striatum and thalamus, and frontoinsula.
TDP-C
Patients with bvFTD due to TDP-C presented with prominent loss of sympathy/empathy (the presenting symptom in four of eight patients), compulsive behaviour, and asymmetric anterior temporal atrophy. When degeneration begins on the left side the syndrome is more commonly semantic variant primary progressive aphasia, but a bvFTD syndrome often occurs when the right side is affected first (Edwards-Lee et al., 1997; Thompson et al., 2003; Seeley et al., 2005). All were correctly captured by blinded inspection of their temporal-predominant atrophy pattern. Patients in this group displayed worse confrontational naming than other subtypes, and 38% had a language-related first symptom. In our view, right anterior temporal-predominant bvFTD due to TDP-C predominantly reflects loss of social-emotional meaning.
TDP-U
Eleven patients had FTLD-TDP too sparse or atypical to classify using the A–D system (Mackenzie et al., 2011). Eight of 11 had genetic mutations (C9orf72 or TARDBP), and six also had MND. Atrophy was rarely severe. Patients did well on tests of executive function, such as Trails and Stroop.
Classification
Components derived from clinical, neuropsychological, and neuroimaging data suggest patterns that associate with particular pathological diagnoses. Through cross-validated DFA, these components led to correct prediction of the specific underlying pathology in more than half of patients. Using an algorithm based on known clinicopathological associations (Fig. 6), the pathology could be correctly narrowed to a shortlist in 74% of patients, but the exact subtype could not be determined. Combining the two approaches (DFA and a priori algorithm) achieved the most accurate results, with the correct diagnosis predicted in 60.2%. These results indicate that certain scenarios allow the clinician to predict pathology with confidence. These include FTD-associated genetic mutations, MND, PSP syndrome, or asymmetric anterior temporal-predominant atrophy. Some features are sensitive, but not entirely specific, such as knife-edge frontotemporal atrophy for Pick’s disease. Young age and caudate atrophy is specific, but not sensitive, for aFTLD-U (FTLD-FUS). Applying this algorithmic approach allows the clinician to simplify the list of possible diagnoses. In summary, genetic testing, a neurological examination searching for subtle MND or supranuclear gaze palsy, and neuroimaging assessment all play important roles in the clinical evaluation of bvFTD. Patients defying straightforward classification include those with sporadic TDP-A, TDP-B, CBD (the most challenging subtype for our approaches to classify correctly), and PSP without early eye movement or other motor features. By adding results of hypothetical amyloid-β and tau imaging to this classification we simulate the near-future scenario in which biomarkers will be considered in conjunction with clinical and imaging data. This combination improves molecular classification accuracy to 71%, but challenges remain, particularly for those with co-existing proteinopathies. Though many patients are correctly classified by this method, the remaining inaccuracies indicate that current knowledge and techniques may be inadequate to accurately classify all patients by subtype, and biomarkers that separate TDP-43 from tau would not eliminate this problem.
Limitations
Some of this study’s limitations arise from the long period over which patients were evaluated. Clinical assessment and acumen evolved throughout this period, and we relied on clinician documentation to determine the presence or absence of some features. We chose broad clinical inclusion criteria to increase applicability and to allow us to assess the sensitivity of FTDC criteria, but future studies may benefit from limiting inclusion to subjects who meet FTDC criteria. Also, autopsies were performed at multiple centres, and advances have led to changes in pathological diagnostic criteria and protocols. While this cohort is large, the number of separate histopathological subtypes, each with small numbers of patients, limited our ability to test or validate an unbiased classification system. Pathological diagnoses with small numbers of patients (argyrophilic grain disease, FTLD-UPS, FTDP-17, and unclassifiable tau) were excluded from classification procedures, meaning they would be missed in application of this classification to a larger, independent dataset. Future studies describing larger cohorts could enable training of a more robust classification strategy.
Despite these limitations, this study represents the largest consecutive bvFTD autopsy series in which detailed phenotypic and neuropathological data allowed comparison of the major neuropathological subtypes. Future efforts to predict pathology in bvFTD may rely on molecular imaging or fluid biomarkers, but until those tools are made available the clinical and structural imaging data provide many clues to physicians who evaluate patients with bvFTD and provide hope that with further research sensitive and specific classification strategies may emerge.
Supplementary Material
Acknowledegments
We wish to acknowledge Dr Edward Plowey at Stanford University and Dr Jean Paul Vonsattel and the New York Brain Bank/Taub Institute at Columbia University for assistance in obtaining pathological specimens for patients autopsied at their institutions. We also acknowledge Dr Thomas Wisniewski and the New York University Alzheimer’s Disease Center (AG08051), where one patient underwent autopsy.
Funding
This study was supported by grants P01AG019724 (B.L.M.), P50AG023501 (B.L.M.), P30AG10124 (J.Q.T.), P01AG17856 (V.M.-Y.L.) and K23AG045289 (D.C.P.), U54NS092089 (A.L.B.), R01AG038791 (A.L.B.) from the NIH National Institutes of Health, as well as the Tau Consortium, the Consortium for Frontotemporal Dementia Research, the Marie Curie FP7 International Outgoing Fellowship [628812] (R.O.) and the donors of Alzheimer’s Disease Research, a program of BrightFocus Foundation (R.O.).
Supplementary material
Supplementary material is available at Brain online.
Glossary
Abbreviations
- ALS
amyotrophic lateral sclerosis
- bvFTD
behavioural variant frontotemporal dementia
- (CAT)PCA
(categorical) principal component analysis
- CBD
corticobasal degeneration
- DFA
discriminant function analysis
- FTD
frontotemporal dementia
- FTLD
frontotemporal lobar degeneration
- MND
motor neuron disease
- NPI
Neuropsychiatric Inventory
- PSP
progressive supranuclear palsy
- TDP-43
transactive response DNA-binding protein 43 kDa
References
- Alladi S, Xuereb J, Bak T, Nestor P, Knibb J, Patterson K, et al. Focal cortical presentations of Alzheimer's disease. Brain 2007; 130: 2636–45. [DOI] [PubMed] [Google Scholar]
- Bettcher BM, Wilheim R, Rigby T, Green R, Miller JW, Racine CA, et al. C-reactive protein is related to memory and medial temporal brain volume in older adults. Brain Behav Immun 2012; 26: 103–8. [DOI] [PMC free article] [PubMed] [Google Scholar]
- Chare L, Hodges JR, Leyton CE, McGinley C, Tan RH, Kril JJ, et al. New criteria for frontotemporal dementia syndromes: clinical and pathological diagnostic implications. J Neurol Neurosurg Psychiatry 2014; 85: 865–70. [DOI] [PubMed] [Google Scholar]
- Clark CM, Pontecorvo MJ, Beach TG, Bedell BJ, Coleman RE, Doraiswamy PM, et al. Cerebral PET with florbetapir compared with neuropathology at autopsy for detection of neuritic amyloid-beta plaques: a prospective cohort study. Lancet Neurol 2012; 11: 669–78. [DOI] [PubMed] [Google Scholar]
- Cummings JL, Mega M, Gray K, Rosenberg-Thompson S, Carusi DA, Gornbein J. The Neuropsychiatric Inventory: comprehensive assessment of psychopathology in dementia. Neurology 1994; 44: 2308–14. [DOI] [PubMed] [Google Scholar]
- Edwards-Lee T, Miller BL, Benson DF, Cummings JL, Russell GL, Boone K, et al. The temporal variant of frontotemporal dementia. Brain 1997; 120 (Pt 6): 1027–40. [DOI] [PubMed] [Google Scholar]
- Forman MS, Farmer J, Johnson JK, Clark CM, Arnold SE, Coslett HB, et al. Frontotemporal dementia: clinicopathological correlations. Ann Neurol 2006; 59: 952–62. [DOI] [PMC free article] [PubMed] [Google Scholar]
- Hodges JR, Davies RR, Xuereb JH, Casey B, Broe M, Bak TH, et al. Clinicopathological correlates in frontotemporal dementia. Ann Neurol 2004; 56: 399–406. [DOI] [PubMed] [Google Scholar]
- Hyman BT, Trojanowski JQ. Consensus recommendations for the postmortem diagnosis of Alzheimer disease from the National Institute on Aging and the Reagan Institute Working Group on diagnostic criteria for the neuropathological assessment of Alzheimer disease. J Neuropathol Exp Neurol 1997; 56: 1095–7. [DOI] [PubMed] [Google Scholar]
- Hyman BT, Phelps CH, Beach TG, Bigio EH, Cairns NJ, Carrillo MC, et al. National Institute on Aging-Alzheimer's Association guidelines for the neuropathologic assessment of Alzheimer's disease. Alzheimers Dement 2012; 8: 1–13. [DOI] [PMC free article] [PubMed] [Google Scholar]
- Jack CR Jr, Petersen RC, Xu YC, Waring SC, O'Brien PC, Tangalos EG, et al. Medial temporal atrophy on MRI in normal aging and very mild Alzheimer's disease. Neurology 1997; 49: 786–94. [DOI] [PMC free article] [PubMed] [Google Scholar]
- Josephs KA, Hodges JR, Snowden JS, Mackenzie IR, Neumann M, Mann DM, et al. Neuropathological background of phenotypical variability in frontotemporal dementia. Acta Neuropathol 2011; 122: 137–53. [DOI] [PMC free article] [PubMed] [Google Scholar]
- Josephs KA, Petersen RC, Knopman DS, Boeve BF, Whitwell JL, Duffy JR, et al. Clinicopathologic analysis of frontotemporal and corticobasal degenerations and PSP. Neurology 2006; 66: 41–8. [DOI] [PubMed] [Google Scholar]
- Josephs KA, Whitwell JL, Parisi JE, Petersen RC, Boeve BF, Jack CR Jr, et al. Caudate atrophy on MRI is a characteristic feature of FTLD-FUS. Eur J Neurol 2010; 17: 969–75. [DOI] [PMC free article] [PubMed] [Google Scholar]
- Kertesz A, McMonagle P, Blair M, Davidson W, Munoz DG. The evolution and pathology of frontotemporal dementia. Brain 2005; 128: 1996–2005. [DOI] [PubMed] [Google Scholar]
- Knopman DS, Petersen RC, Edland SD, Cha RH, Rocca WA. The incidence of frontotemporal lobar degeneration in Rochester, Minnesota, 1990 through 1994. Neurology 2004; 62: 506–8. [DOI] [PubMed] [Google Scholar]
- Kramer JH, Jurik J, Sha SJ, Rankin KP, Rosen HJ, Johnson JK, et al. Distinctive neuropsychological patterns in frontotemporal dementia, semantic dementia, and Alzheimer disease. Cogn Behav Neurol 2003; 16: 211–18. [DOI] [PubMed] [Google Scholar]
- La Joie R, Perrotin A, Barre L, Hommet C, Mezenge F, Ibazizene M, et al. Region-specific hierarchy between atrophy, hypometabolism, and beta-amyloid (Abeta) load in Alzheimer's disease dementia. J Neurosci 2012; 32: 16265–73. [DOI] [PMC free article] [PubMed] [Google Scholar]
- Lamarre AK, Rascovsky K, Bostrom A, Toofanian P, Wilkins S, Sha SJ, et al. Interrater reliability of the new criteria for behavioral variant frontotemporal dementia. Neurology 2013; 80: 1973–7. [DOI] [PMC free article] [PubMed] [Google Scholar]
- Lee SE, Rabinovici GD, Mayo MC, Wilson SM, Seeley WW, DeArmond SJ, et al. Clinicopathological correlations in corticobasal degeneration. Ann Neurol 2011; 70: 327–40. [DOI] [PMC free article] [PubMed] [Google Scholar]
- Leger GC, Banks SJ. Neuropsychiatric symptom profile differs based on pathology in patients with clinically diagnosed behavioral variant frontotemporal dementia. Dement Geriatr Cogn Disord 2014; 37: 104–12. [DOI] [PMC free article] [PubMed] [Google Scholar]
- Lehmann M, Rohrer JD, Clarkson MJ, Ridgway GR, Scahill RI, Modat M, et al. Reduced cortical thickness in the posterior cingulate gyrus is characteristic of both typical and atypical Alzheimer's disease. J Alzheimers Dis 2010; 20: 587–98. [DOI] [PubMed] [Google Scholar]
- Linting M, van der Kooij A. Nonlinear principal components analysis with CATPCA: a tutorial. J Pers Assess 2012; 94: 12–25. [DOI] [PubMed] [Google Scholar]
- Llado A, Sanchez-Valle R, Rey MJ, Ezquerra M, Tolosa E, Ferrer I, et al. Clinicopathological and genetic correlates of frontotemporal lobar degeneration and corticobasal degeneration. J Neurol 2008; 255: 488–94. [DOI] [PubMed] [Google Scholar]
- Mackenzie IR, Neumann M, Baborie A, Sampathu DM, Du Plessis D, Jaros E, et al. A harmonized classification system for FTLD-TDP pathology. Acta Neuropathol 2011; 122: 111–13. [DOI] [PMC free article] [PubMed] [Google Scholar]
- Mackenzie IR, Neumann M, Bigio EH, Cairns NJ, Alafuzoff I, Kril J, et al. Nomenclature and nosology for neuropathologic subtypes of frontotemporal lobar degeneration: an update. Acta Neuropathol 2010; 119: 1–4. [DOI] [PMC free article] [PubMed] [Google Scholar]
- McKeith IG, Dickson DW, Lowe J, Emre M, O'Brien JT, Feldman H, et al. Diagnosis and management of dementia with Lewy bodies: third report of the DLB Consortium. Neurology 2005; 65: 1863–72. [DOI] [PubMed] [Google Scholar]
- Morris JC. The Clinical Dementia Rating (CDR): current version and scoring rules. Neurology 1993; 43: 2412–14. [DOI] [PubMed] [Google Scholar]
- Mueller SG, Laxer KD, Barakos J, Cheong I, Garcia P, Weiner MW. Subfield atrophy pattern in temporal lobe epilepsy with and without mesial sclerosis detected by high-resolution MRI at 4 Tesla: preliminary results. Epilepsia 2009; 50: 1474–83. [DOI] [PMC free article] [PubMed] [Google Scholar]
- Neary D, Snowden JS, Gustafson L, Passant U, Stuss D, Black S, et al. Frontotemporal lobar degeneration: a consensus on clinical diagnostic criteria. Neurology 1998; 51: 1546–54. [DOI] [PubMed] [Google Scholar]
- Ossenkoppele R, Pijnenburg YA, Perry DC, Cohn-Sheehy BI, Scheltens NM, Vogel JW, et al. The behavioural/dysexecutive variant of Alzheimer's disease: clinical, neuroimaging and pathological features. Brain 2015; 138: 2732–49. [DOI] [PMC free article] [PubMed] [Google Scholar]
- Rankin KP, Gorno-Tempini ML, Allison SC, Stanley CM, Glenn S, Weiner MW, et al. Structural anatomy of empathy in neurodegenerative disease. Brain 2006; 129: 2945–56. [DOI] [PMC free article] [PubMed] [Google Scholar]
- Rascovsky K, Hodges JR, Knopman D, Mendez MF, Kramer JH, Neuhaus J, et al. Sensitivity of revised diagnostic criteria for the behavioural variant of frontotemporal dementia. Brain 2011; 134 (Pt 9): 2456–77. [DOI] [PMC free article] [PubMed] [Google Scholar]
- Ratnavalli E, Brayne C, Dawson K, Hodges JR. The prevalence of frontotemporal dementia. Neurology 2002; 58: 1615–21. [DOI] [PubMed] [Google Scholar]
- Rohrer JD, Geser F, Zhou J, Gennatas ED, Sidhu M, Trojanowski JQ, et al. TDP-43 subtypes are associated with distinct atrophy patterns in frontotemporal dementia. Neurology 2010; 75: 2204–11. [DOI] [PMC free article] [PubMed] [Google Scholar]
- Rohrer JD, Lashley T, Schott JM, Warren JE, Mead S, Isaacs AM, et al. Clinical and neuroanatomical signatures of tissue pathology in frontotemporal lobar degeneration. Brain 2011; 134: 2565–81. [DOI] [PMC free article] [PubMed] [Google Scholar]
- Rosen HJ, Gorno-Tempini ML, Goldman WP, Perry RJ, Schuff N, Weiner M, et al. Patterns of brain atrophy in frontotemporal dementia and semantic dementia. Neurology 2002a; 58: 198–208. [DOI] [PubMed] [Google Scholar]
- Rosen HJ, Hartikainen KM, Jagust W, Kramer JH, Reed BR, Cummings JL, et al. Utility of clinical criteria in differentiating frontotemporal lobar degeneration (FTLD) from AD. Neurology 2002b; 58: 1608–15. [DOI] [PubMed] [Google Scholar]
- Seelaar H, Klijnsma KY, de Koning I, van der Lugt A, Chiu WZ, Azmani A, et al. Frequency of ubiquitin and FUS-positive, TDP-43-negative frontotemporal lobar degeneration. J Neurol 2010; 257: 747–53. [DOI] [PMC free article] [PubMed] [Google Scholar]
- Seeley WW, Bauer AM, Miller BL, Gorno-Tempini ML, Kramer JH, Weiner M, et al. The natural history of temporal variant frontotemporal dementia. Neurology 2005; 64: 1384–90. [DOI] [PMC free article] [PubMed] [Google Scholar]
- Seeley WW, Crawford R, Rascovsky K, Kramer JH, Weiner M, Miller BL, et al. Frontal paralimbic network atrophy in very mild behavioral variant frontotemporal dementia. Arch Neurol 2008; 65: 249. [DOI] [PMC free article] [PubMed] [Google Scholar]
- Seeley WW, Crawford RK, Zhou J, Miller BL, Greicius MD. Neurodegenerative diseases target large-scale human brain networks. Neuron 2009; 62: 42–52. [DOI] [PMC free article] [PubMed] [Google Scholar]
- Shi J, Shaw CL, Du Plessis D, Richardson AM, Bailey KL, Julien C, et al. Histopathological changes underlying frontotemporal lobar degeneration with clinicopathological correlation. Acta Neuropathol 2005; 110: 501–12. [DOI] [PubMed] [Google Scholar]
- Snowden J, Neary D, Mann D. Frontotemporal lobar degeneration: clinical and pathological relationships. Acta Neuropathol 2007; 114: 31–8. [DOI] [PubMed] [Google Scholar]
- Snowden JS, Hu Q, Rollinson S, Halliwell N, Robinson A, Davidson YS, et al. The most common type of FTLD-FUS (aFTLD-U) is associated with a distinct clinical form of frontotemporal dementia but is not related to mutations in the FUS gene. Acta Neuropathol 2011; 122: 99–110. [DOI] [PubMed] [Google Scholar]
- Tartaglia MC, Sidhu M, Laluz V, Racine C, Rabinovici GD, Creighton K, et al. Sporadic corticobasal syndrome due to FTLD-TDP. Acta Neuropathol 2010; 119: 365–74. [DOI] [PMC free article] [PubMed] [Google Scholar]
- Thompson SA, Patterson K, Hodges JR. Left/right asymmetry of atrophy in semantic dementia: behavioral-cognitive implications. Neurology 2003; 61: 1196–203. [DOI] [PubMed] [Google Scholar]
- Urwin H, Josephs KA, Rohrer JD, Mackenzie IR, Neumann M, Authier A, et al. FUS pathology defines the majority of tau- and TDP-43-negative frontotemporal lobar degeneration. Acta Neuropathol 2010; 120: 33–41. [DOI] [PMC free article] [PubMed] [Google Scholar]
- Whitwell JL, Jack CR Jr, Parisi JE, Knopman DS, Boeve BF, Petersen RC, et al. Imaging signatures of molecular pathology in behavioral variant frontotemporal dementia. J Mol Neurosci 2011a; 45: 372–8. [DOI] [PMC free article] [PubMed] [Google Scholar]
- Whitwell JL, Jack CR Jr, Przybelski SA, Parisi JE, Senjem ML, Boeve BF, et al. Temporoparietal atrophy: a marker of AD pathology independent of clinical diagnosis. Neurobiol Aging 2011b; 32: 1531–41. [DOI] [PMC free article] [PubMed] [Google Scholar]
Associated Data
This section collects any data citations, data availability statements, or supplementary materials included in this article.