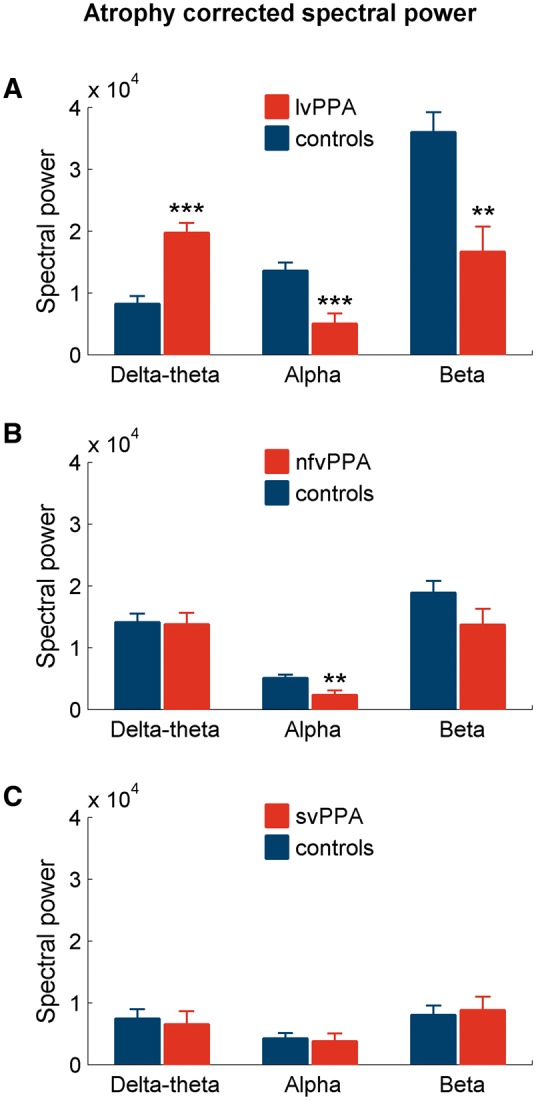
Figure 5.

Patterns of spectral power differences after correcting for cortical atrophy. The bar plots depict the results from general linear model analysis of spectral power values including the cortical grey matter volumes as a covariate, comparing each PPA variant and controls, for each frequency. The stars indicate statistically significant differences between patients and controls at each frequency. (A) lvPPA versus controls; (B) nfvPPA versus controls; (C) svPPA versus controls. **P < 0.01; ***P < 0.001.
