

REM sleep is regulated by the cholinergic system, which shows early degeneration in Parkinson’s disease with cognitive impairment. Latreille et al . reveal that EEG abnormalities during REM sleep predict subsequent dementia in patients with Parkinson’s disease. These prodromal biomarkers will aid early diagnosis and identification of patients for neuroprotective trials.
Keywords: Parkinson’s disease, electroencephalography, sleep, wakefulness, dementia

REM sleep is regulated by the cholinergic system, which shows early degeneration in Parkinson’s disease with cognitive impairment. Latreille et al . reveal that EEG abnormalities during REM sleep predict subsequent dementia in patients with Parkinson’s disease. These prodromal biomarkers will aid early diagnosis and identification of patients for neuroprotective trials.
Abstract
In Parkinson’s disease, electroencephalographic abnormalities during wakefulness and non-rapid eye movement sleep (spindles) were found to be predictive biomarkers of dementia. Because rapid eye movement sleep is regulated by the cholinergic system, which shows early degeneration in Parkinson’s disease with cognitive impairment, anomalies during this sleep stage might mirror dementia development. In this prospective study, we examined baseline electroencephalographic absolute spectral power across three states of consciousness (non-rapid eye movement sleep, rapid eye movement sleep, and wakefulness) in 68 non-demented patients with Parkinson’s disease and 44 healthy controls. All participants underwent baseline polysomnographic recordings and a comprehensive neuropsychological assessment. Power spectral analyses were performed on standard frequency bands. Dominant occipital frequency during wakefulness and ratios of slow-to-fast frequencies during rapid eye movement sleep and wakefulness were also computed. At follow-up (an average 4.5 years after baseline), 18 patients with Parkinson’s disease had developed dementia and 50 patients remained dementia-free. In rapid eye movement sleep, patients with Parkinson’s disease who later developed dementia showed, at baseline, higher absolute power in delta and theta bands and a higher slowing ratio, especially in temporal, parietal, and occipital regions, compared to patients who remained dementia-free and controls. In non-rapid eye movement sleep, lower baseline sigma power in parietal cortical regions also predicted development of dementia. During wakefulness, patients with Parkinson’s disease who later developed dementia showed lower dominant occipital frequency as well as higher delta and slowing ratio compared to patients who remained dementia-free and controls. At baseline, higher slowing ratios in temporo-occipital regions during rapid eye movement sleep were associated with poor performance on visuospatial tests in patients with Parkinson’s disease. Using receiver operating characteristic curves, we found that best predictors of dementia in Parkinson’s disease were rapid eye movement sleep slowing ratios in posterior regions, wakefulness slowing ratios in temporal areas, and lower dominant occipital frequency. These results suggest that electroencephalographic slowing during sleep is a new promising predictive biomarker for Parkinson’s disease dementia, perhaps as a marker of cholinergic denervation.
Introduction
In recent decades, the importance of identifying prodromal stages and early markers of neurodegenerative diseases has become increasingly recognized. Several studies suggest that EEG can identify early signs of cognitive decline in pathologies such as mild cognitive impairment (MCI), Alzheimer’s disease, dementia with Lewy bodies, and Parkinson’s disease ( Klassen et al. , 2011 ; Poil et al. , 2013 ; Bonanni et al. , 2015 ). Because dementia in Parkinson’s disease is both common ( Hely et al. , 2008 ) and devastating, identifying early dementia markers is essential. Some predictors of dementia in MCI and Alzheimer’s disease have been observed in wakefulness, rapid eye movement (REM) sleep, and non-rapid eye movement (N-REM) sleep, with specific dysfunction patterns ( Petit et al. , 1993 ; Bonanni et al., 2008 ; Luckhaus et al. , 2008 ; Rauchs et al. , 2008 ; Westerberg et al. , 2012 ; Brayet et al. , 2015 ).
In cross-sectional studies of Parkinson’s disease, EEG abnormalities during wakefulness are found early in the disease ( Serizawa et al. , 2008 ; Han et al. , 2013 ), and worsen with the onset of cognitive impairment ( Caviness et al. , 2007 ; Babiloni et al. , 2011 ; Schlede et al. , 2011 ; Bousleiman et al. , 2014 ). Most of these studies found waking EEG slowing in Parkinson’s disease, as measured by higher power in lower frequencies (delta and theta) and lower power in faster frequencies (alpha and beta). Very few prospective EEG studies have been conducted in Parkinson’s disease; some findings suggest that higher relative power in lower frequencies (delta or theta) and downward spectral peak shift of alpha rhythms in posterior cortical regions predicts dementia development in Parkinson’s disease ( Klassen et al. , 2011 ; Caviness et al. , 2015 ).
In contrast to waking EEG, the connection between sleep EEG and Parkinson’s disease dementia received little attention. Recently, our group found that lower sleep spindle density and amplitude in posterior cortical areas predicted dementia development in Parkinson’s disease ( Latreille et al. , 2015 ). These sleep spindle abnormalities in Parkinson’s disease may reflect dysfunction in brain plastic mechanisms associated with learning and memory, possibly associated with both structural and functional cortical-subcortical alterations (i.e. thalamus, brainstem, posterior areas) ( Jellinger, 2012 ; Svenningsson et al. , 2012 ; Menke et al. , 2014 ).
The neurochemical basis of cognitive decline in Parkinson’s disease is likely due to several mechanisms, including dopaminergic, cholinergic, and noradrenergic dysfunctions ( Kehagia et al. , 2010 ; Gratwicke et al. , 2015 ). Recently, neuropathological evidence suggests that cholinergic degeneration may be especially key to early cognitive impairment in Parkinson’s disease ( Kehagia et al. , 2010 ; Gratwicke et al. , 2015 ). For instance, in vivo imaging studies found profound cortical cholinergic depletion in Parkinson’s disease, with more widespread reductions in acetylcholinesterase activity in demented patients ( Bohnen and Albin, 2011 ). Several studies have also found significant cholinergic depletion in both the basal forebrain and the brainstem in Parkinson’s disease patients with cognitive impairment ( Francis and Perry, 2007 ; Bohnen and Albin, 2011 ; Hall et al. , 2014 ; Liu et al. , 2015 ).
Compared to N-REM sleep, where cholinergic activity is nearly absent, both REM sleep and wakefulness are associated with high levels of acetylcholine release ( Hobson and Pace-Schott, 2002 ; McCarley, 2007 ; Platt and Riedel, 2011 ). Moreover, REM sleep differs from wakefulness in that its sustained activity is mainly cholinergic, with very little input from other neurotransmitter systems (i.e. noradrenaline, serotonin, and dopamine) ( McCarley, 2007 ). Therefore, REM sleep is the ideal condition in which to investigate cholinergic transmission integrity. Only a few cross-sectional studies investigated REM sleep EEG activity in Parkinson’s disease, showing slightly higher relative alpha power and lower beta power in Parkinson’s disease patients compared to controls ( Wetter et al. , 2001 ; Margis et al. , 2015 ). However, no study to date examined whether REM sleep EEG abnormalities are related to cognitive decline in Parkinson’s disease.
This prospective study aimed to assess if baseline REM sleep EEG activity could predict dementia in Parkinson’s disease. For comparison analysis, we also performed resting-state EEG power spectral analysis. Finally, given the potential association between sleep spindle activity and cognitive decline in Parkinson’s disease ( Latreille et al. , 2015 ), we examined if N-REM sleep EEG alterations, especially in the sigma-frequency band (∼12–15 Hz), could also predict dementia in Parkinson’s disease.
Materials and methods
Participants
Patients were recruited from the movement disorders clinics of the McGill University Health Centre and the Centre Hospitalier de l’Université de Montréal (Montreal, Canada) as part of our ongoing longitudinal study on sleep and cognition in Parkinson’s disease ( Anang et al. , 2014 ; Fereshtehnejad et al. , 2015 ; Latreille et al. , 2015 ). A group of healthy participants recruited by word-of-mouth and through newspaper advertisements was included for baseline comparisons. The hospital’s ethical committee approved the study and all subjects gave written informed consent to participate. All participants underwent a complete neuropsychological assessment, a clinical and neurological exam, and one night of polysomnographic recording in the sleep laboratory at baseline. All patients had at least one follow-up visit at a minimum of 2 years after baseline examination.
All patients had a clinical diagnosis of idiopathic Parkinson’s disease, confirmed by a movement disorder specialist (R.B.P.). Exclusion criteria are described elsewhere ( Latreille et al. , 2015 ). Briefly, participants were excluded if they had dementia at baseline; major psychiatric disorders; history of cerebrovascular disease, head injury, stroke; or abnormal EEG characteristics suggestive of epilepsy. During the study, Parkinson’s disease patients took their usual medications at night ( Table 1 ), whereas controls were free from any medication known to influence sleep. Disease and motor severity were assessed in Parkinson’s disease patients using the Hoehn and Yahr scale and Part III of the Unified Parkinson’s Disease Rating Scale (UPDRS-III) ( Hoehn and Yahr, 1967 ; Fahn and Elton, 1987 ). The severity of depressive and anxiety symptoms was measured using the Beck Depression Inventory, Second Edition (BDI-II) and the Beck Anxiety Inventory (BAI; Beck et al. , 1961 , 1988 ).
Table 1.
Baseline demographic, clinical, and polysomnographic characteristics
| Characteristics | PDD | PDnD | Controls | P- value |
|---|---|---|---|---|
| n = 18 | n = 50 | n = 44 | ||
| A | B | C | ||
| Gender, % male | 72 | 66 | 68 | 0.83 |
| Age, y | 70.2 ± 7.6 | 63.0 ± 8.5 | 64.8 ± 10.9 | 0.02; A>B |
| Education, y | 14.4 ± 3.8 | 14.3 ± 4.1 | 14.3 ± 3.7 | 0.99 |
| Follow-up duration, y a | 4.6 ± 1.5 | 3.9 ± 1.8 | - | 0.15 |
| Disease duration, y a | 5.7 ± 4.5 | 4.1 ± 3.1 | - | 0.26 |
| Hoehn and Yahr stage | 2.8 ± 0.9 | 2.1 ± 0.8 | - | 0.007 |
| UPDRS part III ‘on’ | 21.5 ± 12.5 | 22.8 ± 10.1 | - | 0.67 |
| RBD, n (%) | 16 (89) | 20 (40) | - | 0.0001 |
| MCI, n (%) | 16 (89) | 21 (42) | - | 0.001 |
| Levodopa equivalent dosage, mg | 645.6 ± 335.3 | 416.2 ± 319.2 | - | 0.01 |
| Non-dopaminergic medication, % b | 42 | 50 | - | 0.56 |
| BDI-II score c | 12.7 ± 9.4 | 9.6 ± 5.8 | 5.3 ± 5.6 | <0.001; A>C, B>C |
| BAI score c | 13.9 ± 11.2 | 9.5 ± 6.1 | 5.5 ± 6.2 | 0.002; A>C |
| Polysomnographic | ||||
| Sleep latency, min c | 28.6 ± 36.0 | 16.0 ± 17.4 | 18.8 ± 22.0 | 0.46 |
| Total sleep time, min | 337.8 ± 133.0 | 357.3 ± 82.4 | 384.3 ± 63.1 | 0.11 |
| Sleep efficiency, % | 72.6 ± 20.7 | 77.2 ± 15.8 | 81.9 ± 11.4 | 0.08 |
| REM sleep efficiency, % | 84.8 ± 14.5 | 88.1 ± 12.8 | 83.2 ± 11.3 | 0.16 |
| Stage 1, min c | 34.9 ± 20.4 | 44.6 ± 30.4 | 43.4 ± 21.9 | 0.34 |
| Stage 2, min | 186.6 ± 80.2 | 222.7 ± 72.4 | 249.3 ± 54.1 | 0.004; A<C |
| Slow wave sleep, min c | 45.0 ± 41.4 | 31.7 ± 34.7 | 23.6 ± 24.9 | 0.10 |
| REM sleep, min c | 71.3 ± 62.2 | 58.3 ± 30.0 | 68.0 ± 21.4 | 0.16 |
a Mann-Whitney U-test.
b Non-dopaminergic medication included antiparkinsonians, acetylcholinesterase inhibitors, antidepressants, and benzodiazepines.
c Kruskal-Wallis ANOVA.
Results are expressed as mean ± standard deviation.
Procedures
Cognitive assessment
All participants underwent a neuropsychological assessment at baseline, and at follow-up examination, all Parkinson’s disease patients were offered a comprehensive neuropsychological assessment. Cognitive status was determined by consensus between the neurologist (R.B.P.) and neuropsychologist (J.F.G.). Dementia diagnosis was based on the proposed Movement Disorder Society Task Force Level II criteria, and defined as impairment in at least two cognitive domains on neuropsychological tests, along with evidence of significant impairment in daily functioning ( Dubois et al. , 2007 ). MCI diagnosis was based on the following criteria: (i) subjective cognitive complaint reported by either the patient or caregivers or observed by the clinician; (ii) objective evidence of cognitive decline on neuropsychological assessment defined as at least two scores of 1.5 standard deviations below the standardized mean in a cognitive domain; (iii) the cognitive decline cannot significantly compromise activities of daily living; and (iv) no other medical or psychiatric conditions may explain the observed cognitive deficits ( Litvan et al. , 2012 ). The Mini-Mental State Examination or the Montreal Cognitive Assessment were also completed when possible ( Folstein et al. , 1975 ; Nasreddine et al. , 2005 ). If at follow-up patients were unable to be assessed in person due to severe disability or dementia, a telephone follow-up was performed with the patient and/or spouse, or cases were reviewed with the treating physician.
The neuropsychological assessment included five cognitive domains: executive functions, attention, language, verbal episodic memory and learning, and visuospatial abilities (see Latreille et al. , 2015 for details on neuropsychological variables, tests references, and normative data). Neuropsychological Z-scores were averaged for each domain to provide a composite score, as follows: (i) attention [Digit Span from the Wechsler Adult Intelligence Scale – Third Edition, Trail Making Test Part A (time), Stroop Colour Word Test Part 3-2 (time and error)]; (ii) executive functions [Trail Making Test Part B (time), semantic and phonetic verbal fluency, Stroop Colour Word Test Part 4-3 (time and error)]; (iii) verbal episodic memory and learning [Rey Auditory Verbal Learning Test (sum of trials 1 to 5, list B, immediate and delayed recalls, and recognition)]; (iv) visuospatial abilities (copy of the Rey Complex Figure Test, Block Design from the Wechsler Adult Intelligence Scale – Third Edition); and (v) language (Boston Naming Test, Vocabulary subtest of the Wechsler Adult Intelligence Scale – Third Edition).
This patient cohort was involved in a previous study investigating sleep spindles and slow wave characteristics in Parkinson’s disease ( Latreille et al. , 2015 ). A total of 82 patients initially entered the longitudinal follow-up study. Fourteen patients (17%) were excluded: two refused re-assessment, eight had died, one was unreachable, and three had baseline EEG recordings that were unusable for analysis because of technical problems. Therefore, 68 patients with Parkinson’s disease and 44 healthy controls were included. Within the whole sample, 18 patients (26%) developed dementia (PDD) at follow-up and 50 patients (74%) remained dementia-free (PDnD).
Of the patients with Parkinson’s disease, 41 underwent a complete neuropsychological assessment at the follow-up visit (seven with dementia; 34 dementia-free), 18 were assessed with validated cognitive screening tests (Montreal Cognitive Assessment and/or Mini-Mental State Examination; nine with dementia; nine dementia-free), and nine were assessed with telephone interview (two with dementia; seven dementia-free) by an expert neurologist (R.B.P.). Because some patients could not be assessed with cognitive tests at follow-up, we performed a secondary analysis only in the subgroup of patients who completed a cognitive assessment (PDD, n = 16; PDnD, n = 43).
Polysomnographic recording
The polysomnography montage included frontal (F3, F4), central (C3, C4), temporal (T3, T4, T5, T6), parietal (P3, P4), and occipital (O1, O2) EEG leads with linked ears reference at 10 kΩ resistance, a bilateral electrooculogram, and chin electromyographic recordings. Respiration was monitored using a nasal canula or a nasal/oral thermistor with thoracic and abdominal strain gauges. Leg movements were recorded using surface electrodes on the left and right anterior tibialis muscles. Polysomnography was recorded with a Grass polygraph (amplifier gain 10 000; bandpass 0.3–100 Hz), and signals were digitized at a sampling rate of 256 Hz using Harmonie software (Stellate Systems). N-REM sleep stages were visually scored on 30-s epochs according to the American Academy of Sleep Medicine criteria ( American Academy of Sleep Medicine, 2005 ). REM sleep was scored in all subjects according to the Lapierre and Montplaisir method ( Lapierre and Montplaisir, 1992 ; Montplaisir et al. , 2010 ). In patients with Parkinson’s disease, REM sleep behaviour disorder (RBD) was diagnosed according to standard clinical and polysomnographic criteria ( American Academy of Sleep Medicine, 2005 ; Montplaisir et al. , 2010 ). Wakefulness EEG was recorded for 10 min at least half-an-hour after waking the next morning and while participants were lying in bed with their eyes closed (wakefulness at rest). To avoid drowsiness, participants were asked to open their eyes at regular intervals. Polysomnography variables included sleep latency and efficiency, REM sleep efficiency, total sleep duration, and sleep stage duration.
Quantitative EEG analysis
All quantitative EEG analyses were performed on derivations F3, F4, C3, C4, T3, T4, T5, T6, P3, P4, O1, and O2. Spectral analyses of N-REM sleep, REM sleep, and wakefulness at rest were computed using Harmonie software (Stellate Systems). Fast Fourier Transformation (cosine tapering) on 2-s artefact-free sections yielded a spectral resolution of 0.5 Hz.
For N-REM sleep (stages N2 and N3), electromyographic artefacts were automatically and visually detected and then rejected before analysis. Epochs containing artefacts were considered missing data to preserve sleep continuity. Fifteen 2-s spectral epochs were averaged to preserve correspondence with the 30-s sleep scoring windows. Absolute spectral power in the delta (0.5–4 Hz), theta (4–8 Hz), alpha (8–12 Hz), sigma (12–15 Hz), and beta (15–32 Hz) frequency ranges was averaged over the entire N-REM sleep period. For REM sleep and wake, EEG sections (minimum duration of 2 s) free of eye movements or artefacts were visually selected for a total of 96 s per state per subject. REM sleep sections were sampled from all REM periods. For wakefulness, the first 96-s artefact-free sections were selected. Of note, REM sleep and wake frequency ranges were defined differently from those in the N-REM state, because sigma power (the frequency range of EEG spindles), was examined in N-REM sleep only. Therefore, for both REM sleep and wakefulness, absolute spectral power was computed for the following frequency bands: delta (0.5–4 Hz), theta (4–8 Hz), alpha (8–13 Hz), and beta (13–32 Hz). The slowing ratio of slow-to-fast frequencies [(delta + theta)/(alpha + beta)] was calculated for REM sleep and wakefulness EEG. The dominant occipital frequency was defined as the average peak alpha rhythm frequency (8–13 Hz) observed in spectra at O1 and O2 for each participant during wakefulness.
All participants could be included in the N-REM sleep EEG analysis. Seven patients with Parkinson’s disease (PDD, n = 4; PDnD, n = 3) were excluded from REM sleep analysis either because they did not have an REM sleep period, or a 96-s artefact-free section. Wakefulness EEG was performed in 64 patients with Parkinson’s disease and 41 control subjects (wakefulness EEG recordings were not available or unusable due to significant artefacts in three PDD patients, one PDnD patient, and three controls).
Statistical analysis
One-way analyses of variance (ANOVAs), independent sample t -tests, or Pearson’s Chi-square tests were performed at baseline to compare patients with Parkinson’s disease who remained dementia-free (PDnD), patients with Parkinson’s disease who developed dementia (PDD), and healthy subjects. Skewness and kurtosis were measured to determine normality, with acceptable values ranging from 1 to −1. Non-parametric equivalent tests (demographic and clinical data) or logarithmic transformations (absolute EEG spectral values) were used for variables that were not normally distributed. Preliminary ANOVAs with three groups and one repeated measure (two hemispheres: left–right) were performed on each derivation (F3, F4, C3, C4, T3, T4, T5, T6, P3, P4, O1, and O2) to identify significant group–hemisphere interactions for all spectral frequency bands in each brain state (N-REM sleep, REM sleep, and wakefulness). No significant group–hemisphere interaction was found, so results for each hemisphere were averaged.
ANOVAs with group as a factor (three groups: PDD patients, PDnD patients, and controls) and one repeated measure (five derivations: frontal, central, temporal, parietal, and occipital) were then computed for each dependant variable. Analyses of covariance (ANCOVAs) were performed to exclude potential confounds (i.e. disease-related variables, dopaminergic medication, depression, and anxiety). Variables showing significant group differences or relationships with EEG spectral measures were selected as co-variables and tested individually in each ANCOVA (see Supplementary material for detailed correlation results; because all co-variables provided similar results, we report F- and P -values using the BAI or BDI-II as a covariate for the ANCOVAs). P -values were adjusted for sphericity with the Huynh-Feldt correction for repeated measures with more than two levels, but original degrees of freedom are reported. Mean comparison analyses were performed with Tukey’s post hoc test. Simple effect analyses were run to decompose significant interactions, and Tukey’s post hoc tests were performed to compare between-group differences. Supplementary analyses were also performed using a subgroup of age- and sex-matched controls to PDD patients, as well as in the subgroup of PDnD patients according to the presence or not of RBD and MCI, which are well-known risk factors for dementia development ( Supplementary material ).
For both Parkinson’s disease groups, we performed Spearman correlations between cognitive composite scores (averaged Z scores) and EEG variables that were associated with dementia. Due to the large number of comparisons, we adjusted for the false discovery rate using the Benjamini–Hochberg procedure on P -values ( Benjamini and Hochberg, 1995 ). Corrected P -thresholds ( P ' < 0.05) are reported. Of note, the language composite score was excluded from the analysis due to incomplete data. We then calculated receiver operator characteristic (ROC) curves to measure the sensitivity and specificity of EEG spectral variables to predict dementia outcome in PDD and controls. The optimal cut-off value was defined as the highest score when combining sensitivity and specificity. Finally, we performed stepwise binary logistic regressions to assess whether the addition of EEG measures to the well-established cognitive predictors of dementia in Parkinson’s disease increases the probability of correctly identifying demented patients. Since previous reports suggest that visuospatial deficits are particularly associated with dementia risk in Parkinson’s disease ( Williams-Gray et al. , 2009 ; Kehagia et al. , 2010 ), the visuospatial composite score was selected as the first independent factor, then the EEG measures associated with dementia in our study were added to the model. Statistical significance was defined at P < 0.05.
Results
Demographic, clinical and polysomnographic variables
Gender, education level, follow-up duration, disease duration, and severity of motor symptoms at baseline did not differ significantly between patients who developed dementia and those who did not ( Table 1 ). Compared to PDnD patients, PDD patients were older, had higher Hoehn and Yahr stage, were more likely to have concomitant RBD or MCI, and took higher levodopa doses at baseline visit. Both patient groups reported more severe depressive symptoms compared to controls. PDD patients also showed more severe anxiety symptoms compared to controls. For the polysomnography variables, PDD patients had less stage 2 sleep at baseline compared to controls, but not compared to PDnD.
Quantitative EEG analysis
REM sleep
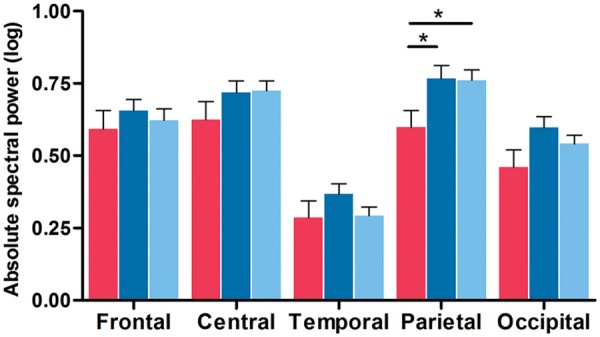
Several correlations were found between clinical variables and REM sleep EEG measures ( Supplementary material ). ANCOVAs with the BAI as covariant showed significant interactions between groups and derivations for delta [ F (8,320) = 2.5; P = 0.03] and theta [ F (8,320) = 2.3; P = 0.05] frequency bands. As shown in Fig. 1 A and B, PDD patients had at baseline higher delta power than controls (frontal, temporal, parietal, and occipital derivations) and PDnD patients (frontal, parietal, and occipital derivations). PDnD patients had higher delta power than controls in frontal, temporal, parietal, and occipital derivations. Higher theta power was also found in PDD patients compared to both PDnD patients and controls in all derivations. PDnD patients showed higher theta power than controls in temporal and parietal derivations. No significant differences were seen for REM sleep alpha or beta spectral power ( Supplementary material and Supplementary Fig. 1A and B ). For the REM sleep slowing ratio, ANCOVAs with the BDI-II as covariant showed significant interactions between groups and derivations [ F (8,368) = 8.8; P < 0.00001]. PDD patients had a higher ratio of slow-to-fast frequencies compared to PDnD patients and controls in all derivations, but this effect was more prominent in parietal and occipital derivations ( Fig. 1 C).
Figure 1.

PDD patients showed higher REM sleep EEG slowing. Absolute spectral power in the delta ( A ) and theta ( B ) frequency bands, and slow-to-fast frequencies ratio ( C ) for each derivation in PDD patients (red), PDnD patients (dark blue), and controls (light blue). Post hoc analyses: * P < 0.05. Results are expressed as mean (± standard error of the mean).
In Parkinson’s disease, significant negative correlations were found between visuospatial composite score and REM sleep EEG slowing in temporal and occipital derivations (r s = −0.36 and r s = −0.35, respectively; P’ = 0.04), indicating that higher slow-to-fast frequency ratios in posterior regions were associated with poorer performance on visuospatial tests. No significant correlations were found between cognitive and REM sleep EEG data in controls.
Wakefulness
Significant correlations were found between clinical variables and wakefulness EEG measures ( Supplementary material ). ANCOVAs with the BAI as covariant showed significant interactions between groups and derivations for the delta band only [ F (8,356) = 2.1; P = 0.05]. PDD patients had higher delta power compared to PDnD patients and controls in all derivations ( Fig. 2 A). PDnD patients also showed higher delta power than controls in all derivations. No significant differences were seen for wake theta, alpha, or beta spectral power ( Supplementary material and Supplementary Fig. 1C–E ). For the wakefulness slowing ratio, the ANOVAs showed significant interactions between groups and derivations [ F (8,408) = 5.4; P = 0.0005]. As shown in Fig. 2 B, PDD patients had a higher ratio of slow-to-fast frequencies compared to PDnD patients and controls in all derivations, but this effect was more prominent in parietal and occipital derivations. A significant group effect was found for the dominant occipital frequency [ F (2,102) = 7.7; P = 0.0008]. PDD patients had lower occipital alpha peak frequency than both PDnD patients and controls (8.1 ± 1.0; 8.9 ± 1.1; 9.3 ± 1.1, respectively; Fig. 2 C).
Figure 2.

PDD patients showed higher wake EEG slowing, paralleled by a lower occipital alpha peak frequency. ( A ) Delta absolute spectral power and slow-to-fast frequencies ratio ( B ) for each derivation in PDD patients (red), PDnD patients (dark blue), and controls (light blue). Post hoc analyses: * P < 0.05. Results are expressed as mean (± standard error of the mean). ( C ) Scatter plot distribution of all subjects showing lower mean alpha peak frequency at occipital electrodes (black reference line at the mean of data), * P < 0.05; ** P < 0.001.
By contrast, no significant correlations were found between wake EEG variables and baseline cognitive composite scores in patients with Parkinson’s disease or controls.
N-REM sleep
Correlations between clinical and N-REM sleep EEG variables are described in the Supplementary material . ANCOVAs with BAI as covariant showed significant interactions between groups and derivations for the sigma [ F (8,352) = 3.5; P = 0.004] frequency band only. PDD patients showed lower sigma power in parietal derivations compared to PDnD patients and controls ( Fig. 3 ). No significant differences were found for N-REM sleep delta, theta, alpha, or beta spectral power ( Supplementary material and Supplementary Fig. 1F–I ).
Figure 3.
PDD patients showed lower N-REM sleep EEG sigma power. Absolute spectral power in the sigma frequency band for each derivation in PDD patients (red), PDnD patients (dark blue), and controls (light blue). Post hoc analyses: * P < 0.05. Results are expressed as mean (± standard error of the mean).
No significant correlations were found between N-REM sleep EEG variables and cognitive composite scores in patients with Parkinson’s disease or controls.
We performed a secondary sensitivity analysis restricting to patients with Parkinson’s disease who completed a cognitive assessment at follow-up. We found similar results for REM sleep, wakefulness, and N-REM sleep spectral variables.
ROC curve analysis
ROC curve optimal cut-off values for all significant REM sleep, wakefulness, and N-REM sleep spectral variables for PDD patients and control subjects are presented in Table 2 . The variables that had the highest combined sensitivity and specificity to identify patients who would develop dementia were the REM sleep slowing ratios in temporal and occipital areas, the wakefulness slowing ratio in temporal regions, and the dominant occipital frequency.
Table 2.
ROC curves data in PDD patients and controls
| Spectral measures | Cut-off value | Sensitivity | Specificity | AUC |
|---|---|---|---|---|
| % | % | |||
| REM sleep a | ||||
| Slow-to-fast ratio: Frontal | 3.33 | 64 | 48 | 0.58 (ns) |
| Slow-to-fast ratio: Central | 2.83 | 64 | 50 | 0.61 (ns) |
| Slow-to-fast ratio: Temporal | 2.33 | 86 | 61 | 0.78 |
| Slow-to-fast ratio: Parietal | 2.99 | 71 | 71 | 0.77 |
| Slow-to-fast ratio: Occipital | 3.73 | 71 | 82 | 0.82 |
| Wake b | ||||
| Slow-to-fast ratio: Frontal | 1.15 | 73 | 71 | 0.75 |
| Slow-to-fast ratio: Central | 0.83 | 73 | 66 | 0.74 |
| Slow-to-fast ratio: Temporal | 0.80 | 80 | 76 | 0.81 |
| Slow-to-fast ratio: Parietal | 0.68 | 73 | 61 | 0.78 |
| Slow-to-fast ratio: Occipital | 0.78 | 73 | 71 | 0.81 |
| DOF | 8.35 | 73 | 83 | 0.79 |
| N-REM sleep | ||||
| Sigma power: Parietal | 4.53 | 67 | 68 | 0.70 |
a PDD, n = 14;.
b PDD, n = 15, Controls, n = 41.
AUC = area under the curve; ns = non-significant; DOF = dominant occipital frequency.
Logistic regression analysis
Using stepwise logistic regression to control for visuospatial composite score, we found that occipital wake EEG slowing [odds ratio (OR) = 40.73; 95% confidence interval (CI): 1.75–949.95, P = 0.02] and dominant occipital frequency (OR = 3.95; CI: 1.07–14.71, P = 0.04) predicted significantly dementia outcome in Parkinson’s disease. The addition of the REM sleep slowing ratio and N-REM sleep sigma power did not independently contribute significantly to dementia prediction.
Discussion
In this prospective study, we showed that REM sleep EEG abnormalities can predict development to dementia in Parkinson’s disease. More specifically, we found marked REM sleep EEG slowing in patients with Parkinson’s disease who later developed dementia, characterized by a higher slowing ratio and higher delta and theta spectral power. Slowing of REM sleep EEG activity was more prominent in posterior cortical areas, and was highly associated with poor visuospatial performance. ROC curve analysis showed that temporal and occipital REM sleep slowing ratios can be classified as ‘good’ predictors of dementia in Parkinson’s disease. These results suggest that REM sleep EEG slowing provide a new potential early marker of dementia in Parkinson’s disease. We also found specific N-REM sleep and waking EEG abnormalities in patients with Parkinson’s disease who had developed dementia at follow-up.
The cholinergic system is a key regulator of REM sleep. Whereas both REM sleep and wakefulness are associated with high acetylcholine release, REM sleep activity is primarily cholinergic, with very low inputs from other neurotransmitter systems ( Hobson and Pace-Schott, 2002 ; McCarley, 2007 ; Platt and Riedel, 2011 ). Cholinergic deficits appear to be a key component of early cognitive impairment in Parkinson’s disease ( Kehagia et al. , 2010 ; Bohnen and Albin, 2011 ; Svenningsson et al. , 2012 ; Gratwicke et al. , 2015 ); the basal forebrain, the pedunculopontine nucleus, and the laterodorsal tegmental nucleus show significant cholinergic degeneration in Parkinson’s disease, especially in patients who have cognitive deficits ( Francis and Perry, 2007 ; Bohnen and Albin, 2011 ; Hall et al. , 2014 ; Liu et al. , 2015 ). Our finding that REM sleep EEG slowing predicts Parkinson’s disease dementia strongly highlights the critical role of cholinergic degeneration in the early development of cognitive impairment in Parkinson’s disease. Future studies should therefore investigate the influence of cholinergic activity on REM sleep EEG slowing and cognitive performance in Parkinson’s disease through a pharmacological intervention (i.e. cholinesterase inhibitors).
We found a strong relationship between REM sleep EEG slowing in posterior areas and poor visuospatial performance in Parkinson’s disease. It has been proposed that deficits in visuospatial abilities, which are supported mainly by posterior cortical regions, predict dementia outcome in Parkinson’s disease ( Williams-Gray et al. , 2009 ; Kehagia et al. , 2010 ). In our cohort of patients with Parkinson’s disease, we also found that baseline visuospatial ability predicted dementia ( Latreille et al. , 2015 ). These factors were difficult to disentangle; the addition of the REM sleep slowing ratio to the visuospatial measures in the stepwise logistic regression model did not further improve dementia prediction, perhaps because they were correlated (i.e. collinear). Taken as a whole, our results suggest that a more posterior EEG slowing pattern during REM sleep could be a prodromal marker of dementia in Parkinson’s disease, reflecting early cortical alterations. This hypothesis is also supported by the results in patients with Parkinson’s disease who remained dementia-free at follow-up: compared to controls, they still demonstrated higher REM sleep delta and theta power, particularly in temporo-parietal derivations. Moreover, when subdividing our PDnD patients according to the presence of RBD or MCI, which are well-known clinical risk factors for Parkinson’s disease dementia ( Anang et al. , 2014 ; Fereshtehnejad et al. , 2015 ), we found that patients with RBD and MCI had a higher REM sleep slowing ratio than those without. Because most patients with Parkinson’s disease develop dementia over time ( Hely et al. , 2008 ), slowing of REM sleep EEG activity may therefore be a very early marker of cognitive decline in Parkinson’s disease. Prospective studies with longer follow-up duration would confirm the sensitivity of these potential early prodromal markers of cognitive decline in Parkinson’s disease.
We also found that parietal sigma EEG abnormalities during N-REM sleep predicted dementia development in Parkinson’s disease. These results concur with our previous findings of reduced sleep spindle density and lower amplitude in posterior areas in these patients ( Latreille et al. , 2015 ). Except for one study ( Margis et al. , 2015 ), our results are also in line with other cross-sectional studies that investigated sleep spindles in non-demented patients with Parkinson’s disease ( Christensen et al. , 2014 , 2015 ). Our findings provide further support for the hypothesis of a disrupted thalamo-cortical loop function in Parkinson’s disease, which prevents normal learning and memory consolidation processes ( Fogel and Smith, 2011 ). These sleep-related learning mechanisms could also be altered by structural and functional cortical alterations (i.e. thalamus, brainstem, posterior areas), as discussed in Latreille et al. (2015 ).
Our wake EEG results are also in line with two longitudinal studies showing that higher wake delta activity and alpha slowing in posterior cortical regions were associated with dementia development in Parkinson’s disease ( Klassen et al. , 2011 ; Caviness et al. , 2015 ). Moreover, we found that the use of an EEG slowing ratio (slow-to-fast frequencies) during wakefulness could accurately identify Parkinson’s disease dementia. Logistic regression analysis showed that, when controlling for visuospatial abilities, the occipital wake slowing ratio and the dominant occipital frequency were significant predictors of dementia outcome in Parkinson’s disease. In contrast to Klassen and colleagues (2011) , who reported that below-median relative theta power predicted dementia in Parkinson’s disease, our analyses showed no significant differences in theta power during wakefulness when controlling for confounding factors in the statistical model (anxiety symptoms and levodopa dose correlated with higher theta power). Further studies with larger groups of patients would be needed to clarify that issue. An important inclusion in the present study was a group of healthy controls, which enabled the identification of wake delta power as a potential new very early marker of dementia in Parkinson’s disease. Indeed, compared to controls, PDnD patients had higher wake delta power in all cortical derivations. From a physiological standpoint, many monoaminergic chemical systems, including dopaminergic, serotoninergic, and noradrenergic pathways, might contribute to wakefulness EEG alterations in Parkinson’s disease. Because the cholinergic system is also involved in wakefulness rhythms, impaired cholinergic transmission might as well cause resting state EEG slowing in Parkinson’s disease.
The main strengths of this study are its longitudinal design as well as the investigation of EEG activity across all states of consciousness in a well-characterized Parkinson’s disease cohort ( Anang et al. , 2014 ; Fereshtehnejad et al. , 2015 ; Latreille et al. , 2015 ). Moreover, our EEG findings do not appear to be explained primarily by clinical confounds, because we controlled for multiple clinical variables, including mood symptoms, disease-related measures, and medication intake. However, some limitations of this study should be noted. Not all patients with Parkinson’s disease underwent a formal cognitive assessment at the follow-up visit, and some patients were reviewed with the family and treating physician. This was largely due to the severe and progressive nature of Parkinson’s disease: most of these patients were unable to participate in the follow-up due to severe disability or institutionalization. Nevertheless, we performed supplementary analyses in a subgroup of patients who underwent a cognitive assessment at follow-up, and similar results were found. The small sample size in our study precluded certain statistical analyses and subgroup analyses. Future studies with larger sample sizes should investigate whether these EEG markers in Parkinson’s disease can predict specific cognitive deficits in the long term. Also, because EEG methods provide relatively poor spatial resolution, topographical EEG changes should be interpreted with caution. Future studies using high-density EEG and magnetoencephalography could help detect the sources of EEG alterations. Finally, it is possible that changes in body temperature and skin conductance related to autonomic dysfunction in Parkinson’s disease may have altered the electrode impedance. If so, this could have resulted in more baseline sways and drifts, thereby increasing the delta frequency band power. However, in our study, we carefully excluded EEG sections that contained electrode artefacts. In addition, before Fast Fourier Transformation processing, the mean signal was removed to eliminate baseline drift. Moreover, because sweating oscillations have a lower frequency range than our analysed delta band (0.5–4 Hz), we are confident that these could not account for the higher delta power in patients with Parkinson’s disease.
In conclusion, our results show that REM sleep EEG abnormalities occur early in Parkinson’s disease, and are associated with future dementia development. Therefore, REM sleep EEG slowing is a promising prodromal marker of cognitive decline in Parkinson’s disease. These findings shed light on the possible mechanisms underlying the relationships between REM sleep activity and cognitive impairment in Parkinson’s disease, notably the involvement of the cholinergic system. These mechanisms should be further explored in future neuroimaging studies.
Funding
This study was supported by grants from the Canadian Institutes of Health Research (J.-F. Gagnon, R.B. Postuma, J. Carrier) and the Fonds de Recherche du Québec – Santé (J.-F. Gagnon, R.B. Postuma, J. Carrier). V. Latreille and J. Rodrigues-Brazète were supported by a scholarship from the Canadian Institutes of Health Research. J.-F. Gagnon also holds a Canada Research Chair in Cognitive Decline in Pathological Aging.
Supplementary material
Supplementary material is available at Brain online.
Supplementary Material
Glossary
Abbreviations
- BAI =
Beck Anxiety Inventory
- BDI-II =
Beck Depression Inventory, Second Edition
- MCI =
mild cognitive impairment
- N-REM =
non-rapid eye movement
- PDD =
patients with Parkinson’s disease who developed dementia
- PDnD =
patients with Parkinson’s disease who remained dementia-free
- RBD =
rapid eye movement sleep behaviour disorder
- REM =
rapid eye movement
References
- American Academy of Sleep Medicine, Task Force Chair ; Hauri PJ . The International classification of sleep disorders: diagnostic and coding manual . 2nd ed. Westchester IL: : American Academy of Sleep Medicine; ; 2005. . [Google Scholar]
- Anang JB, Gagnon JF, Bertrand JA, Romenets SR, Latreille V, Panisset M , et al. . Predictors of dementia in Parkinson’s disease: a prospective cohort study . Neurology 2014. ; 83 : 1253 – 60 . [DOI] [PMC free article] [PubMed] [Google Scholar]
- Babiloni C, De Pandis MF, Vecchio F, Buffo P, Sorpresi F, Frisoni GB , et al. . Cortical sources of resting state electroencephalographic rhythms in Parkinson’s disease related dementia and Alzheimer’s disease . Clin Neurophysiol 2011. ; 122 : 2355 – 64 . [DOI] [PubMed] [Google Scholar]
- Beck AT, Epstein N, Brown G, Steer RA. An inventory for measuring clinical anxiety: psychometric properties . J. Consult Clin Psychol 1988. ; 56 : 893 – 7 . [DOI] [PubMed] [Google Scholar]
- Beck AT, Ward CH, Mendelson M, Mock J, Erbaugh J . An inventory for measuring depression . Arch Gen Psychiatry 1961. ; 4 : 561 – 71 . [DOI] [PubMed] [Google Scholar]
- Benjamini Y, Hochberg Y . Controlling the false discovery rate: a practical and powerful approach to multiple testing . J R Stat Soc Ser B (Methodol) 1995. ; 57 : 289 – 300 . [Google Scholar]
- Bohnen NI, Albin RL . The cholinergic system and Parkinson disease . Behav Brain Res 2011. ; 221 : 564 – 73 . [DOI] [PMC free article] [PubMed] [Google Scholar]
- Bonanni L, Perfetti B, Bifolchetti S, Taylor JP, Franciotti R, Parnetti L , et al. . Quantitative electroencephalogram utility in predicting conversion of mild cognitive impairment to dementia with Lewy bodies . Neurobiol Aging 2015. ; 36 : 434 – 45 . [DOI] [PMC free article] [PubMed] [Google Scholar]
- Bonanni L, Thomas A, Tiraboschi P, Perfetti B, Varanese S, Onofrj M . EEG comparisons in early Alzheimer's disease, dementia with Lewy bodiesand Parkinson's disease with dementia patients with a 2-year follow-up . Brain 2008. ; 131 : 690 – 705 . [DOI] [PubMed] [Google Scholar]
- Bousleiman H, Zimmermann R, Ahmed S, Hardmeier M, Hatz F, Schindler C , et al. . Power spectra for screening parkinsonian patients for mild cognitive impairment . Ann Clin Transl Neurol 2014. ; 1 : 884 – 90 . [DOI] [PMC free article] [PubMed] [Google Scholar]
- Brayet P, Petit D, Frauscher B, Gagnon JF, Gosselin N, Gagnon K , et al. . Quantitative EEG of rapid-eye-movement sleep: a marker of amnestic mild cognitive impairment . Clin EEG Neurosci 2015. , doi:10.1177/1550059415603050 . [DOI] [PubMed] [Google Scholar]
- Caviness JN, Hentz JG, Belden CM, Shill HA, Driver-Dunckley ED, Sabbagh MN , et al. . Longitudinal EEG changes correlate with cognitive measure deterioration in Parkinson’s disease . J Parkinson’s Dis 2015. ; 5 : 117 – 24 . [DOI] [PubMed] [Google Scholar]
- Caviness JN, Hentz JG, Evidente VG, Driver-Dunckley ED, Samanta J, Mahant P , et al. . Both early and late cognitive dysfunction affects the electroencephalogram in Parkinson’s disease . Parkinsonism Relat Disord 2007. ; 13 : 348 – 54 . [DOI] [PubMed] [Google Scholar]
- Christensen JA, Kempfner J, Zoetmulder M, Leonthin HL, Arvastson L, Christensen SR , et al. . Decreased sleep spindle density in patients with idiopathic REM sleep behavior disorder and patients with Parkinson’s disease . Clin Neurophysiol 2014. ; 125 : 512 – 19 . [DOI] [PubMed] [Google Scholar]
- Christensen JA, Nokolic M, Warby SC, Koch H, Zoetmulder M, Frandsen R , et al. . Sleep spindle alterations in patients with Parkinson’s disease . Front Hum Neurosci 2015. ; 9 : 233 , doi:10.3389/fnhum.2015.00233 . [DOI] [PMC free article] [PubMed] [Google Scholar]
- Dubois B, Burn D, Goetz C, Aarsland D, Brown RG, Broe GA , et al. . Diagnostic procedures for Parkinson’s disease dementia: recommendations from the Movement Disorder Society Task Force . Mov Disord 2007. ; 22 : 2314 – 24 . [DOI] [PubMed] [Google Scholar]
- Fahn S, Elton RL . Unified Parkinson’s disease rating scale . In: Fahn S, Marsden CD, Calne DB, Goldstein M , editors. Recent development in Parkinson’s disease , Vol. 2 . Florham Park, NJ: : Macmillan Health Care Information; ; 1987. . p. 153 – 63 . [Google Scholar]
- Fereshtehnejad SM, Romenets SR, Anang JN, Latreille V, Gagnon JF, Postuma RB . New clinical subtypes of Parkinson disease and their longitudinal progression: a prospective cohort comparison with other phenotypes . JAMA Neurol 2015. ; 72 : 863 – 73 . [DOI] [PubMed] [Google Scholar]
- Fogel SM, Smith CT . The function of the sleep spindle: a physiological index of intelligence and a mechanism for sleep-dependent memory consolidation . Neurosci Biobehav Rev 2011. ; 35 : 1154 – 65 . [DOI] [PubMed] [Google Scholar]
- Folstein MF, Folstein SE, McHugh PR . “Mini-mental state”. A practical method for grading the cognitive state of patients for the clinician . J Psychiatric Res 1975. ; 12 : 189 – 98 . [DOI] [PubMed] [Google Scholar]
- Francis PT, Perry EK . Cholinergic and other neurotransmitter mechanisms in Parkinson’s disease, Parkinson’s disease dementia, and Dementia with Lewy bodies . Mov Disord 2007. ; 22 : 351 – 7 . [DOI] [PubMed] [Google Scholar]
- Gratwicke J, Jahanshahi M, Foltynie T . Parkinson’s disease dementia: a neural networks perspective . Brain 2015. ; 138 : 1454 – 76 . [DOI] [PMC free article] [PubMed] [Google Scholar]
- Hall H, Reyes S, Landeck N, Bye C, Leanza G, Double K , et al. . Hippocampal Lewy pathology and cholinergic dysfunction are associated with dementia in Parkinson’s disease . Brain 2014. ; 137 : 2491 – 508 . [DOI] [PubMed] [Google Scholar]
- Han CX, Wang J, Yi GS, Che YQ . Investigation of EEG abnormalities in the early stage of Parkinson’s disease . Cogn Neurodyn 2013. ; 7 : 351 – 9 . [DOI] [PMC free article] [PubMed] [Google Scholar]
- Hely MA, Reid WG, Adena MA, Halliday GM, Morris JG . The Sydney multicenter study of Parkinson’s disease: the inevitability of dementia at 20 years . Mov Disord 2008. ; 23 : 837 – 44 . [DOI] [PubMed] [Google Scholar]
- Hobson JA, Pace-Schott EF . The cognitive neuroscience of sleep: neuronal systems, consciousness and learning . Nat Rev Neurosci 2002. ; 3 : 679 – 93 . [DOI] [PubMed] [Google Scholar]
- Hoehn MM, Yahr MD . Parkinsonism: onset, progression, and mortality . Neurology 1967. ; 17 : 427 – 42 . [DOI] [PubMed] [Google Scholar]
- Jellinger KA . Neuropathology of sporadic Parkinson’s disease: evaluation and changes of concepts . Mov Disord 2012. ; 27 : 8 – 30 . [DOI] [PubMed] [Google Scholar]
- Kehagia AA, Barker RA, Robbins TW . Neuropsychological and clinical heterogeneity of cognitive impairment and dementia in patients with Parkinson’s disease . Lancet Neurol 2010. ; 9 : 1200 – 13 . [DOI] [PubMed] [Google Scholar]
- Klassen BT, Hentz JG, Shill HA, Driver-Dunckley E, Evidente VGH, Sabbagh MN , et al. . Quantitative EEG as a predictive biomarker for Parkinson disease dementia . Neurology 2011. ; 77 : 1 – 7 . [DOI] [PMC free article] [PubMed] [Google Scholar]
- Lapierre O, Montplaisir J . Polysomnographic features of REM sleep behavior disorder: development of a scoring method . Neurology 1992. ; 42 : 1371 – 4 . [DOI] [PubMed] [Google Scholar]
- Latreille V, Carrier J, Lafortune M, Postuma RB, Bertrand JA, Panisset M , et al. . Sleep spindles in Parkinson’s disease may predict the development of dementia . Neurobiol Aging 2015. ; 36 : 1083 – 90 . [DOI] [PubMed] [Google Scholar]
- Litvan I, Goldman JG, Tröster AI, Schmand BA, Weintraub D, Peterson RC , et al. . Diagnostic criteria for mild cognitive impairment in Parkinson’s disease: Movement Disorder Society Task Force guidelines . Mov Disord 2012. ; 27 : 349 – 56 . [DOI] [PMC free article] [PubMed] [Google Scholar]
- Liu AK, Chang RC, Pearce RK, Gentleman SM . Nucleus basalis of Meynert revisited: anatomy, history and differential involvement in Alzheimer's and Parkinson's disease . Acta Neuropathol 2015. ; 129 : 527 – 40 . [DOI] [PMC free article] [PubMed] [Google Scholar]
- Luckhaus C, Grass-Kapanke, Blaeser I, Ihl R, Supprian T, Winterer G , et al. . Quantitative EEG in progressing vs stable mild cognitive impairment (MCI): results of a 1-year follow-up study . Int J Geriatr Psychiatry 2008. ; 23 : 1148 – 55 . [DOI] [PubMed] [Google Scholar]
- Margis R, Schönwald SV, Carvalho DZ, Gerhardt GJ, Rieder CR . NREM sleep alpha and sigma activity in Parkinson’s disease: evidence for conflicting electrophysiological activity? Clin Neurophysiol 2015. ; 126 : 951 – 8 . [DOI] [PubMed] [Google Scholar]
- McCarley RW . Neurobiology of REM and NREM sleep . Sleep Med 2007. ; 8 : 302 – 30 . [DOI] [PubMed] [Google Scholar]
- Menke RA, Szewczyk-Krolikowski K, Jbabdi S, Jenkinson M, Talbot K, Mackay CE , et al. . Comprehensive morphometry of subcortical grey matter structures in early-stage Parkinson’s disease . Hum Brain Mapp 2014. ; 35 : 1681 – 90 . [DOI] [PMC free article] [PubMed] [Google Scholar]
- Montplaisir J, Gagnon JF, Fantini ML, Postuma RB, Dauvilliers Y, Desautels A , et al. . Polysomnographic diagnosis of idiopathic REM sleep behavior disorder . Mov Disord 2010. ; 25 : 2044 – 51 . [DOI] [PubMed] [Google Scholar]
- Nasreddine ZS, Phillips NA, Bedirian V, Charbonneau S, Whitehead V, Collin I , et al. . The Montreal Cognitive Assessment, MoCA: a brief screening tool for mild cognitive impairment . J. Am Geriatr Soc 2005. ; 53 : 695 – 9 . [DOI] [PubMed] [Google Scholar]
- Petit D, Lorrain D, Gauthier S, Montplaisir J . Regional spectral analysis of the REM sleep EEG in mild to moderate Alzheimer’s disease . Neurobiol Aging 1993. ; 14 : 141 – 5 . [DOI] [PubMed] [Google Scholar]
- Platt B, Riedel G . The cholinergic system, EEG and sleep . Behav Brain Res 2011. ; 221 : 499 – 504 . [DOI] [PubMed] [Google Scholar]
- Poil SS, de Haan W, Van der Flier W, Mansvelder HD, Scheltens P, Linkenkaer-Hansen K . Integrative EEG biomarkers predict progression to Alzheimer’s disease at the MCI stage . Front Aging Neurosci 2013. ; 5 : 1 – 12 . [DOI] [PMC free article] [PubMed] [Google Scholar]
- Rauchs G, Schabus M, Parapatics S, Bertran F, Clochon P, Hot P , et al. . Is there a link between sleep changes and memory in Alzheimer’s disease? Neuroreport 2008. ; 19 : 1159 – 62 . [DOI] [PMC free article] [PubMed] [Google Scholar]
- Schlede N, Zimmermann R, Ehrensperger MM, Gschwandtner U, Hardmeier M, Hatz F , et al. . Clinical EEG in cognitively impaired patients with Parkinson’s disease . J. Neurol Sci 2011. ; 310 : 75 – 8 . [DOI] [PubMed] [Google Scholar]
- Serizawa K, Kamei S, Morita A, Hara M, Mizutani T, Yoshihashi H , et al. . Comparison of quantitative EEGs between Parkinson disease and age-adjusted normal controls . J Clin Neurophysiol 2008. ; 25 : 361 – 6 . [DOI] [PubMed] [Google Scholar]
- Svenningsson P, Westman E, Ballard C, Aarsland D . Cognitive impairment in patients with Parkinson’s disease: diagnosis, biomarkers, and treatment . Lancet Neurol 2012. ; 11 : 697 – 707 . [DOI] [PubMed] [Google Scholar]
- Westerberg CE, Mander BA, Florczak SM, Weintraub S, Mesulam MM, Zee PC , et al. . Concurrent impairments in sleep and memory in amnestic mild cognitive impairment . J Int Neuropsychol Soc 2012. ; 18 : 490 – 500 . [DOI] [PMC free article] [PubMed] [Google Scholar]
- Wetter TC, Brunner H, Högl B, Yassouridis A, Trenkwalder C, Friess E . Increased alpha activity in REM sleep in de novo patients with Parkinson’s disease . Mov Disord 2001. ; 15 : 928 – 33 . [DOI] [PubMed] [Google Scholar]
- Williams-Gray CH, Evans JR, Goris A, Foltynie T, Ban M, Robbins TW , et al. . The distinct cognitive syndromes of Parkinson’s disease: 5 year follow-up of the CamPaIGN cohort . Brain 2009. ; 132 : 2958 – 69 . [DOI] [PubMed] [Google Scholar]
Associated Data
This section collects any data citations, data availability statements, or supplementary materials included in this article.