Abstract
Background
Despite the breadth of understanding the noncoding RNAs’ function in molecular biology, their functional roles in hepatocellular carcinoma (HCC) is poorly understood. In this study, we investigated the effect of hepatitis C virus (HCV) core upon the expression of noncoding RNAs.
Methods
The lncRNAs, mRNAs, and circRNAs were employed for identification of HCV core protein gene expression in human Huh7 hepatoma (Huh7) cell line. In data analysis, we applied a threshold that eliminated all genes that were not increased or decreased by at least a 2-fold change in a comparison between transfected and control cells. Hierarchical Clustering and the Kyoto encyclopedia of genes and genome pathway analyses were performed to show the distinguishable lncRNA, mRNAs, and circRNAs expression pattern among samples.
Results
The array data showed that 4,851 lncRNAs, 4,785 mRNAs, and 823 circRNAs were 2-fold up-regulated but 3,569 lncRNAs, 3,192 mRNAs, and 419 circRNAs were 2-fold down-regulated in Huh 7-core cells. The genes in the enriched set were associated with macromolecule and nucleic acid metabolic processes, DNA damage response and regulation of voltage-gated calcium channel. We identified 10 genes from the selected 14 genes that were higher or lower expression in Huh7-core cells than that of Huh7-vector cells by quantitative real-time polymerase chain reaction. Interestingly, overexpression of miR122 and miR204 partly abrogated the expression of TGFBRAP1 and HOTTIP, and increased the HPCAL1 expression in the predicted carcinogenic pathways.
Conclusion
Our data suggests that the pathways of miR204-HPCAL1-lncRNAHOTTIP and miR122-TGFBRAP1 were likely involved in the carcinogenic progress due to the presence of HCV core, and that overexpression of miR122 and miR204 might inhibit the HCC progress by down-regulation of TGFBRAP1 and HOTTIP expression.
Keywords: hepatitis C virus, Core, lncRNA microarray, gene expression, hepatocellular carcinoma, miR122, HOTTIP
Introduction
Hepatitis C virus (HCV) chronic infection is one of the most common chronic liver diseases and affects 1% to more than 3% population in different regions worldwide. The development of liver cirrhosis and hepatocellular carcinoma (HCC) is the third leading cause of cancer-related deaths in the world.1,2 Although HCV chronic infection is a prognostic factor of HCC, the relationship between HCV core gene expression and HCC progression is not fully explained. Since HCV core protein constructs HCV capsid, participates in HCV immune escape, resists drug therapy, and relates to liver fibrosis, its functional role in HCC has been followed with interest.3–5
Noncoding RNAs (ncRNAs) are general terms of the RNAs that are not being translated to proteins, including microRNA (miRNA), circular RNAs (circRNAs), and long noncoding RNAs (lncRNAs), and their functions are involved in diverse biological process. Aberrant ncRNA expression is relevant to many human diseases such as liver fibrosis and HCC.6–9 It is known that HCV infection affects differential miRNA expression; for example, miR-24, miR-638, and miR-1181 were identified to be involved in HCV entry, replication, and propagation, respectively.10 In some reports,11–13 LncRNA-Dreh has been identified to be related to the HCC caused by hepatitis B virus (HBV). For instance, HBx protein can downregulate the lncRNA-Dreh expression, resulting in the proliferation and metastasis of HCC, but little is known regarding the roles of lncRNAs, miRNAs, and circRNAs in HCC caused by HCV.
In an attempt to explore the relationship between the HCV core gene expression in human hepatoma (Huh7) cells and HCC, and to find the possible involvement of ncRNAs in HCC progression due to HCV chronic infection, we investigated the global and dynamic gene expression profiling of lncRNAs, miRNAs, and circRNAs in the Huh7 cells transfected with HCV genotype 1b core gene recombinant by the lncRNA and circRNA arrays, and then analyzed the interested gene expression alteration by gene ontology (GO) analysis and based on the Kyoto encyclopedia of genes and genomes (KEGG). Here, we showed that 8,420 human lncRNAs, 7,977 mRNAs, and 1,242 circRNAs were identified and their expression levels changed for more than 2-fold in response to HCV core expression in Huh7 cells. The combined analyses of lncRNAs, mRNAs, and circRNA gene expression profiling may have superior potential as a mechanistic feature in HCV infection-related diseases.
Materials and methods
Cell culture
Huh7 cells were purchased from the Cell Bank of the Chinese Academy of Sciences (Shanghai, People’s Republic of China). The cell line is highly permissive for HCV replication.1,14 Cells were cultured in complete media consisting of RPMI 1640, 2 mM L-glutamine, 100 U/mL penicillin, 100 µg/mL streptomycin, and 10% fetal bovine serum. The medium was refreshed every 3 days to maintain adherent cells, and the culture plates were all placed in a humidified 5% CO2 incubator at 37°C.
Construction of recombinant
The cDNA encoding for HCV core protein was done based on the consensus genotype 1b, isolated from patient’s serum by reverse transcription-polymerase chain reaction (RT-PCR). Our investigation has been approved by an ethics committee at Southeast University School of Medicine together with confirmation that informed consent was obtained from the donors for the use of the blood samples from the HCV-infected patients. The sense primer was 5′-CCCAAGCTTGGATGAGCACGAATCCTAAACCTC-3′. The antisense primer was 5′-GGGATCCTTAAGCGGAAGCTGGGATGG-3′. The cDNA fragment was cloned into the HindIII and BamH I sites of p-EGFP mammalian expression vector (Promega Corporation, Fitchburg, WI, USA). The target gene in recombinant was confirmed by DNA sequence.15
Development of a stable HCV1b core expression Huh7 cells
Cells grown to 70% confluent in complete medium were transferred to a six-well plate for 24-h splitting. The Lipofectamin 2000 reagent (Invitrogen, Waltham, MA, USA), serum-free medium mixed with HCV1b genotype core recombinant, or blank plasmid (as control) were incorporated, incubated for 20 min at room temperature, and then transferred directly into Huh7 cells. The plate was incubated at 37°C in 5% CO2 atmosphere. The cell medium was removed from the plate after 5 h of incubation, followed by selection with 1,000 µg/mL of G418 (Clontech, Mountain View, CA, USA) for 24 h. After 12- to 14-day selection, G418-resistant Huh7 clones were selected, clonally harvested, and named for Huh7-core cells and Huh7-vector cells. RT-PCR was performed to detect the transcribed expression of core protein.14,16
Arraystar lncRNA array
The lncRNA array consists of lncRNA part of 30,586 genetic locus and mRNA part of 26,109 genetic locus. According to the protocol of lncRNA array assay (KangChen Biological Services, Shanghai, People’s Republic of China), the RNA sample was prepared by TRIzol Reagent (Invitrogen). Total RNA cleanup, quantification, and quality control were done with Nasey Mini Kit (Qiagen p/n 74104). Labeling reaction was then done with Quick Amp Labeling Kit, One-Color (Agilent p/n 5190-0442). Purification of the labeled/amplified RNA and labeled cRNA quantification, and quality control were done with RNeasy Mini Kit (Qiagen p/n 74104, NanoDrop ND-1000). Subsequently, hybridization was done by Agilent gene expression hybridization kit (Agilent p/n 5188-5242). Microarray wash was performed using gene expression wash buffer 1 and buffer 2.17,18 The Agilent Feature Extraction software (version 11.0.1.1) was used to analyze acquired array images. Quantile normalization and subsequent data processing were performed using the R software package. Differentially expressed lncRNAs between two samples isolated, respectively, from Huh7-core cells and Huh7-vector cells were identified through fold change filtering. Hierarchical clustering was performed to show the distinguishable lncRNA and mRNA expression patterns among samples.17,19,20
Arraystar circRNA array
The circRNA array includes 5,396 genetic locus. According to the protocol of circRNA array assay (KangChen Biological Services), total RNA from each sample was quantified using the NanoDrop ND-1000. The sample preparation and microarray hybridization were performed based on the Arraystar standard protocols. Briefly, total RNAs were digested with Rnase R (Epicentre, Inc., Madison, WI, USA) to remove linear RNAs and enrich circRNAs. Then, the enriched circR-NAs were amplified and transcribed into fluorescent cRNA utilizing a random priming method (Arraystar Super RNA Labeling Kit; Arraystar, San Mateo, CA, USA). The labeled cRNAs were hybridized onto the Arraystar Human circRNA Array V2 (8×15K, Arraystar). After washing the slides, the arrays were scanned by the Agilent Scanner G2505C and the same steps as that of the protocol of lncRNA array assay were followed.17,20,21
Functional group analysis
GO analyses were performed to explore the functions of differentially expressed coding genes identified in this study by using the Database for Annotation, Visualization and Integrated Discovery.22,23 Pathway analyses were used to place differentially expressed coding genes according to KEGG, Biocarta, and Reactome. Generally, Fisher’s exact test and v2 test were used to classify the GO category and select the significant pathway. Besides, the threshold of significance was defined by the p-value and false discovery rate.24
Quantitative real-time PCR
Reverse transcription of RNA was performed according to the manufacturer’s instructions of the Reverse Transcription System (Promega Corporation). The primers were listed in Table 1. Quantitative real-time PCR (RT-qPCR) amplification was done using an IQ5 machine (Bio-Rad Laboratories Inc., Hercules, CA, USA), and the conditions were set as follows: an initial denaturation at 95°C for 45 sec, followed by 30 cycles of 25 sec at 95°C, 30 sec at 65°C, and 30 sec at 72°C. Subsequently, a melt curve analysis was performed to determine the specificity of the PCR reaction. Relative gene expression was calculated using the ΔΔCt method.25,26
Table 1.
Primer sequences used for RT-qPCR
| Molecular names | Primer sequences | Enzymes |
|---|---|---|
| miR122-RT | GTCGTATCCAGTGCGTGTCGTGGAGTCGGCAATTGCACTGGATACGACCAAACAC | |
| miR122-F | GGGGTGGAGTGTGACAATG | |
| miR122-R | CAGTGCGTGTCGTGGAGT | |
| U6-RT | AACGCTTCACGAATTTGCGT | |
| U6-F | CTCGCTTCGGCAGCACA | |
| U6-R | AACGCTTCACGAATTTGCGT | |
| miR192-RT | GCGTATCACCGTGTTTACTGTGGCTGTCA | |
| miR192-F | GCCCGTATCTGACCTATGAATTGA | |
| miR192-R | AGCGTATCACCGTGTTTACTGT | |
| miR204-RT | CACATTAGCGCGTATTCAGACAGGCATAGG | |
| miR204-F | CCACTTTGATTCCCTTTGTCATCC | |
| miR204-R | CCACATTAGCGCGTATTCAGAC | |
| circ_0001498-F | CATTTCCTTCCTTGGAATCTTG | |
| circ_0001498-R | CTGGGCATTCCACACAACTA | |
| circ_0008026-F | TGGCACACCTGGATATCTTTC | |
| circ_0008026-R | GCAAATTCTCAGGCTTCAGG | |
| circ_406626-F | CCTCAATATTTTTACTGGCCACA | |
| circ_406626-R | ATCTTCATTCCTCAATATTTTTACTGG | |
| MAP3K2-F | GCAAAGTTCTGTGCCAGTGA | |
| MAP3K2-R | ACTGTTTGCCCATGTTCCTC | |
| GLS-F | GCTGTGCTCCATTGAAGTGA | |
| GLS-R | AAAGCAAACTGCCCTGAGAA | |
| TGFBRAP1-F | CGTTCACTGCCACCAAACAG | |
| TGFBRAP1-R | CTCGTTCAGTGCAAACGTGG | |
| CPEB1-F | ATCCTTGCTTCAGGCTTGCT | |
| CPEB1-R | CATGCAGAGCACCGACAAAC | |
| FRS2-F | CATTGGAGGCGAGGGTTTCT | |
| FRS2-R | AGCCAGTGTCCCATTCTGTG | |
| FN1-F | AGCCTGGGAGCTCTATTCCA | |
| FN1-R | TTGGCGCATCTCTTTCCTGT | |
| HPCAL1-F | ACGGCAAACTGTCCTTGGAA | |
| HPCAL1-R | GCAAAGCTTAAACGGCACGA | |
| miR122-psu-F | GGAAGATCTTGTTCAGCTCTTCCCATTGCT | BglII |
| miR122-psu-R | CCCAAGCTTTGAGTGCAAAAGAGCCAGACT | HindIII |
| miR192-psu-F | GGAAGATCTTCACGGGGAATGAGACAGAG | BglII |
| miR192-psu-R | CCCAAGCTTCCAGTGGGGCTGCTGTTAT | HindIII |
| miR204-psu-F | GGAAGATCTTGAGAGTATATTTCACTCCTTCCT | BglII |
| miR204-psu-R | CCCAAGCTTACTTCCTGATCGCGTACC | HindIII |
Note: Underline represents the restriction enzyme cutting site.
Abbreviations: CPEB1, cytoplasmic polyadenylation element binding protein 1; F, forward; FN1, fibronectin 1; FRS2, fibroblast growth factor receptor substrate 2; GLS, glutaminase; HPCAL1, hippocalcin like 1; MAP3K2, mitogen-activated protein kinase 2; psu, precursor primer for amplification of miRNA; R, reverse; RT-qPCR, quantitative real-time PCR; TGFBRAP1, transforming growth factor β receptor-associated protein 1.
Construction of expressive miRNA vectors and transient transfection
To construct the expressive miRNA vectors, we amplified an insert (full-length human miR-122, miR-192, and miR-204) by PCR from the cDNA of Huh7 cells.27 The method of constructing expressive miRNA vectors of PSUPER-miR122, PSUPER-miR192, PSUPER-miR204, and empty vector PSUPER-EGFP1 was the same as the method of constructing HCV genotype 1b core recombinant. These recombinant eukaryotic expressive vectors were confirmed by sequencing, and then were transfected into the Huh7-core cells. Then, 48 h after the transfection, the cells were harvested to isolate the total mRNA and the related molecular expression was detected by RT-qPCR.28
Statistical analysis
SPSS 17.0 and Graphpad Prism 5.0 were used for data analysis. Values of interest were presented as the mean ± standard deviation. Statistical comparison was performed using the Student’s t-test method. A p-value of <0.05 was considered statistically significant.
Results
Influence of HCV core on gene expression profiling in Huh7 cells
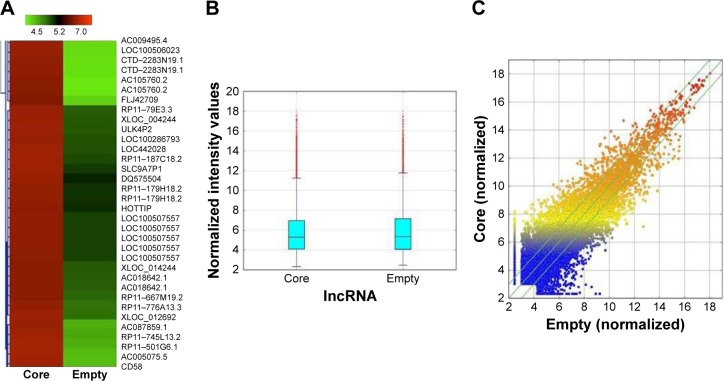
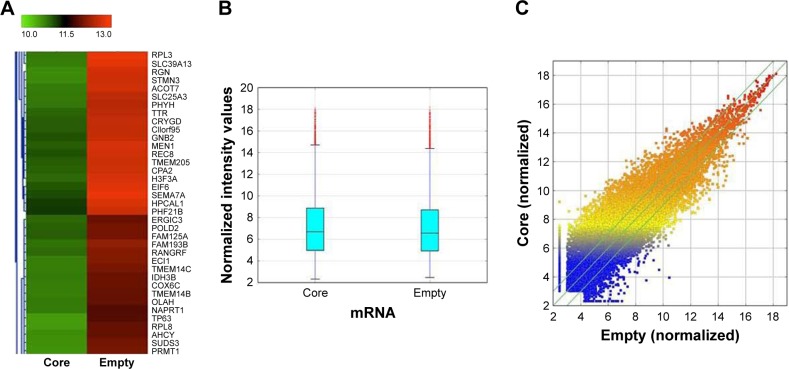
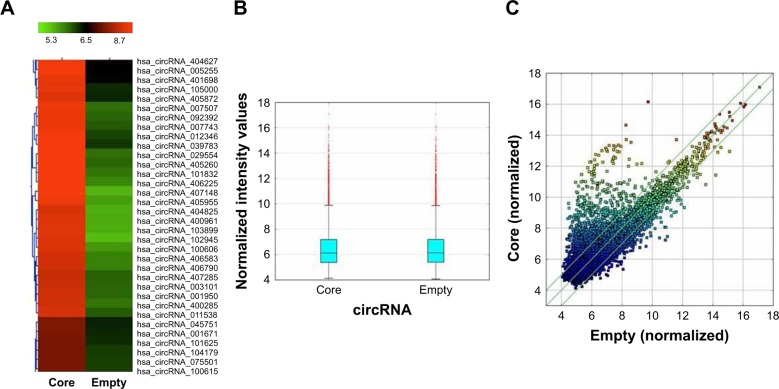
The results of the lncRNA and the circRNA arrays presented in Figures 1–3 show that the expression of 4,851 lncRNAs, 4,785 mRNAs, and 823 circRNAs were 2-fold upregulated, and that the expression of 3,569 lncRNAs, 3,192 mRNAs, and 419 circRNAs were 2-fold downregulated in the Huh7-core cells as compared to the Huh7-vector cells. The representative hot maps of lncRNA, mRNAs, and circRNAs in Figures 1A, 2A, and 3A show the gene expression profiling based on the analysis of lncRNA and the circRNA expression in two different samples. The box plots in Figures 1B, 2B, and 3B are a convenient way to quickly visualize the distribution of a dataset. It is commonly used in comparing the distributions of the intensities from the Huh7-core cells and the Huh7-vector cells. The scatter plots in Figures 1C, 2C, and 3C are a visualization method used for assessing the expression variation of lncRNA, mRNAs, and circRNAs between the two compared samples. The lncRNAs, mRNAs, and circRNAs above the top green lines and below the bottom green lines in Figures 1C, 2C, and 3C indicated more than 2-fold changes between the two compared samples.
Figure 1.
The hot map of lncRNA array analysis. (A) Hot map was generated for lncRNA expression in Huh7-core cells compared with Huh7-vector cells. (B) Box plot is a convenient way to quickly visualize the distribution of a dataset. It is commonly used for comparing the distributions of the intensities from all samples. (C) Scatter plot is a visualization method used for assessing the lncRNA expression variation between the two compared samples. The values of X and Y axes are the normalized signal values of the samples (log2 scaled). The green lines are fold change lines. The lncRNAs above the top green line and below the bottom green line indicated more than 2-fold change of lncRNAs between the two compared samples.
Abbreviation: lncRNA, long noncoding RNA.
Figure 2.
The hot map of mRNA array analysis. (A) Hot map was developed for mRNA expression in Huh7-core cells compared with Huh7-vector cells. (B) Box plot is a convenient way to quickly visualize the distribution of a dataset. It is commonly used for comparing the distributions of the intensities from all samples. (C) Scatter plot is a visualization method used for assessing the mRNA expression reproducibility between the two compared samples. The values of X and Y axes in the scatter plot are the normalized signal values of the samples (log2 scaled). The green lines are fold change lines. The mRNAs above the top green line and below the bottom green line indicated more than 2-fold change of mRNAs between the two compared samples.
Figure 3.
The hot map of circRNA array analysis. (A) Hot map was produced for circRNA expression in Huh7-core cells compared with Huh7-vector cells. (B) Box plot is a convenient way to quickly visualize the distribution of a dataset. It is commonly used for comparing the distributions of the intensities from all samples. (C) Scatter plot is a visualization method used for assessing the circRNA expression variation between the two compared samples. The values of X and Y axes in the scatter plot are the normalized signal values of the samples (log2 scaled). The green lines are fold change lines. The circRNAs above the top green line and below the bottom green line indicated more than 2-fold change of circRNAs between the two compared samples.
Abbreviation: circRNA, circular RNA.
Gene expression profiling in Huh7-core cells by GO and KEGG pathway analyses
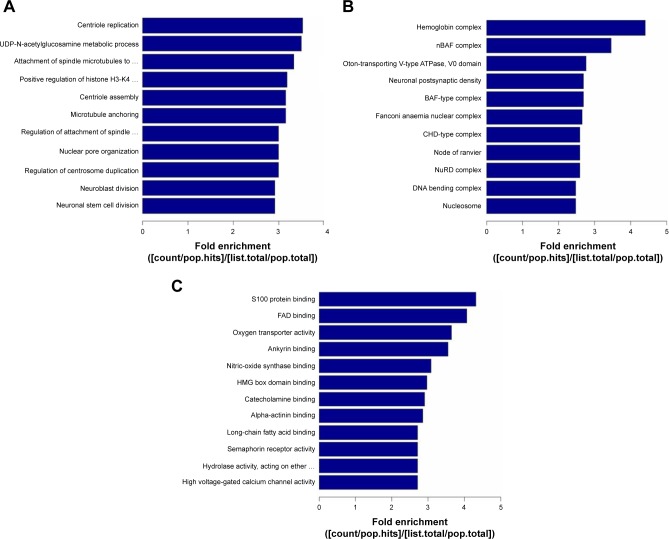
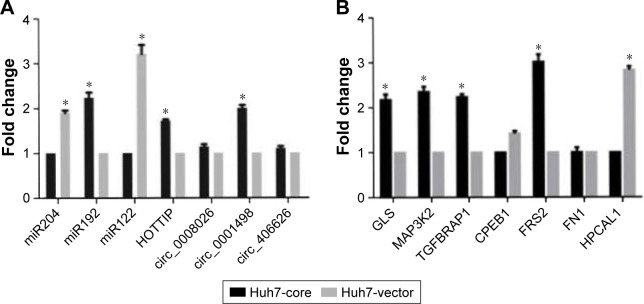
GO analysis includes the biological process, cellular component, and molecular function. The data presented in Figure 4 show that 2-fold upregulated/downregulated genes in the enriched set were associated with metabolism including macromolecule and nucleic acid metabolic process, biochemistry reaction like DNA damage response and regulation of voltage-gated calcium channel, etc., in Huh7-core cells; however, KEGG pathway analysis of gene expression profiling indicated that some of the differentially expressed genes were involved in the endoplasmic reticulum stress, apoptosis, calcium singling pathway, Wnt singling pathway, HBV and HCV infection pathway, etc. (data not shown here). The data presented in Figure 5 show that the reliability of lncRNA and the circRNA array data was partly confirmed by RT-qPCR analysis.
Figure 4.
Presence of HCV genotype 1b core causes the gene expression profiling in Huh7 cells by gene ontology analysis. (A) Analysis of biological process. (B) Analysis of cellular component. (C) Analysis of molecular function.
Abbreviation: HCV, hepatitis C virus.
Figure 5.
Identification of selected gene expression in HCV core and HCV vector cells analyzed by RT-qPCR. (A) Differential ncRNA expression. (B) Differential molecular gene expression.
Note: *p<0.05.
Abbreviations: HCV, hepatitis C virus; ncRNA, noncoding RNA; RT-qPCR, quantitative real-time PCR.
Function analysis of miRNA overexpression in Huh7-core cells
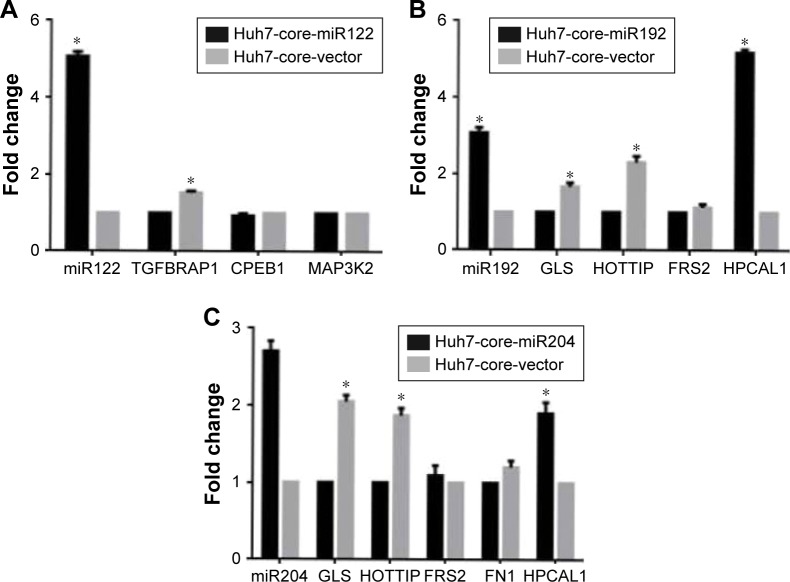
To confirm the regulation function of miRNAs identified in Huh7-core cells, we constructed PSUPER-miR122, PSUPER-miR192 and PSUPER-miR204, and PSUPER-EGFP1-blank vector recombinants, transfected them into Huh7-core cells, and analyzed the biological functions of these miRNAs in HCV core-expressed Huh7 cells by RT-qPCR. The results showed that the expression of gene TGFBRAP1 was significantly decreased in Huh7-core cells transfected with PSUPER-miR122 recombinant compared with the Huh7-vector cells (p<0.05). However, no significant difference was found in the expression of CPEB1 and MAP3K2 between the Huh7-core miR 122 cells and the Huh7-core cells in Figure 6A. The data presented in Figure 6B indicate that the expression of hippocalcin like 1 (HPCAL1) was significantly upregulated in PSUPER-miR192-transfected Huh7-core cells compared to the Huh7-core cells (p<0.001), and the expression of glu-taminase (GLS) and lncRNA-HOTTIP was significantly decreased (p<0.05). However, no significant difference was found in the FRS2 expression between the Huh7-core-miR 192 cells and the Huh7-core cells. We also found that the expression of HPCAL1 was significantly upregulated in Huh7-core-miR204 cells compared to the Huh7-core cells (p<0.01), and the expression of GLS and lncRNA-HOTTIP was simultaneously significantly decreased (p<0.01); but no significant difference was found in the expression of FN1 and FRS2 between the Huh7-core-miR 204 cells and the Huh7-core cells (p>0.05), as shown in Figure 6C.
Figure 6.
Effects of overexpression of miRNAs on potential downstream target gene expression analyzed by RT-qPCR. (A) Effects of overexpression of miR 122 on downstream target gene expression. (B) Effects of overexpression of miR 192 on downstream target gene expression. (C) Effects of overexpression of miR 204 on downstream target gene expression.
Note: *p<0.05.
Abbreviations: miRNAs, microRNAs; RT-qPCR, quantitative real-time PCR.
Prediction and postulation of the possible carcinogenic pathways in Huh7-core cells
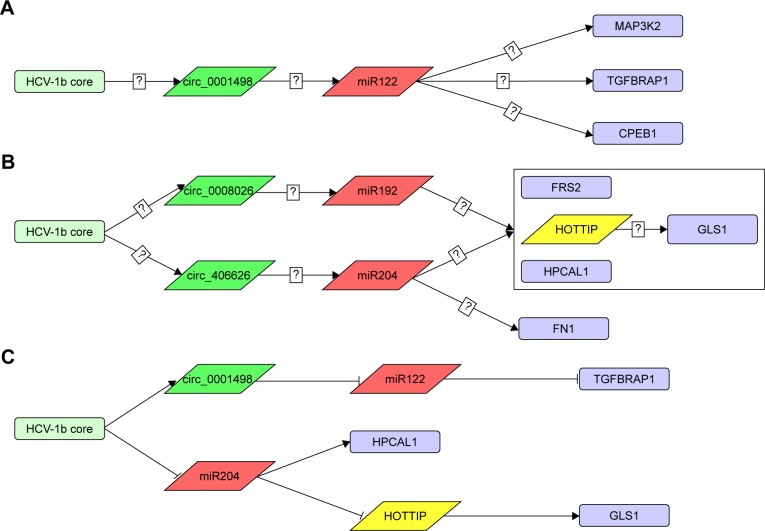
To analyze that the presence of HCV core gene was associated with HCC progression we predicted that the 14 genes (Figure 5) selected from the interested gene expression profiling might be involved the carcinogenic pathways in Huh7-core cells by the prediction of platforms, including the interaction of miRNA-mRNA/protein (miRDB), the interaction of lncRNA-miRNA (miRcode), and the interaction of circRNA-miRNA (starBase) as well as our paper studying.1,2,14,15 These possible carcinogenic pathways are shown in Figure 7A and B. Presumably, the possible carcinogenic pathways (Figure 7C) were further supported by overexpression of miR122 and miR204, respectively, in Huh7-core cells (Figure 6).
Figure 7.
Predicted and modified HCV core protein-related carcinogenic pathways. (A and B) Predicted HCV genotype 1b core protein-related carcinogenic pathways by the data of bioinformation and the molecular target site predict platform. (C) Modified HCV core protein-related carcinogenic pathways supported by overexpression of miR122 and miR204. Label?: that means questionable or uncertainty.
Abbreviation: HCV, hepatitis C virus.
Discussion
HCV is a single-stranded, positive sense RNA virus and encodes a polyprotein of 3,000 amino acids. This precursor is co-translationally and post-translationally processed into 10 structural and nonstructural proteins by cellular and virally encoded proteases. These proteins include the highly conserved core protein, the glycosylated envelope proteins (E1 and E2), and a short peptide p7,29–31 in which HCV core protein plays a vital function in immune escape of HCV, drug resistance, and positively correlated with the development of liver fibrosis and HCC. To this end, we explored the molecular mechanisms of HCV core-related HCC.
The data collected from the present study indicated that the presence of HCV 1b core changed the host gene expression profiling in Huh7-core cells. For example, the changes were involved in the metabolism of macromolecule metabolic process and nucleic acid metabolic process as well as biochemistry reaction like DNA damage response. The KEGG pathway analysis suggested that these changed genes have a connection with the endoplasmic reticulum stress, apoptosis, calcium singling pathway, Wnt singling pathway, HBV and HCV infection signaling pathways, and so on.
Based on these bioinformation data, we predicted the HCV core protein-related carcinogenic pathways by the molecular target site predict platform (Figure 7A and B). From the hypothetic pathways, we selected the 14 genes as potential core regulatory genes, and found that 10 of the 14 identified genes were upregulated or downregulated by at least a 2-fold when compared between Huh7-core cells and Huh7-vector cells analyzed by RT-qPCR. We selected 3 interested genes that are high associated with regulating downstream target genes. Then, we overexpressed the genes of miR122, miR192, and miR204 in the Huh7-core cells by transfecting the PSUPER-miR122, PSUPER-miR192 and PSUPER-miR204 recombinants, respectively. The results showed the more than a 2-fold change gene expression were the genes of miR122, miR192, miR204, TGFBRAP1, HOTTIP, GLS1, and HPCAL1 (Figure 6). It is known that TGFBRAP1 (also called TRAP-1), a mitochondrial molecular chaperone of the Hsp90 family, is associated with HCC.32,33 We found that the miR122 expression was decreased, whereas TGFBRAP1 expression was increased in Huh7-core cells. Interestingly, this change was markedly inhibited in miR122 overexpressed Huh7-core cells, suggesting that the HCV genotype 1b core might upregulate TGFBRAP1 expression to promote HCC progression by downregulating miR122 expression.
Consistent with miR122 expression, miR204 expression was downregulated in Huh7-core cells, but HOTTIP expression was significantly upregulated. The HOTTIP (HOXA transcript at the distal tip) is a lncRNA, and the HOTTIP level is associated with liver fibrosis and HCC patients’ clinical progression.34,35 To analyze the potential relationship between miR204 expression and HOTTIP level, we overexpressed miR204 in Huh7-core cells, and found that the HOTTIP level was significantly downregulated in miR204 overexpressed Huh7-core cells. Hence, we propose that HCV1b core protein downregulates miR204 expression, leading to increase of HOTTIP expression, which might accelerate HCC process.
Additionally, to better understand the molecular changes in response to miR204 overexpression in Huh7-core cells, we found that mitochondrial GLS1 expression was significantly inhibited; however, HPCAL4 expression was markedly increased. Given that GLS1 playing a crucial role in regulating cellular catabolism and maintaining redox balance in cancer cells, its upregulation in cells is associated with increasing cell proliferation, and accounts for the majority of glutaminase activity in some human tumor cells.36,37 HPCAL4 is a relatively under-studied gene and has unknown function; however, a few reports showed that HPCAL4 can activate ERK1/2-MAPK signal pathway to promote p21 stabilization for inhibition of liver cancer.38,39 According to these data, we hypothesize that the miR204 overexpression in Huh7-core cells caused the GLS1 downregulated expression and HPCAL4 upregulated expression, and the expression of HOTTIP and GLS1 is proposed as positive correlation.40 Accordingly, the expression of HCV genotype 1b core protein leads to a specific gene expression profiling. This may account for the HCV core-related HCC disease.
In this study, we know that further investigation of the mechanisms of HCV genotype 1b core-related HCC is necessary for understanding the latent correlation between HCV infection and the involvement of ncRNAs in HCC process.
Conclusion
Our data raise the possibility that the HCV core expression not only results in downregulated miR204 expression that increases the expression of HOTTIP and GLS1 but also causes the activation of circ_0001498-miR122-TGFBRAP1 signaling pathway, which might be associated with promoting the HCC progression. Despite existence of uncertainty issues, our finding suggests that the HCV genotype 1b core might participate in HCV infection-related HCC.
Acknowledgments
This work was partly supported by the National Natural Science Foundation of China (No 81272612), and partly supported by the Funds for Outstanding PhD Academic Dissertations Candidate, Southeast University (YBJJ1746) as well as partly supported by the Collaborative Innovation Center of Suzhou NanoScience and Technology. We would also like to thank Dr Lin Wang from Educational Testing Service, USA, for checking and editing our manuscript.
Footnotes
Disclosure
The authors report no conflicts of interest in this work.
References
- 1.Dou J, Liu P, Wang J, Zhang X. Effect of hepatitis C virus core shadow protein expressed in human hepatoma cell line on human gene expression profiles. J Gastroenterol Hepatol. 2006;21(12):1794–1800. doi: 10.1111/j.1440-1746.2006.04380.x. [DOI] [PubMed] [Google Scholar]
- 2.Dou J, Liu K, Chen Z, et al. Effect of immunization in mice with recombinant DNA encoding the hepatitis C virus structural protein. Chin Med J (Engl) 1999;112(11):1036–1039. [PubMed] [Google Scholar]
- 3.Gale M, Jr, Foy EM. Evasion of intracellular host defence by hepatitis C virus. Nature. 2005;436(7053):939–945. doi: 10.1038/nature04078. [DOI] [PubMed] [Google Scholar]
- 4.Wróblewska A, Bernat A, Woziwodzka A, et al. Interferon lambda polymorphisms associate with body iron indices and hepatic expression of interferon-responsive long non-coding RNA in chronic hepatitis C. Clin Exp Med. 2017;17(2):225–232. doi: 10.1007/s10238-016-0423-4. [DOI] [PMC free article] [PubMed] [Google Scholar]
- 5.Afzal MS, Alsaleh K, Farhat R, et al. Regulation of core expression during the hepatitis C virus life cycle. J Gen Virol. 2015;96(Pt 2):311–321. doi: 10.1099/vir.0.070433-0. [DOI] [PubMed] [Google Scholar]
- 6.Sarasin-Filipowicz M, Krol J, Markiewicz I, Heim MH, Filipowicz W. Decreased levels of microRNA miR-122 in individuals with hepatitis C responding poorly to interferon therapy. Nat Med. 2009;15(1):31–33. doi: 10.1038/nm.1902. [DOI] [PubMed] [Google Scholar]
- 7.Shi L, Peng F, Tao Y, Fan X, Li N. Roles of long noncoding RNAs in hepatocellular carcinoma. Virus Res. 2016;223:131–139. doi: 10.1016/j.virusres.2016.06.008. [DOI] [PubMed] [Google Scholar]
- 8.Carnero E, Barriocanal M, Prior C, et al. Long noncoding RNA EGOT negatively affects the antiviral response and favors HCV replication. EMBO Rep. 2016;17(7):1013–1028. doi: 10.15252/embr.201541763. [DOI] [PMC free article] [PubMed] [Google Scholar]
- 9.Li ZQ, Gu XY, Hu JX, et al. Hepatitis C virus core protein impairs metabolic disorder of liver cell via HOTAIR-Sirt1 signalling. Biosci Rep. 2016;36(3) doi: 10.1042/BSR20160088. pii:e00336. [DOI] [PMC free article] [PubMed] [Google Scholar]
- 10.Liu X, Wang T, Wakita T, Yang W. Systematic identification of microRNA and messenger RNA profiles in hepatitis C virus-infected human hepatoma cells. Virology. 2010;398(1):57–67. doi: 10.1016/j.virol.2009.11.036. [DOI] [PubMed] [Google Scholar]
- 11.Huang JF, Guo YJ, Zhao CX, et al. Hepatitis B virus X protein (HBx)-related long noncoding RNA (lncRNA) downregulated expression by HBx (Dreh) inhibits hepatocellular carcinoma metastasis by targeting the intermediate filament protein vimentin. Hepatology. 2013;57(5):1882–1892. doi: 10.1002/hep.26195. [DOI] [PubMed] [Google Scholar]
- 12.Zhuo H, Tang J, Lin Z, et al. The aberrant expression of MEG3 regulated by UHRF1 predicts the prognosis of hepatocellular carcinoma. Mol Carcinog. 2016;55(2):209–219. doi: 10.1002/mc.22270. [DOI] [PubMed] [Google Scholar]
- 13.Cui M, Zheng M, Sun B, Wang Y, Ye L, Zhang X. A long noncoding RNA perturbs the circadian rhythm of hepatoma cells to facilitate hepatocarcinogenesis. Neoplasia. 2015;17(1):79–88. doi: 10.1016/j.neo.2014.11.004. [DOI] [PMC free article] [PubMed] [Google Scholar]
- 14.Blight KJ, McKeating JA, Rice CM. Highly permissive cell lines for subgenomic and genomic hepatitis C virus RNA replication. J Virol. 2002;76(24):13001–13014. doi: 10.1128/JVI.76.24.13001-13014.2002. [DOI] [PMC free article] [PubMed] [Google Scholar]
- 15.Dou J, Liu P, Wang J, Zhang X. Preliminary analysis of gene expression profiles in HepG2 cell line induced by different genotype core proteins of HCV. Cell Mol Immunol. 2006;3(3):227–233. [PubMed] [Google Scholar]
- 16.Dou J, Liu P, Zhang X. Cellular response to gene expression profiles of different hepatitis C virus core proteins in the Huh-7 cell line with microarray analysis. J Nanosci Nanotechnol. 2005;5(8):1230–1235. doi: 10.1166/jnn.2005.209. [DOI] [PubMed] [Google Scholar]
- 17.Ghosal S, Das S, Sen R, Basak P, Chakrabarti J. Circ2Traits: a comprehensive database for circular RNA potentially associated with disease and traits. Front Genet. 2013;4:283. doi: 10.3389/fgene.2013.00283. [DOI] [PMC free article] [PubMed] [Google Scholar]
- 18.Yang W, Li Y, He F, Wu H. Microarray profiling of long non-coding RNA (lncRNA) associated with hypertrophic cardiomyopathy. BMC Cardiovasc Disord. 2015;15:62. doi: 10.1186/s12872-015-0056-7. [DOI] [PMC free article] [PubMed] [Google Scholar]
- 19.Pasquinelli AE. MicroRNAs and their targets: recognition, regulation and an emerging reciprocal relationship. Nat Rev Genet. 2012;13(4):271–282. doi: 10.1038/nrg3162. [DOI] [PubMed] [Google Scholar]
- 20.Hansen TB, Jensen TI, Clausen BH, et al. Natural RNA circles function as efficient microRNA sponges. Nature. 2013;495(7441):384–388. doi: 10.1038/nature11993. [DOI] [PubMed] [Google Scholar]
- 21.Lukiw WJ. Circular RNA (circRNA) in Alzheimer’s disease (AD) Front Genet. 2013;4:307. doi: 10.3389/fgene.2013.00307. [DOI] [PMC free article] [PubMed] [Google Scholar]
- 22.Dennis G, Jr, Sherman BT, Hosack DA, et al. DAVID: database for annotation, visualization, and integrated discovery. Genome Biol. 2003;4(5):P3. [PubMed] [Google Scholar]
- 23.Ashburner M, Ball CA, Blake JA, et al. Gene ontology: tool for the unification of biology. The Gene Ontology Consortium. Nat Genet. 2000;25(1):25–29. doi: 10.1038/75556. [DOI] [PMC free article] [PubMed] [Google Scholar]
- 24.Yang C, Xiong F, Wang J, Dou J, Chen J, Chen D, et al. Anti-ABCG2 monoclonal antibody in combination with paclitaxel nanoparticles against cancer stem-like cell activity in multiple myeloma. Nanomedicine (Lond) 2014;9(1):45–60. doi: 10.2217/nnm.12.216. [DOI] [PubMed] [Google Scholar]
- 25.Xiong Y, Jia M, Yuan J, et al. STAT3-regulated long non-coding RNAs lnc-7SK and lnc-IGF2-AS promote hepatitis C virus replication. Mol Med Rep. 2015;12(5):6738–6744. doi: 10.3892/mmr.2015.4278. [DOI] [PMC free article] [PubMed] [Google Scholar]
- 26.Chen J, Wang J, Chen D, et al. Evaluation of characteristics of CD44+CD117+ovarian cancer stem cells in three dimensional basement membrane extract scaffold versus two dimensional monocultures. BMC Cell Biol. 2013;14:7. doi: 10.1186/1471-2121-14-7. [DOI] [PMC free article] [PubMed] [Google Scholar]
- 27.Chen D, Zhang Y, Wang J, et al. MicroRNA-200c overexpression inhibits tumorigenicity and metastasis of CD117+CD44+ ovarian cancer stem cells by regulating epithelial-mesenchymal transition. J Ovarian Res. 2013;6(1):50. doi: 10.1186/1757-2215-6-50. [DOI] [PMC free article] [PubMed] [Google Scholar]
- 28.Zhang H, Cai K, Wang J, et al. MiR-7, inhibited indirectly by lincRNA HOTAIR, directly inhibits SETDB1 and reverses the EMT of breast cancer stem cells by downregulating the STAT3 pathway. Stem Cells. 2014;32(11):2858–2868. doi: 10.1002/stem.1795. [DOI] [PubMed] [Google Scholar]
- 29.Zhang X, Dou J, Germann MW. Characterization of the cellular immune response in hepatitis C virus infection. Med Res Rev. 2009;29(6):843–866. doi: 10.1002/med.20157. [DOI] [PubMed] [Google Scholar]
- 30.Dou J, Chen Q, Wang J. Inhibition effect of Chinese herbal medicine on transcription of hepatitis C virus structural gene in vitro. World J Gastroenterol. 2005;11(23):3619–3622. doi: 10.3748/wjg.v11.i23.3619. [DOI] [PMC free article] [PubMed] [Google Scholar]
- 31.Zhang X, Dou J, Germann MW. Advances in the analysis of hepatitis C virus specific T cell responses. Mini Rev Med Chem. 2011;11(2):106–113. doi: 10.2174/138955711794519483. [DOI] [PubMed] [Google Scholar]
- 32.Rasola A, Neckers L, Picard D. Mitochondrial oxidative phosphorylation TRAP(1)ped in tumor cells. Trends Cell Biol. 2014;24(8):455–463. doi: 10.1016/j.tcb.2014.03.005. [DOI] [PMC free article] [PubMed] [Google Scholar]
- 33.Yoshida S, Tsutsumi S, Muhlebach G, et al. Molecular chaperone TRAP1 regulates a metabolic switch between mitochondrial respiration and aerobic glycolysis. Proc Natl Acad Sci U S A. 2013;110(17):E1604–E1612. doi: 10.1073/pnas.1220659110. [DOI] [PMC free article] [PubMed] [Google Scholar]
- 34.Wang KC, Yang YW, Liu B, et al. A long noncoding RNA maintains active chromatin to coordinate homeotic gene expression. Nature. 2011;472(7341):120–124. doi: 10.1038/nature09819. [DOI] [PMC free article] [PubMed] [Google Scholar]
- 35.Quagliata L, Matter MS, Piscuoglio S, et al. Long noncoding RNA HOTTIP/HOXA13 expression is associated with disease progression and predicts outcome in hepatocellular carcinoma patients. Hepatology. 2014;59(3):911–923. doi: 10.1002/hep.26740. [DOI] [PMC free article] [PubMed] [Google Scholar]
- 36.Curthoys NP, Watford M. Regulation of glutaminase activity and glutamine metabolism. Annu Rev Nutr. 1995;15:133–159. doi: 10.1146/annurev.nu.15.070195.001025. [DOI] [PubMed] [Google Scholar]
- 37.Yu D, Shi X, Meng G, et al. Kidney-type glutaminase (GLS1) is a biomarker for pathologic diagnosis and prognosis of hepatocellular carcinoma. Oncotarget. 2015;6(10):7619–7631. doi: 10.18632/oncotarget.3196. [DOI] [PMC free article] [PubMed] [Google Scholar]
- 38.Henderson LJ, Coe BP, Lee EH, et al. Genomic and gene expression profiling of minute alterations of chromosome arm 1p in small-cell lung carcinoma cells. Br J Cancer. 2005;92(8):1553–1560. doi: 10.1038/sj.bjc.6602452. [DOI] [PMC free article] [PubMed] [Google Scholar]
- 39.Zhang Y, Liu Y, Duan J, et al. Hippocalcin-like 1 suppresses hepatocellular carcinoma progression by promoting p21(Waf/Cip1) stabilization by activating the ERK1/2-MAPK pathway. Hepatology. 2016;63(3):880–897. doi: 10.1002/hep.28395. [DOI] [PubMed] [Google Scholar]
- 40.Ge Y, Yan X, Jin Y, et al. MiRNA-192 [corrected] and miRNA-204 directly suppress lncRNA HOTTIP and interrupt GLS1-mediated glutaminolysis in hepatocellular carcinoma. PLoS Genet. 2015;11(12):e1005726. doi: 10.1371/journal.pgen.1005726. [DOI] [PMC free article] [PubMed] [Google Scholar]


