

Abstract
There exists extraordinary variation among species in the degree and nature of sex chromosome divergence. However, much of our knowledge about sex chromosomes is based on comparisons between deeply diverged species with different ancestral sex chromosomes, making it difficult to establish how fast and why sex chromosomes acquire variable levels of divergence. To address this problem, we studied sex chromosome evolution in two species of African clawed frog (Xenopus), both of whom acquired novel systems for sex determination from a recent common ancestor, and both of whom have female (ZW/ZZ) heterogamy. Derived sex chromosomes of one species, X. laevis, have a small region of suppressed recombination that surrounds the sex determining locus, and have remained this way for millions of years. In the other species, X. borealis, a younger sex chromosome system exists on a different pair of chromosomes, but the region of suppressed recombination surrounding an unidentified sex determining gene is vast, spanning almost half of the sex chromosomes. Differences between these sex chromosome systems are also apparent in the extent of nucleotide divergence between the sex chromosomes carried by females. Our analyses also indicate that in autosomes of both of these species, recombination during oogenesis occurs more frequently and in different genomic locations than during spermatogenesis. These results demonstrate that new sex chromosomes can assume radically different evolutionary trajectories, with far-reaching genomic consequences. They also suggest that in some instances the origin of new triggers for sex determination may be coupled with rapid evolution sex chromosomes, including recombination suppression of large genomic regions.
Keywords: sex chromosomes, linkage map, recombination suppression, differentiation, amphibian, Xenopus
Introduction
Sex chromosomes originate when an autosome acquires a mutation that triggers development of one sex or the other. Recombination between sex chromosomes (the X and Y or Z and W) can be suppressed in regions that include and flank the sex determining mutation, which causes sex-specific inheritance of a sex determining trigger (Charlesworth 1991). Portions of sex chromosomes that lack recombination (e.g., the sex specific portions of the Y or W) and portions that have a reduced level of recombination compared with the autosomes (e.g., the nonpseudoautosomal regions of the X or Z) are subject to distinct population genetic phenomena from autosomes. These genomic regions generally have a lower effective population size than autosomes and thus experience weaker purifying selection (Rice 1994). Portions of each sex chromosome that have a sex-biased mode of inheritance may also have distinct mutation rates (Makova and Li 2002) and generation times (Amster and Sella 2016). Differences in the variance of reproductive success between each sex can further contribute to the disparity in the extent of genetic drift (the effective population size) of these regions (Charlesworth 2009).
A lack of recombination causes portions of the two sex chromosomes to diverge from one another in nucleotide sequence, gene content, and the abundance and distribution of transposable and other repetitive elements (Charlesworth and Charlesworth 2000; Bachtrog 2013). Additionally, the nonrecombining region may expand due to accumulation of sexually antagonistic genes, because sex-biased inheritance can mitigate sexual antagonism (Rice 1987; Wright et al. 2017). Over time, these factors can lead to cytological distinctions between the sex chromosomes, a condition known as sex chromosome heteromorphy. In various taxa (e.g., some mammals, birds, and plants), divergence of sex chromosomes occurred incrementally along the length of the sex chromosomes due to sequential inversions or natural selection on recombination modifiers, expanding the nonrecombining regions in a stepwise fashion (Coop and Przeworski 2007; Bergero and Charlesworth 2009; Vicoso et al. 2013).
Interestingly and perhaps counterintuitively, the age of the sex chromosomes does not seem to be tightly correlated with whether or not sex chromosomes are cytologically distinct (heteromorphic) or indistinct (homomorphic) (reviewed in Wright et al. 2016). In some old sex chromosomes, for example, those of neoaves (>100 Myr; Zhou et al. 2014) and therian mammals (∼150 Myr; Graves 2006), and also some young sex chromosomes, such as those of Drosphila miranda (∼1 Myr; Bachtrog and Charlesworth 2002) and Silene latifolia (10–20 Myr; Bergero et al. 2007), divergence between the sex chromosomes is pronounced. In contrast, in the old sex chromosomes of ratite birds (>100 Myr; Zhou et al. 2014), recombination is suppressed over large regions of the sex chromosomes, but accompanied at the nucleotide level by relatively modest differentiation between the sex chromosomes and minimal cytological differentiation (Vicoso et al. 2013; Yazdi and Ellegren 2014). An extreme case of homomorphy exists in the young sex chromosomes of tiger pufferfish, where a single mutation appears to control sexual differentiation and there is no evidence of suppressed recombination (Kamiya et al. 2012). In the young sex chromosomes of hylid tree frogs (∼5 Myr old) and Palearctic green toads (∼3.3 Myr old), recombination appears to be low or absent in heterogametic males, but there is not substantial nucleotide divergence (Stöck et al. 2011, 2013). Why sex chromosomes of some species are homomorphic whereas those of others are heteromorphic, and why some heteromorphic sex chromosomes are more cytologically diverged than others remains enigmatic (Wright et al. 2016).
Sex Chromosomes Evolved Multiple Times in Xenopus
Insights into the origin of variation among species in sex chromosome divergence may be gained by examining whether, to what extent, why, and for how long recombination is suppressed in genomic regions flanking the sex determining locus in multiple species. For this reason, we quantified and compared recombination on the sex chromosomes of the African clawed frog, Xenopus Xenopus laevis, and the Marsabit clawed frog, Xenopus Xenopus borealis. The most recent common ancestor of these two species experienced allotetraploidization ∼18–34 Ma (Evans et al. 2015; Session et al. 2016). These and other allotetraploid species in subgenus Xenopus have 2n = 4 s = 36 chromosomes, where n refers to the number of chromosomes in a haploid gamete and s refers to the number of chromosomes in an ancestral gamete prior to genome duplication. Chromosomes in tetraploids in subgenus Xenopus are numbered 1–18 followed by an L or an S, indicating from which of two diploid ancestors each chromosome was derived (Matsuda et al. 2015).
Species in genus Xenopus have homomorphic sex chromosomes (Tymowska and Fischberg 1973; Tymowska 1991), and three nonhomologous sex determining systems have been identified in this group. One is on chromosome 2 L of the allotetraploid species X. laevis (Yoshimoto et al. 2008) and also several other allopolyploid Xenopus species (Bewick et al. 2011). In these species, the W chromosome carries a gene called DM-W that triggers female sexual differentiation (Yoshimoto et al. 2008). DM-W originated after the whole genome duplication event ancestral to subgenus Xenopus species (Bewick et al. 2011). A second sex determination system in Xenopus is located on chromosome 8 L in the allotetraploid species X. borealis (Furman and Evans 2016). This sex determination system evolved in X. borealis from an ancestor that carried DM-W (Furman and Evans 2016). A third sex determination system in Xenopus is located on chromosome 7 in the diploid species Xenopus Silurana tropicalis (Olmstead et al. 2010; Evans et al. 2015). In X. tropicalis, Z, W, and Y chromosomes segregate (Roco et al. 2015). Overall then, of the three sets of sex chromosomes in Xenopus, at least two—those of X. laevis and X. borealis – are newly evolved, and the system of X. borealis is proposed to be derived with respect to (i.e., younger than) the system of X. laevis (fig. 1; Furman and Evans 2016).
Fig. 1.
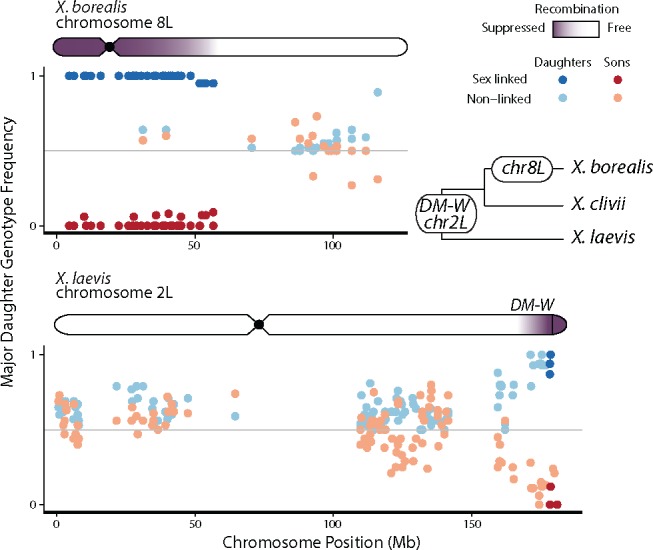
—Sex-linkage of SNPs on sex chromosomes of X. borealis and X. laevis. In each graph, the x-axis is the position on the sex chromosome using the coordinates of the X. laevis reference genome and the y-axis is the major daughter genotype frequency in sons and daughters (see Materials and Methods for details) with colors as defined in the key indicating whether or not a SNP is significantly associated with sex (FDR corrected P < 0.05). For each species, a diagram of a chromosome is shaded darker in the region of suppressed recombination. The inset phylogeny is from Furman and Evans (2016); DM-W is carried by female X. clivii, but its presence on chr2L has not been confirmed.
This variation in sex chromosomes among Xenopus species presents an opportunity to compare the evolutionary trajectories of two newly established sex chromosome systems (i.e., the sex chromosomes of X. borealis and X. laevis). Some differences between the W and Z chromosomes of X. laevis have been detected, including differences in gene content, insertion–deletion mutations, and nucleotide divergence, but this limited to only a few hundred Kb (<1% of the chromosome length; Mawaribuchi et al. 2017). However, in general, in X. laevis and most other Xenopus species little is known about fundamental evolutionary genomic characteristics of sex and recombination, such as sex chromosome-wide levels of divergence, the extent of sex-linkage of genes on sex chromosomes, genome-wide variation in rates of recombination, or sex differences in rates of recombination. We therefore used reduced genome sequencing of parents and offspring of each species to assess sex-linkage of SNPs and to construct sex specific linkage maps for both species. We found that these two systems differ greatly in the extent of sex chromosome recombination suppression during oogenesis, with the younger system in X. borealis exhibiting a substantially larger region than the older system of X. laevis. Whole genome sequence data indicate that the nonrecombining portions of the X. borealis sex chromosomes have a modest, but detectable, level of nucleotide divergence. Finally, linkage mapping in both species demonstrates that females have higher rates of recombination than males of both species, and that the location of crossovers is distinctive between females and males in both species, but similar in same sex comparisons across species. These findings demonstrate that newly evolved sex chromosomes in different species may rapidly assume radically different evolutionary trajectories.
Materials and Methods
Reduced Representation Genome Sequences from X. laevis and X. borealis Families
To assess genome wide sex-linkage, we used reduced representation genome sequencing (genotype by sequencing [GBS], Elshire et al. 2011; and restriction site associated DNA sequencing [RADSeq], Baird et al. 2008) on parents and offspring of an X. borealis family and an X. laevis family, respectively. For the X. borealis family, we used GBS data that we previously reported (Furman and Evans 2016), with a female and male obtained from XenopusExpress (Brooksville, FL). These GBS data included mother, father, 24 daughters, and 23 sons (22 and 17 individuals, respectively, after filtering, see supplementary S1.1, Supplementary Material online), with offspring sex determined by dissection after euthanasia. The GBS data were 100 base pairs (bp) single-end sequences; library preparation and sequencing was performed at Cornell University Institute of Biotechnology Genome Diversity Facility on an Illumina HiSeq 2500; other details about these data available in Furman and Evans (2016). For the X. laevis family, we obtained female and male individuals from Boreal Science (St. Catharines, ON, Canada). We induced breeding with injection of human chorionic gonadotropin and determined the sex of tadpoles using primers for DM-W, which amplifies only in females, and primers for DMRT1, which is present in both sexes, as a positive control (Yoshimoto et al. 2008). The RADSeq library was generated by Floragenex (Portland, OR) on both X. laevis parents, 17 daughters, and 20 sons and 150-bp single-end sequencing was performed at the University of Oregon using an Illumina HiSeq 2500 machine. Though slightly different procedures were used to generate reduced representation genome sequences from each species, the nature of the data is essentially the same—both methods produced sequence data from many homologous regions in most or all individuals from each family.
GBS or RADSeq data from each X. borealis or X. laevis individual were demultiplexed, trimmed, and aligned to the X. laevis genome version 9.1 (www.xenbase.org) followed by genotyping and filtering steps that are described in the supplementary S1.1, Supplementary Material online. This yielded a panel of SNPs for each family that were used to study recombination as described next. We discuss the potential impacts that the differences in the data sets of X. borealis and X. laevis may have on our study in supplementary S1.1, figure S4, Supplementary Material online.
Sex-Linked Genomic Regions
In X. laevis and X. borealis, females are the heterogametic sex (Yoshimoto et al. 2008; Furman and Evans 2016). Using the filtered data for both families, we thus calculated maternal genotype association with the phenotypic sex (male or female) of each individual SNP following Goudet et al. (1996). Significance was assessed using a false discovery rate correction on the P value of association with sex (α = 0.05, using R; R Core Team 2016) and we discarded from this analysis maternal SNPs that were also heterozygous in the father. In order to make inferences discussed below about the region of suppressed recombination that flanks the trigger for sex determination, for each maternal SNP, we also determined the frequency of the most common genotype in daughters and then the frequency of this same genotype in sons. We refer to this frequency as the “major daughter genotype frequency.” At a completely sex-linked site that was heterozygous in the mother and homozygous in the father, we expected offspring genotypes to be homozygous in one sex and heterozygous in the other (which sex is heterozygous depends on whether the SNP was on the maternal Z or W). Thus, the major daughter genotype frequency at a completely sex-linked site would be 1.0 for daughters, and 0.0 for sons. Conversely, at an autosomal site the major daughter genotype frequency in daughters should be ∼50% (but always ≥50% because we excluded from this analysis positions with more than two variants). In sons, the major daughter genotype frequency should also be ∼50% at autosomal sites, but could be lower or higher than this value.
Linkage Maps
We set out to evaluate rates and locations of recombination events in the mother and the father of our laboratory crosses. To accomplish this, we used the R package OneMap (Margarido et al. 2007) to construct linkage groups based on variable sites from the X. borealis and X. laevis families that mapped to each of the 18 X. laevis chromosomes in the reference genome. For each X. laevis chromosome and separately for each species, linkage groups were constructed with a maximum recombination fraction of 0.4 and a LOD threshold of five. With perfect synteny between the X. laevis and X. borealis and an even genomic distribution of genotyped SNPs, there should be one linkage group per X. laevis chromosome. However, we frequently identified several linkage groups per X. laevis chromosome in each species and we suspect that this was a consequence of genotyping and mapping errors (see below) and regions with sparse SNPs due to poor mapping of X. borealis reads to the X. laevis reference genome. For the X. borealis family, rearrangements between X. borealis and X. laevis could also break up a chromosome-specific linkage group. For either species, genome assembly errors could also prevent assembly of one linkage group for a chromosome. We note that our linkage maps did not include a particularly large number of offspring (39 in X. borealis and 37 in X. laevis), and this contributed to a lack of statistical power to form whole-chromosome linkage groups. However, this was not a concern for (or an objective of) our analyses, which focus on genomic regions for which assembly of linkage groups was possible.
In order to evaluate rates of recombination in the mother and father of each species, we selected the largest linkage group from each chromosome and divided the markers in each linkage group into those that were heterozygous in the mother, in the father, or in both parents. Then, using each of the maternal and paternal sets of markers from each of the largest linkage groups per chromosome, we recomputed recombination fractions between the sets of sex-specific markers and constrained marker order to match the mapping position in the v.9.1 X. laevis genome. For the X. borealis family, some chromosomes had very few or no double heterozygous sites (sites that were heterozygous in both parents), which is a consequence of the lower overall amount of data for this cross compared with the X. laevis cross (due to mapping of X. borealis but not X. laevis data to a diverged reference genome, and the lower overall coverage we obtained from the GBS data compared with the RADSeq data). This meant that the recombination fractions between male and female markers were unable to be estimated for some chromosomes, and thus the first step of creating a joint linkage group could not be performed. For these chromosomes, we instead selected the largest female-specific and largest male-specific linkage group for each chromosome independently to estimate sex-specific linkage maps. Thus for these chromosomes, the male and female linkage groups do not span identical genomic regions.
Error Correction and Haplotype Estimation
Genotyping errors create genotypes resembling recombined haplotypes that distort linkage maps and lead to inflated map lengths (Hackett and Broadfoot 2003). Although we filtered incompatible parent–offspring genotypes (supplementary S1.1, Supplementary Material online), undercalling of heterozygous sites can also produce incorrect homozygous genotypes in offspring that are nonetheless compatible with parental genotypes. To deal with this problem, we identified putative genotype errors based on phased offspring haplotypes. Each parent has two haplotypes per chromosome, and sites inherited by offspring can be assigned to one or the other haplotype for each parent. Recombination during gametogenesis creates new combinations of the two parental haplotypes within an offspring, with the “phase” referring to which parental haplotype an offspring site comes from (see supplementary fig. S1, Supplementary Material online, for a visual explanation). Genotyping errors appear as a change in phase for a single SNPs (or a few SNPs in a row) when compared with surrounding SNPs. This pattern at one or few sites can also arise biologically from a double recombination (a crossover on either side of a variable position). However, double recombination events in small genomic windows are considered to be rare because of recombination interference (reviewed in Zickler and Kleckner 2016).
To identify putative genotype errors, we used the parental phase estimated during linkage map construction (using OneMap; see Wu et al. 2002 for details on phase estimation of outcross maps) to estimate the parental haplotypes inherited by each offspring individual, for each chromosome-specific linkage map (supplementary fig. S1a and b, Supplementary Material online). Under the assumption that double recombination events are rare in small genomic windows, we set to missing data any single genotype supporting a phase change in an individual at just that site (i.e., sites whose flanking genotypes were consistent double recombination event around a single genotyped site). As well, any genotypes in an individual that indicated a double recombination event that only encompassed a small genomic window of <5 Mb were set to missing data (i.e., a series of sites within 5 Mb who were in an alternate phase compared with adjacent sites). For the X. laevis cross, which involved substantially more markers than the X. borealis cross, there were more of these potential genotyping errors (4% of all genotyped sites in individuals indicated a double recombination at either a single site or phase changes encompassing <5 MB in the X. laevis maps, compared with <0.5% for either in the X. borealis map; supplementary table S1, Supplementary Material online). Over 90% of the putative genotyping errors that were identified based on double recombination like phase changes in the X. laevis maps were homozygous, which is consistent with the bulk of these putative errors having been generated by undercalled heterozygous positions (supplementary table S1, Supplementary Material online). After setting these genotypes to missing data in the affected individuals, we reestimated linkage maps for each chromosome, for each parent for each species. Map distances were then calculated using the Kosambi function (Kosambi 1943).
To quantify recombination events across all maps, we counted all phase changes in each linkage map for each individual based on haplotypes that were constructed from phased SNPs in each offspring. The location of recombination events was approximated as half the distance between the two markers bordering a recombination event in the X. laevis reference genome. We assessed the relationship between linkage map length and the amount of bp covered (on the X. laevis genome) by each map using a linear model, fitting an interaction between sex and species, along with a three-way interaction between sex, species, and the Mb covered by a linkage map (after scaling and centering Mb) using R. This strategy allowed us to assess for each sex and species slopes for the relationship between cM and Mb. We then used the confint function to compute confidence intervals on the estimates.
Divergence between the W and Z Chromosomes of X. borealis
As discussed below, our analysis identified a large region of the X. borealis sex chromosomes that had sex-linked inheritance. If recombination has been suppressed in this region for a protracted period of evolutionary time, we expected molecular polymorphism in the mother to be higher than the homologous region of the father due to the accumulation of diverged sites between the W and Z. For this reason, we also predicted that polymorphism in this region of the maternal sex chromosomes would be higher than other recombining portions of the maternal genome.
To explore the effects of this lack of recombination at the nucleotide level, we performed whole genome sequencing on the parents of our X. borealis family using the Illumina HiSeqX platform at The Center for Applied Genomics (Toronto, Canada), with both individuals multiplexed across two lanes. We trimmed the data, mapped it to the X. laevis reference genome, and genotyped and filtered the data as described in the supplementary S1.4, Supplementary Material online. Mapping to a diverged reference genome could lead to a bias of more conserved sequences mapping, than sequences that have evolved quickly. With sex chromosomes, faster-Z (i.e., rapid evolution of Z-linked genes) or degeneration of the W sequences could lead to an underrepresentation of rapidly evolved sequences, leading to an underestimation of divergence. Contrary to this expectation, however, the number of reads mapped to the sex linked region of chromosome 8 L in the female (10.2 million) was similar to other identically sized regions of other chromosomes (range 7.8–11 million).
One concern in the quantification of divergence in the nonrecombining portion of the sex chromosomes is that intergenic regions may have many mapping errors due to repetitive sequences. For this reason, we focused our calculation of nucleotide diversity on genomic regions that are within and flank genes, because these areas contain less repetitive DNA (at least in X. tropicalis; Shen et al. 2013). We used the X. laevis genome annotation (version 9.1 primary gene models gff file; www.xenbase.org) to separately calculate nucleotide diversity (π) in each parent for coding sequence of genes (hereafter CDS), introns, 5′ and 3′ untranslated regions (hereafter UTR), 5,000-bp upstream of the 5′-UTR, and 5,000- bp downstream of the 3′-UTR for genes on all chromosomes. We considered only estimates that were generated from at least 200 bp of contiguous data from both X. borealis individuals. Overall, we measured π in 30,876 CDS regions, 3,092 5′-UTRs, 14,954 3′-UTRs, 119,420 introns, 30,326 upstream regions, and 30,270 downstream regions (for a total of 230,016 genomic regions) in the female and the male X. borealis individuals.
To test whether the W and Z chromosomes were more diverged in the mother than the homologous Z region in the father, we used a linear mixed model implemented by the lme4 package in R (Bates et al. 2015). We set as fixed effects sex (female or male) and sex-linkage (defined as sex-linked if between bp 4,605,306 and 51,708,524 [corresponding to 100% sex linked tags; fig. 1] of chromosome 8 L as defined by the analysis of sex-linked GBS tags discussed below). The six categories of gene regions (CDS, 5′- and 3′-UTRs, introns, up/down-stream) were set as a random effects. The model also included an interaction between the two fixed effects (sex and sex-linkage). We then used likelihood profiles (using the profile command in lme4) to calculate confidence intervals on the estimated coefficients.
To visualize and test for differences in divergence within the sex-linked region, we calculated median π for the mother and father in 1-Mb windows of chromosome 8 L, using the π estimates from each of the genomic regions (intragenic, 5′-UTR, 3′-UTR, introns, 5,000 bp upstream of genes, and 5,000 bp downstream of genes). Because the mother and father had different levels of polymorphism, we needed to control for this difference in our comparisons between genomic regions of each individual. We therefore first calculated the median π value of all 1-Mb windows across chromosome 8 L for each individual. We then standardized the maternal and paternal estimates of π by dividing by their corresponding chromosome-wide median. In order to compare these standardized values of diversity, we then divided the standardized estimates of π measured in each 1-Mb window of the mother by the standardized estimates of π measured in the homologous window of the father. With no difference in level of divergence between alleles, we expected this ratio to equal one; if the W and Z chromosome were more diverged from each other in the mother than the two Z chromosomes were from each other in the father, this ratio should be greater than one. We tested for a difference between the sex-linked and nonsex-linked portions using a Wilcoxon rank sum test and the measured disparity between parents of each 1 Mb estimates of standardized π. We also explored whether there was a higher rate of synonymouns and nonsynonymous substitutions in genes on the nonrecombining portion of the sex chromosomes to the rest of the genome using the WGS sequence data as described in detail in the supplementary S1.5, Supplementary Material online. Finally, we explored the possibility of an accumulation of deletions and/or insertions on the sex chromosomes. Further details of these analyses are presented in the supplementary S1.6, Supplementary Material online.
Validation of X. borealis Sex Chromosomes and Recombination Suppression
To explore whether the expansive region of suppressed recombination in X. borealis was limited to our lab raised family, we raised a second family of X. borealis using different parents. We then sequenced two genes (SOX3 and NR5A-1 [alternatively, SF-1]) located 25 Mb apart within the sex linked region (according to placement in the X. laevis genome v9.1) to look at coinheritance of alleles from parents to offspring. We also surveyed a panel of adults that were not used in either cross from both sexes to assess linkage of alleles at these two genes. Further details of these assessments are in the supplementary S1.3, Supplementary Material online.
Results
Diverse Evolutionary Fates of Newly Evolved Sex Chromosomes
Our analysis of the sex chromosomes of X. borealis and X. laevis identified a far larger region of sex-linked SNPs in X. borealis (fig. 1). In X. borealis, 40 maternal SNPs spanning ∼52 Mb (43%) of the sex chromosome (8 L) had a significant association with the phenotypic sex of offspring (positions 4,605,306–56,690,925 of a total chromosome length of ∼120 Mb in the X. laevis genome assembly; P < 0.05 after FDR correction; fig. 1 and supplementary fig. S2, Supplementary Material online). Within this region, daughters had identical genotypes at 34 of the 40 SNPs, with only one daughter differing for the last seven in the region (see below). Similarly in most sons, maternally inherited molecular variation in this genomic region was also almost entirely sex-linked, with exceptions discussed below. Across the entire genome after filtering, the SNP data set consisted of 1,813 variable positions and there were more heterozygous SNPs in the mother than the father (1,103 and 644 SNPs in the mother and father, respectively, and 66 positions were heterozygous in both parents, with 15–133 SNPs per chromosome, and a mean of 61.8 maternal SNPs per chromosome). For maternal heterozygous positions used for assessing sex linkage in X. borealis, daughters had a median depth of 68 and genotype quality of 99 (maximum possible value), sons had a depth of 31 and a genotype quality of 99 (supplementary fig. S4, Supplementary Material online). Aligning to the diverged X. laevis genome substantially reduced the number of SNPs recovered to ∼10% of the de novo SNP discovery method that did not involve mapping to the X. laevis genome (Furman and Evans 2016).
In sharp contrast, on the X. laevis sex chromosomes (2 L) significant sex-linkage was only detected at only six maternal SNPs spanning 2 Mb (1%; positions 178,144,865 to 180,779,644, and possibly to the end of the chromosome at ∼181,296,000; P < 0.05 after FDR correction; fig. 1 and supplementary fig. S5, Supplementary Material online). In X. laevis, SNPs immediately adjacent to the statically associated SNPs also had a strongly sex-biased pattern of inheritance, which is consistent with recombination suppression of this region (fig. 1). A lack of a statistically significant sex-linkage of some SNPS in this small genomic region may be a consequence of undercalled heterozygous positions (supplementary table S1, Supplementary Material online and see Materials and Methods). Across the entire genome, there were 7,779 SNPs, and in this family. The father was more polymorphic (1,618 and 4,547 in mother and father, respectively, and 1,614 positions were heterozygous in both parents). For maternal heterozygous positions used in the sex linkage analysis of X. laevis, daughters had a median depth of 67, and a genotype quality of 99, sons had a depth of 61 and a genotype quality of 99 (supplementary fig. S4, Supplementary Material online).
Within the sex-linked region of X. borealis, there was a section with no recombination, and an adjacent section with reduced recombination between positions 51,708,524–56,690,925 of chromosome 8 L (fig. 1). Seven consecutive SNPs on the end of this region indicated recombination between the W and Z in one daughter, who had the same genotype as the sons at these positions (fig. 1). Additionally, by inspecting changes in parental phase in the offspring (see below), another maternal recombination event was observed immediately adjacent to the region of completely suppressed recombination in one of the sons (supplementary fig. S3, Supplementary Material online). We note that additional information from more offspring or other families could potentially identify more recombination events within the genomic region where we did not observe recombination.
The genomic locations of several SNPs in the X. borealis family suggested genotyping or mapping error (supplementary fig. S2, Supplementary Material online). For a few sites within the otherwise completely sex-linked region of chromosome 8 L, different individual sons had the same genotype as their sisters (fig. 1). If this were due to a real recombination event, we would expect these sons to have the same genotype as their sisters at adjacent SNPs as well. Although this pattern could arise from independent double recombination events around these single sites in different sons, a more plausible explanation is that these are genotyping errors.
We observed three SNPs that mapped to the middle of the sex-linked region of chromosome 8 L that were not associated with sex (P > 0.05, following FDR, two sites are overlapping on the plot; fig. 1), and we also found five SNPs that were completely sex-linked that mapped chromosome 8 S. These genotypes are best explained by mapping error between X. borealis sequence reads and the X. laevis genome, or perhaps assembly error in the X. laevis genome wherein homeologous portions of the 8 L and 8 S chromosomes are intermingled in the assembly. It is also possible that sections of homeologous sequences of X. laevis and X. borealis were lost in an asymmetric fashion after whole genome duplication, such that chromosome 8 L in X. laevis is missing portions that were not lost in X. borealis. This could cause reads from X. borealis to map to homeologous sequence in the X. laevis genome, instead of to the missing orthologous sequence in X. laevis.
We also identified a sex-linked site in X. borealis that mapped to X. laevis chromosome 5S (supplementary fig. S2, Supplementary Material online). We blasted sequence from the GBS tag that contained this SNP to a de novo assembly of the maternal X. borealis HiSeqX data that were assembled using SOAPdenovo v.2.04, with a kmer = 23, and default parameters. We then blasted the top hit scaffold back to the X. laevis genome and found that its best matches were chromosomes 8S and 8 L with similar affinities. This suggests that that this site could be a translocation between X. borealis and X. laevis, an assembly error in the X. laevis genome, or a mapping error due to the short sequence length (<100 bp) of each GBS tag.
Recombination Is Higher in Females of Both Species
Sex differences in the linkage maps revealed higher recombination rates in females of both species. The female linkage maps of both species were longer (X. laevis = 1,572 cM; X. borealis = 719 cM) than the same-species male linkage maps (X. laevis = 1,275 cM; X. borealis = 165 cM; fig. 2). Longer female maps were recovered despite female markers spanning fewer base pairs of the X. laevis genome in both species (X. laevis female = 1.76 Gb, male = 2.28 Gb; X. borealis female = 0.96 Gb, male = 1.72 Gb; fig. 2). Consistent with this, the number of crossovers is higher in oogenesis than spermatogenesis in both species (X. laevis: oogenesis = 558 total; 15.1/offspring, spermatogenesis = 467 total; 12.6/offspring; X. borealis: oogenesis = 270 total, 7.3/offspring; spermatogenesis = 62 total; 1.6/offspring).
Fig. 2.
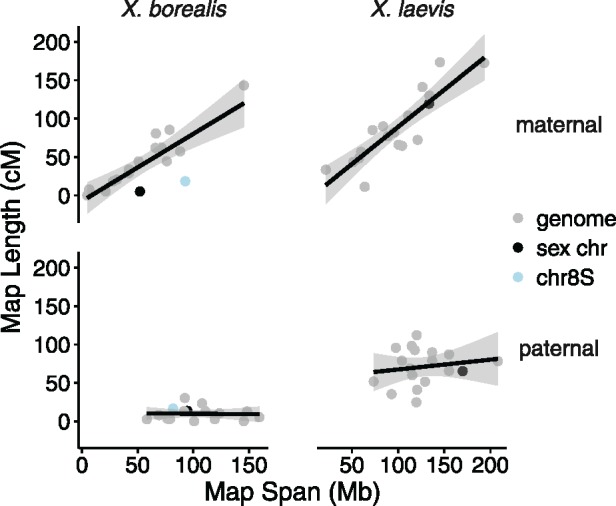
—Linkage map length (in cM) is positively correlated with the number of bp spanned by the map (based on the X. laevis genome) for maternal but not paternal linkage maps. Black “sex chr” dots indicate the linkage map of the sex chromosome of each species (chromosome 8 L in X. borealis, chromosome 2 L in X. laevis). Lines reflect linear model relationships; gray shading indicates the 95% confidence interval of this relationship. Additionally, chromosome 8S is highlighted for X. borealis, because it is the homeolog of the sex chromosome 8 L (see Results for details).
Also of note is that the locations of crossovers were distinctive in females and males of both species. Female crossovers we more concentrated in the middle of the chromosomes, whereas male crossovers occurred more often at the ends of chromosomes (fig. 3). Possibly related to this (see Discussion), the length in cM of female linkage maps of both species was positively correlated with the number of bp covered by a map, but this relationship was not found in the male linkage maps from either species (linear model slope estimates, 95% confidence intervals: X. borealis female = 36.96, 24.78–49.13, male = −0.50 −14.96–13.95, X. laevis female = 40.80, 30.66–50.94, male = 5.40, −8.04–18.83; fig. 2). Similar results were recovered when total length of chromosome was used instead of the number of bp covered by the linkage map, or when the number of crossover events was used instead of total cM (results not shown).
Fig. 3.
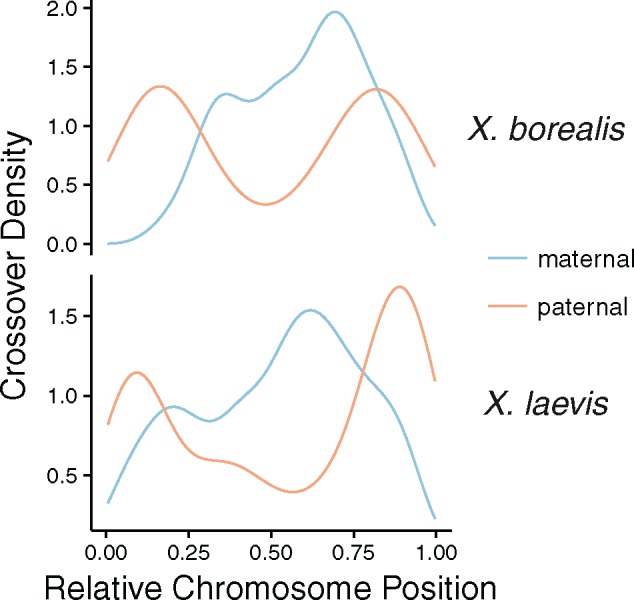
—Density plots of recombination events with respect to the relative position along chromosomes (chromosome length scaled to be between 0 and 1) in the maternal and paternal linkage maps of X. borealis and X. laevis.
For the X. borealis family, the largest female linkage group on chromosome 8 L (the sex chromosome, which includes both the Z and the W chromosomes) was formed from markers that mapped to the sex-linked portion (fig. 1), and did not include markers from the nonsex-linked portion (see Materials and Methods for possible explanations). This region spanned 52 Mb (43% of the total X. laevis chromosome 8 L) and was only 5 cM in length. That this recombination probability is not 0 cM is attributable to two recombination events at the end of the region, each of which is illustrated in plots of offspring haplotype assignment (supplementary fig. S3, Supplementary Material online). The female linkage map of chromosome 8 L was much shorter in recombination probability (cM) than other female and male linkage maps that spanned similar numbers of bp on other chromosomes (fig. 2). The male map of chromosome 8 L in the X. borealis family, which corresponds to a pair of Z chromosomes, spanned almost the entire chromosome, and had a length of 13 cM, which is similar to other chromosomes (fig. 2). In the father, we detected five recombination events within the portion of chromosome 8 L (i.e., between two Z chromosomes) that had suppressed recombination in the mother (i.e., the region where there was almost no recombination between the W and Z chromosomes; supplementary fig. S3, Supplementary Material online).
Interestingly, even though it is not a sex chromosome, the maternal linkage map of the X. borealis chromosome that is homeologous to the sex chromosome—chromosome 8 S—was also substantially shorter in cM than other linkage maps spanning a similar amount of megabases (it was below the best fit line; fig. 2). This suggests that recombination is less frequent on this homeologous chromosome than other autosomes, even though it is not sex-linked.
The X. laevis female linkage map of chromosome 2 L did not include the last 20 Mb, which is where DM-W resides (Session et al. 2016), and where we detected sex-linked SNPs (fig. 1). Therefore, we did not detect any restricted recombination in this map, and the size (in cM) of the linkage map of this chromosome was similar to the size of the linkage maps for other chromosomes spanning similar amounts of Mbp (fig. 2).
Divergence between the Sex-Linked Portions of the W and Z Chromosomes of X. borealis
We analyzed genotypes inferred from whole genome sequencing data from the mother and the father to test whether we could detect evidence of sex chromosome divergence between sex-linked portions of the W and Z sex chromosomes. Compared with the pseudoautosomal portion of chromosome 8 L and also to the autosomes, the sex-linked portion of chromosome 8 L had the highest median nucleotide diversity in the female (pairwise nucleotide diversity ; fig. 4a). In this female genome, diversity within the nonsex-linked (pseudoautosomal) portion of chromosome 8 L was similar to that of other chromosomes (; fig. 4a). In the male genome, diversity of each portion of chromosome 8 L fell within the range of estimates from other chromosomes from this genome (sex linked: ; nonsex linked: ; fig. 4a). The nucleotide diversity measured for these chromosomes is far less than the 7% divergence of homeologous sequences (Evans and Kwon 2015); the considerably lower π estimates reported here suggest that cross mapping of reads across subgenomes was relatively rare.
Fig. 4.

—Nucleotide diversity (π) in X. borealis based on WGS data mapped to the X. laevis reference genome. (a) Median π by chromosome as measured in the six genomic categories; error bars indicate 95% CI bootstrap estimates (for further information on differences see supplementary S1.4, Supplementary Material online). The 8 L_NL category refers to the diversity measured on chromosome 8 L in the nonsex-linked region (57–120 Mb). (b) Box and whisker plot of π across six genomic categories (described in Materials and Methods); the y-axis is truncated at 0.05 for clarity. (c) Standardized nucleotide diversity of the female divided by the standardized nucleotide diversity of male in 1-Mb windows across chr8L; the completely sex-linked region is highlighted in dark purple, and the significantly sex linked region with suppressed recombination in light purple (see fig. 1).
Analyses of nucleotide diversity in and around genes (divided into six categories; see Materials and Methods), which used a linear mixed model, recovered a significant interaction between sex and sex-linkage, indicating that the mother had a higher π than the father in the sex-linked portion of chromosome 8 L compared with the rest of the genome, and after controlling for differences in polymorphism between these individuals (estimate of the increase in female diversity in the sex linked region = 0.0018, 0.0009–0.0027 95% CI, t-stat = 4.09; fig. 4b). For this analysis, we discarded the first four million base pairs of chromosome 8 L because we lacked information on whether this region is also sex-linked (fig. 1).
We note that nucleotide diversity in the sex-linked portion of the female sex chromosomes includes fixed differences between the W and Z chromosomes and also positions that are segregating on the Z chromosome. Thus, this measurement is influenced by demographic differences between the female and male (the female genome is more polymorphic; fig. 4). However, we found that standardizing the estimates of nucleotide diversity by the genome-wide average for each individual (by dividing diversity estimates from the male or female genome by the corresponding genome-wide mean for each genome) did not affect the results of the linear mixed model (see Results and supplementary S1.4, Supplementary Material online). In the analysis of nucleotide diversity, the sex linked portion of chromosome 8 L stood out as the most polymorphic region in the female genome, supporting the existence of fixed divergent sites between the W and Z chromosomes.
The disparity between the female and male in nucleotide diversity along chromosome 8 L was greater in the sex-linked portion than the pseudoautosomal portion of chromosome 8 L (Wilcoxon rank sum test: P < 0.001; fig. 4c). This result is consistent with the results of the linear mixed model (above). There was also a peak of divergence near end of the chromosome in the nonsex-linked region (fig. 4c), that overlapped with a region where X. borealis daughters were mostly inheriting the same allele, suggesting partial sex-linkage (fig. 1). This could be due to an inversion, although we did not explore this possibility in our data.
Within coding regions, dN and dS were very slightly, but significantly (statistically) elevated in the sex-linked region of X. borealis compared with the rest of the genome for both the female and male, but dN/dS was not (based on a permutation test; see Supplement 1.5). But, unlike the analysis of all SNPs (above), which included more data, the sex linked region was not the highest for any value (dN, dS, or dN/dS) compared individually to the other chromosomes. This emphasizes the subtlety of the divergence in the sex linked region and indicates that the time since recombination suppression is recent. We did not recover evidence of substantial differences in coverage between the female and male on the sex chromosomes (see supplementary S1.6, Supplementary Material online).
Discussion
More Expansive Recombination Suppression on Younger Sex Chromosomes
The homomorphic sex chromosomes of X. borealis and X. laevis experienced distinctive evolutionary histories since they originated. In X. laevis, the sex-linked region is restricted to a small portion on the end of a chromosome (2 L). In X. borealis, however, the sex-linked region encompasses almost half of a chromosome (8 L; fig. 1), even though this sex chromosome system is thought to be derived with respect to the sex determination system of X. laevis (Furman and Evans 2016). Within the region of suppressed recombination of both of these species, there is evidence of sex chromosome divergence at the molecular level (X. borealis: fig. 4a–c and supplementary S1.5, Supplementary Material online; X. laevis: Mawaribuchi et al. 2017). Although the magnitude of sex chromosome divergence in the large sex-linked region of X. borealis is modest, it appears that recombination has been suppressed over sufficient evolutionary time for these differences to be detectable, presumably for many thousands of generations or more. Supporting this, our second family of lab-reared X. borealis and the surveyed panel of adults also had completely suppressed recombination in this large region (there were some sex linked female heterozygous sites that appeared in both families and others that were unique to one family or the other, see supplementary S1.3, Supplementary Material online). Together, these findings are consistent with observations made in other, more diverged species that the extent of recombination suppression need not be more expansive in older than younger sex chromosomes (reviewed in Wright et al. 2016). They further demonstrate that newly established sex chromosomes may assume radically different evolutionary trajectories.
We infer here that the younger sex chromosomes of X. borealis have a larger region of suppressed recombination than the older sex chromosomes of X. laevis. One possibility is that this is due to a large scale genomic change, such as an inversion or deletion leading to widespread recombination suppression (Charlesworth et al. 2005). We were unable to characterize rearrangements in the sex chromosomes of X. borealis here due to the nature of our WGS data (short reads and relatively low coverage). However, there were two crossover events detected in the sex linked region (fig. 1 and supplementary fig. S3, Supplementary Material online). As well, the level of divergence between the W and Z was lower in the last 1/3 of the sex linked region, consistent with a more recent cessation of recombination (and possibly indicating the presence of genomic regions—strata—with different levels of divergence). These results suggest that a single large scale inversion encompassing the entire sex-linked region is not a likely reason for suppressed recombination. We cannot rule out the possibility that there are smaller inversions within the sex linked region that causes recombination suppression in flanking regions. In some sex chromosome systems, inversions are not thought to be the driver of recombination suppression. For example, in the plant S. latifolia, inversions in the nonrecombining portion of the sex chromosomes may have occurred after recombination suppression evolved (Bergero et al. 2008). We did not recover any evidence of major coverage differences between the sequenced female and male X. borealis (supplementary S1.4, Supplementary Material online), suggesting a lack of deletions or insertion differences between the Z and W. However, our inference is limited by a lack of a con-specific reference genome, because unique or rapidly evolving sequences on the sex chromosomes of X. borealis may not map to the homologous portion of or be present in the X. laevis reference genome.
Alternatively, modifiers of recombination can be favored by natural selection to suppress recombination (Charlesworth et al. 2005; Coop and Przeworski 2007). These genetic factors control chiasmata formation during meiosis, possibly by modifying chromosome structure, or via the action of genes or repetitive elements (Ji et al. 1999; Otto and Lenormand 2002). Curiously, chromosome 8 S in X. borealis also had a lower recombination rate that other chromosome linkage maps of similar size (fig. 2). This chromosome is homeologous (i.e., related by genome duplication) to the sex chromosomes 8 L (Session et al. 2016). This result offers the intriguing possibility that whatever is acting to suppress recombination on the sex chromosome may also influence recombination of homeologous sequence on chromosome 8 S (genome-wide, the L and S nucleotide divergence is ∼6%; Session et al. 2016). This is unlikely to be an artifact of mapping errors because linkage groups would not form from markers that were a mix of chromosome 8 L and 8 S, because SNPs on different chromosomes should have a recombination fraction of ∼0.5 (above our threshold; Materials and Methods).
Sex-linkage with minimal divergence (similar to our observations in X. borealis) has also been found in other species. For instance, the Japan sea population of stickleback fish have a recently evolved set of sex chromosomes, which were generated by a fusion of the ancestral sex chromosome and an autosome (Kitano et al. 2009). In this system, recombination suppression spread from the point of sex chromosome fusion to an ancestral autosome along a large fraction of the neosex chromosome (Natri et al. 2013). Sex-linked genomic regions with variable levels of divergence suggest that the boundaries of recombination suppression evolve over time, and may encompass areas that are not yet diverged. As such, recombination may occasionally happen in these regions until a hard recombination boundary is established (Bergero and Charlesworth 2009). In some other amphibians, periodic recombination may prevent divergence of the sex chromosomes (Perrin 2009; Stöck et al. 2011; Dufresnes et al. 2014). Though recombination was not detected in this region for either family of X. borealis, it is possible that over long timescales the sex chromosomes of X. borealis may occasionally recombine. However, the divergence detected here between the Z and W, though modest, indicates that recombination is not happening frequently enough to completely prevent divergence (fig. 4).
The Relative Ages of the Sex Chromosomes of X. laevis and X. borealis
Our inference that recombination suppression expanded more quickly in X. borealis than X. laevis is based on (i) the inferred origin of DM-W in subgenus after the whole genome duplication event shared by all extant subgenus Xenopus species (Bewick et al. 2011) and (ii) inferred phylogenetic relationships within subgenus Xenopus (Furman and Evans 2016), which indicates that the DM-W based sex determination system is ancestral to the system of X. borealis (fig. 1). If this phylogenetic inference were erroneous and instead the sex determining system of X. borealis were ancestral to the DM-W based system of X. laevis, the rate that recombination suppression expanded over the sex chromosomes of X. borealis could be slower than it seems here.
However, there are several lines of evidence that argue against X. borealis having the older sex chromosomes than X. laevis. First, the strongest phylogenetic signal found using 1,585 genes supports a paraphyletic clade of DM-W possessing species (fig. 1; Furman and Evans 2016). More specifically, the alternate hypothesis of monophyly of DM-W-possessing species is supported by substantially fewer genes than the hypothesis of paraphyly of DM-W-possessing species with a sister relationship between DM-W-possessing Xenopus clivii and X. borealis (as presented in fig. 1; Furman and Evans 2016). In fact, the hypothesis of monophyly of DM-W-possessing species has an equal support to another paraphyletic relationship among DM-W-possessing species where X. borealis is more closely related to X. laevis than X. clivii is to X. laevis (Furman and Evans 2016).
Additional evidence against the possibility of older sex chromosomes in X. borealis is provided by divergence of orthologous autosomal genes of X. borealis and X. laevis (e.g., divergence of synonymous site of ∼14%; Chain et al. 2008) that is substantially greater than that observed between the nonrecombining regions of the X. borealis sex chromosomes (fig. 4). Likewise, homeologous coding sequences (including nonsynonymous and synonymous sites) also have higher divergence (∼7%; Evans and Kwon 2015) than the nonrecombining region of the X. borealis sex chromosomes. These genomic patterns are consistent with the proposal that suppressed recombination in the sex chromosomes of X. borealis occurred after allotetraploidization. Thus, even if previous phylogenetic inferences (Furman and Evans 2016) are incorrect, the level of divergence between these sex chromosomes still argues that the expansion of the nonrecombining region occurred after the origin of DM-W (i.e., post-whole genome duplication in subgenus Xenopus) after or at least within a similar time frame.
More Recombination in Females than Males, and in Different Genomic Regions
Heterochiasmy refers to differences in sex-specific rates of recombination. Here, in two independently derived sex chromosome systems with female heterogamy, we observed heterochiasmy with females having a higher rate of recombination than males. In some species of bird and crab with female heterogamy, recombination rates appear to be similar between the sexes (Groenen et al. 2008; Backström et al. 2010; Cui et al. 2015; Nietlisbach et al. 2015). But in some fish and other bird species the rate of recombination is higher in heterogametic females (Hansson et al. 2010; Ruan et al. 2010), or higher in homogametic males (Kawakami et al. 2014). In vertebrates with male heterogamy, the rate of recombination is often higher in females, particularly in XY mammals (Wong et al. 2010; Ottolini et al. 2015), though exceptions are known where rates are similar between the sexes, or higher in males (Mank 2009a; Johnston et al. 2016, respectively).
In several other frog species with male heterogamy, heterochiasmy has been observed with a higher recombination rate in females (Berset-Brändli et al. 2008; Brelsford et al. 2016). This was interpreted to be consistent with the Haldane–Huxely Rule (Haldane 1922; Huxley 1928) which postulates that when one sex does not recombine (i.e., when one sex is achiasmatic), that sex is the heterogametic sex (Berset-Brändli et al. 2008; Brelsford et al. 2016). Our results suggest instead that in species with heterochiasmy, the sex with lower recombination is not strongly linked to which sex is heterogametic (Lenormand and Dutheil 2005). Heterochiasmy may be more prominently influenced by haploid selection (Lenormand and Dutheil 2005), sexual antagonism (Mank 2009a), or other explanations.
The locations of recombination events were sex-biased in both species of Xenopus investigated, with recombination most frequent in the center of chromosomes in females, versus the ends of chromosomes in males (fig. 3). Sex specific differences in crossover location have been observed in other taxa, including, for example, frogs, dogs, and primates (Wong et al. 2010; Venn et al. 2014; Ottolini et al. 2015; Brelsford et al. 2016). Female linkage map length (in cM) and the number of crossover events was positively correlated with the amount of bp covered by the map and the total length of a chromosome, whereas in males this relationship was not observed (fig. 2). A similar disparity between the sexes in the relationship of cM and Mb spanned by linkage maps has been observed in the frog Hyla arborea (Brelsford et al. 2016) and in humans (Ottolini et al. 2015). This sex specific difference could be due to the differences in recombination location. In females, because recombination is spread out across the middle of chromosomes, longer chromosomes may permit more recombination events to occur without crossover interference. In males, where recombination occurs mostly on the tips of chromosomes, crossover interference is less likely to vary among chromosomes with different lengths. Similar findings have been recovered in soay sheep, where male recombination is mostly biased to the last 18 Mb of each of the chromosome tips, with chromosomes ranging in size from ∼50–200 Mb (Johnston et al. 2016), encompassing the chromosome length variation of Xenopus (Session et al. 2016). Why females and males have differences in recombination locations is potentially due to differences in meiosis. During speramtogenesis there appears to be more control over formation and number of crossover events compared with oogenesis, with crossovers stopping in the presence of errors and more often restricted to one per arm (Hunt and Hassold 2002; Hassold et al. 2004; Coop and Przeworski 2007). As well, maintenance of favorable allelic combination by haploid selection, which is generally stronger in males, may limit the breadth of possible crossover locations to genomic regions, such as chromosome tips, that have low gene density (Lenormand and Dutheil 2005).
One possible caveat to our conclusions on sex specific differences in recombination rate is that in some cases maternal and paternal linkage groups spanned nonoverlapping genomic regions, which themselves may vary in the local rate of recombination (Groenen et al. 2008; Kawakami et al. 2014; Ottolini et al. 2015). Since male recombination rate is biased toward tips of chromosomes (fig. 3), it is possible that crossover events were not accounted for in these linkage maps if tags do not span to the ends of chromosomes. Kawakami et al. (2014) also noted that RAD based studies in birds may also underestimate linkage map lengths, because they under-represent underrepresent microchromosomes and ends of chromosomes. In this study, the disparity between female and male linkage map lengths in X. laevis (1.2:1 ratio of map length) is much less than X. borealis (4.4:1). The total map lengths in X. laevis (females: 1,572 cM and males: 1,275 cM) was not far from a total map length of 1,800 cM, which is the expected length if there were an obligate rate of one crossover per chromosome arm. This suggests our estimate of recombination in X. laevis is not unreasonably low. As well, the female to male map length ratio in X. laevis of 1.2:1 is within the range of a wide variety of other species (1.4:1 for a fish, Ruan et al. 2010; 1.2:1 for a mammal, Wong et al. 2010; 1.1:1 for a bird, Kawakami et al. 2014). Thus, the sex specific differences detected in X. laevis are likely genuine. We note that the magnitude of the sex difference in recombination rate for X. borealis (females: 719 cM and males: 165 cM) may be exaggerated due to lower genomic coverage in the X. borealis family (though large differences in recombination between closely related species is known Kawakami et al. 2014). Furthermore, our linkage maps are not capturing all recombination events in either species because the per gamete rates of recombination are much less than the expectation of one event per chromosome of 18 (Results). As such, caution should be used when interpreting linkage maps from reduced genome sequencing technologies (e.g., RADseq, GBS), especially when a closely related reference genome is lacking to assess marker distribution across chromosomes.
Drivers of Sex Chromosome Evolution and Stasis
Information from a diversity of organisms suggest that the age of sex chromosomes is not a strong predictor of the amount divergence between sex chromosomes within a species (Wright et al. 2016). Our findings from the sex chromosomes of X. borealis and X. laevis support this inference. One possible explanation for these observations is that the genomic context in which a new sex chromosome system is established plays a large role in determining the extent of divergence a newly established will experience. For example, the ability to cope with dosage imbalances or the potential for dosage compensation mechanisms to evolve could strongly influence whether sex chromosomes become heteromorphic or not (Batada and Hurst 2007, but see Mank 2009b). If, for instance, the sex chromosomes of X. laevis (chromosome 2 L), contains more dosage sensitive genes than the sex chromosomes of X. borealis (chromosome 8 L), this could hinder the expansion of recombination suppression in X. laevis but not X. borealis. In ratites, for example, an inability to accommodate dosage imbalances may prevent sex chromosome divergence beyond the limited regions thought to no longer recombine (Adolfsson and Ellegren 2013; Vicoso et al. 2013; Yazdi and Ellegren 2014). As well, the life history or ecological context of a population can influence the fate of sex chromosomes. Guppies, which similar to X. borealis have a large sex linked region without extensive degeneration, show variability in the extent of sex linkage on the chromosomes depending on an interplay between the strength of sexual antagonism and predation pressures in the population (Wright et al. 2017). A compelling direction for further inquiry is to explore factors that govern sex chromosome divergence and stasis in African clawed frogs, including the role of natural selection (e.g., favoring balanced gene dosage between the sexes, sexually antagonistic selection, haploid selection; Rice 1994; Lenormand 2003; Adolfsson and Ellegren 2013), and nonselective events (e.g., recombination in sex reversed individuals; Perrin 2009, or large scale inversions).
Supplementary Material
Supplementary data are available at Genome Biology and Evolution online.
Supplementary Material
Acknowledgments
We thank Brian Golding for providing computational resources. We also thank Natural Sciences and Engineering Research Council (NSERC) for funding support (CGSD3-475567-2015 to B.L.S.F.; RGPIN/283102-2012 and RGPIN-2017-05770 to B.J.E.).
Literature Cited
- Adolfsson S, Ellegren H.. 2013. Lack of dosage compensation accompanies the arrested stage of sex chromosome evolution in ostriches. Mol Biol Evol. 30(4):806–810. [DOI] [PMC free article] [PubMed] [Google Scholar]
- Amster G, Sella G.. 2016. Life history effects on the molecular clock of autosomes and sex chromosomes. Proc Natl Acad Sci U S A. 113(6):1588–1593. [DOI] [PMC free article] [PubMed] [Google Scholar]
- Bachtrog D. 2013. Y chromosome evolution: emerging insights into processes of y chromosome degeneration. Nat Rev Genet. 14(2):113.. [DOI] [PMC free article] [PubMed] [Google Scholar]
- Bachtrog D, Charlesworth B.. 2002. Reduced adaptation of a non-recombining neo-y chromosome. Nature 416(6878):323–326. [DOI] [PubMed] [Google Scholar]
- Backström N, et al. 2010. The recombination landscape of the zebra finch Taeniopygia guttata genome. Genome Res. 20(4):485–495. [DOI] [PMC free article] [PubMed] [Google Scholar]
- Baird NA, et al. 2008. Rapid SNP discovery and genetic mapping using sequenced rad markers. PLoS One 3(10):e3376.. [DOI] [PMC free article] [PubMed] [Google Scholar]
- Batada NN, Hurst LD.. 2007. Evolution of chromosome organization driven by selection for reduced gene expression noise. Nat Genet. 39(8):945–949. [DOI] [PubMed] [Google Scholar]
- Bates D, Mächler M, Bolker B, Walker S.. 2015. Fitting linear mixed-effects models using lme4. J Stat Softw. 67(1):1–48. [Google Scholar]
- Bergero R, Charlesworth D.. 2009. The evolution of restricted recombination in sex chromosomes. Trends Ecol Evol. 24(2):94–102. [DOI] [PubMed] [Google Scholar]
- Bergero R, Charlesworth D, Filatov DA, Moore RC.. 2008. Defining regions and rearrangements of the Silene latifolia y chromosome. Genetics 178(4):2045–2053. [DOI] [PMC free article] [PubMed] [Google Scholar]
- Bergero R, Forrest A, Kamau E, Charlesworth D.. 2007. Evolutionary strata on the X chromosomes of the dioecious plant Silene latifolia: evidence from new sex-linked genes. Genetics 175(4):1945–1954. [DOI] [PMC free article] [PubMed] [Google Scholar]
- Berset-Brändli L, Jaquiéry J, Broquet T, Ulrich Y, Perrin N.. 2008. Extreme heterochiasmy and nascent sex chromosomes in european tree frogs. Proc R Soc Lond B Biol Sci. 275(1642):1577–1585. [DOI] [PMC free article] [PubMed] [Google Scholar]
- Bewick AJ, Anderson DW, Evans BJ.. 2011. Evolution of hte closely related, sex-related genes DM-W and dmrt1 in african clawed frogs (Xenopus). Evolution 65(3):698–712. [DOI] [PubMed] [Google Scholar]
- Brelsford A, Dufresnes C, Perrin N.. 2016. High-density sex-specific linkage maps of a european tree frog (Hyla arborea) identify the sex chromosome without information on offspring sex. Heredity 116(2):177–181. [DOI] [PMC free article] [PubMed] [Google Scholar]
- Chain FJ, Ilieva D, Evans BJ.. 2008. Duplicate gene evolution and expression in the wake of vertebrate allopolyploidization. BMC Evol Biol. 8(1):43.. [DOI] [PMC free article] [PubMed] [Google Scholar]
- Charlesworth B. 2009. Fundamental concepts in genetics: effective population size and patterns of molecular evolution and variation. Nat Rev Genet. 10(3):195.. [DOI] [PubMed] [Google Scholar]
- Charlesworth B. 1991. The evolution of sex chromosomes. Science 251(4997):1030–1033. [DOI] [PubMed] [Google Scholar]
- Charlesworth B, Charlesworth D.. 2000. The degeneration of y chromosomes. Philos Trans R Soc Lond B Biol Sci. 355(1403):1563–1572. [DOI] [PMC free article] [PubMed] [Google Scholar]
- Charlesworth D, Charlesworth B, Marais G.. 2005. Steps in the evolution of heteromorphic sex chromosomes. Heredity 95(2):118–128. [DOI] [PubMed] [Google Scholar]
- Coop G, Przeworski M.. 2007. An evolutionary view of human recombination. Nat Rev Genet. 8(1):23–34. [DOI] [PubMed] [Google Scholar]
- Cui Z, et al. 2015. High-density linkage mapping aided by transcriptomics documents ZW sex determination system in the chinese mitten crab Eriocheir sinensis. Heredity 115(3):206. [DOI] [PMC free article] [PubMed] [Google Scholar]
- Dufresnes C, et al. 2014. Sex-chromosome differentiation parallels postglacial range expansion in european tree frogs (hyla arborea). Evolution 68(12):3445–3456. [DOI] [PubMed] [Google Scholar]
- Elshire RJ, et al. 2011. A robust, simple genotyping-by-sequencing (GBS) approach for high diversity species. PLoS One 6(5):e19379.. [DOI] [PMC free article] [PubMed] [Google Scholar]
- Evans BJ, et al. 2015. Genetics, morphology, advertisement calls, and historical records distinguish six new polyploid species of african clawed frog (Xenopus, pipidae) from west and central africa. PLoS One 10(12):e0142823. [DOI] [PMC free article] [PubMed] [Google Scholar]
- Evans BJ, Kwon T.. 2015. Molecular polymorphism and divergence of duplicated genes in tetraploid african clawed frogs (Xenopus). Cytogenet Genome Res. 145(3–4):243–252. [DOI] [PubMed] [Google Scholar]
- Furman BLS, Evans BJ.. 2016. Sequential turnovers of sex chromosomes in african clawed frogs (Xenopus) suggest some genomic regions are good at sex determination. G3 (Bethesda) 6(11):3625–3633. [DOI] [PMC free article] [PubMed] [Google Scholar]
- Goudet J, Raymond M, de Meeüs T, Rousset F.. 1996. Testing differentiation in diploid populations. Genetics 144(4):1933–1940. [DOI] [PMC free article] [PubMed] [Google Scholar]
- Graves JAM. 2006. Sex chromosome specialization and degeneration in mammals. Cell 124(5):901–914. [DOI] [PubMed] [Google Scholar]
- Groenen MA, et al. 2008. A high-density snp-based linkage map of the chicken genome reveals sequence features correlated with recombination rate. Genome Res. 19(3):510–519. [DOI] [PMC free article] [PubMed] [Google Scholar]
- Hackett C, Broadfoot L.. 2003. Effects of genotyping errors, missing values and segregation distortion in molecular marker data on the construction of linkage maps. Heredity 90(1):33.. [DOI] [PubMed] [Google Scholar]
- Haldane JB. 1922. Sex ratio and unisexual sterility in hybrid animals. J Genet. 12(2):101–109. [Google Scholar]
- Hansson B, et al. 2010. Avian genome evolution: insights from a linkage map of the blue tit (Cyanistes caeruleus). Heredity 104(1):67.. [DOI] [PubMed] [Google Scholar]
- Hassold T, et al. 2004. Cytological studies of meiotic recombination in human males. Cytogenet Genome Res. 107(3–4):249–255. [DOI] [PubMed] [Google Scholar]
- Hunt PA, Hassold TJ.. 2002. Sex matters in meiosis. Science 296(5576):2181–2183. [DOI] [PubMed] [Google Scholar]
- Huxley J. 1928. Sexual difference of linkage in Gammarus chevreuxi. J Genet. 20(2):145–156. [Google Scholar]
- Ji Y, Stelly DM, De Donato M, Goodman MM, Williams CG.. 1999. A candidate recombination modifier gene for Zea mays l. Genetics 151(2):821–830. [DOI] [PMC free article] [PubMed] [Google Scholar]
- Johnston SE, Bérénos C, Slate J, Pemberton JM.. 2016. Conserved genetic architecture underlying individual recombination rate variation in a wild population of soay sheep (Ovis aries). Genetics 203(1):583–598. [DOI] [PMC free article] [PubMed] [Google Scholar]
- Kamiya T, et al. 2012. A trans-species missense snp in Amhr2 is associated with sex determination in the tiger pufferfish, Takifugu rubripes (fugu). PLoS Genet. 8(7):e1002798. [DOI] [PMC free article] [PubMed] [Google Scholar]
- Kawakami T, et al. 2014. A high-density linkage map enables a second-generation collared flycatcher genome assembly and reveals the patterns of avian recombination rate variation and chromosomal evolution. Mol Ecol. 23(16):4035–4058. [DOI] [PMC free article] [PubMed] [Google Scholar]
- Kitano J, et al. 2009. A role for a neo-sex chromosome in Stickleback speciation. Nature 461(7267):1079–1083. [DOI] [PMC free article] [PubMed] [Google Scholar]
- Kosambi D. 1943. The estimation of map distances from recombination values. Ann Hum Genet. 12(1):172–175. [Google Scholar]
- Lenormand T. 2003. The evolution of sex dimorphism in recombination. Genetics 163(2):811–822. [DOI] [PMC free article] [PubMed] [Google Scholar]
- Lenormand T, Dutheil J.. 2005. Recombination difference between sexes: a role for haploid selection. PLoS Biol. 3(3):e63.. [DOI] [PMC free article] [PubMed] [Google Scholar]
- Makova KD, Li WH.. 2002. Strong male-driven evolution of DNA sequences in humans and apes. Nature 416(6881):624–626. [DOI] [PubMed] [Google Scholar]
- Mank JE. 2009a. The evolution of heterochiasmy: the role of sexual selection and sperm competition in determining sex-specific recombination rates in eutherian mammals. Genet Res. 91(5):355–363. [DOI] [PubMed] [Google Scholar]
- Mank JE. 2009b. The W, X, Y and Z of sex-chromosome dosage compensation. Trends Genet. 25(5):226–233. [DOI] [PMC free article] [PubMed] [Google Scholar]
- Margarido GRA, de Souza AP, Garcia AAF.. 2007. Onemap: software for genetic mapping in outcrossing species. Hereditas 144(3):78–79. [DOI] [PubMed] [Google Scholar]
- Matsuda Y, Uno Y, Kondo M, Gilchrist MJ, Zorn AM, Rokhsar DS, Schmid M, Taira M.. 2015. A new nomenclature of Xenopus laevis chromosomes based on the phylogenetic relationship to Silurana/Xenopus tropicalis. Cytogenet Genome Res. 145(3–4):187–191. [DOI] [PubMed] [Google Scholar]
- Mawaribuchi S, et al. 2017. Sex chromosome differentiation and the W-and Z-specific loci in Xenopus laevis. Dev Biol. 426(2):393–400. [DOI] [PubMed] [Google Scholar]
- Natri HM, Shikano T, Merilä J.. 2013. Progressive recombination suppression and differentiation in recently evolved neo-sex chromosomes. Mol Biol Evol. 30(5):1131–1144. [DOI] [PMC free article] [PubMed] [Google Scholar]
- Nietlisbach P, et al. 2015. A microsatellite-based linkage map for song sparrows (Melospiza melodia). Mol Ecol Resourc. 15(6):1486–1496. [DOI] [PubMed] [Google Scholar]
- Olmstead AW, Lindberg-Livingston A, Degitz SJ.. 2010. Genotyping sex in the amphibian, Xenopus (Silurana) tropicalis, for endocrine disruptor bioassays. Aquat Toxicol. 98(1):60–66. [DOI] [PubMed] [Google Scholar]
- Otto SP, Lenormand T.. 2002. Resolving the paradox of sex and recombination. Nat Rev Genet. 3(4):252.. [DOI] [PubMed] [Google Scholar]
- Ottolini CS, et al. 2015. Genome-wide maps of recombination and chromosome segregation in human oocytes and embryos show selection for maternal recombination rates. Nat Genet. 47(7):727–735. [DOI] [PMC free article] [PubMed] [Google Scholar]
- Perrin N. 2009. Sex reversal: a fountain of youth for sex chromosomes? Evolution 63(12):3043–3049. [DOI] [PubMed] [Google Scholar]
- R Core Team. 2016. R: a language and environment for statistical computing. Vienna (Austria: ): R Foundation for Statistical Computing. [Google Scholar]
- Rice WR. 1987. The accumulation of sexually antagonistic genes as a selective agent promoting the evolution of reduced recombination between primitive sex chromosomes. Evolution 41(4):911–914. [DOI] [PubMed] [Google Scholar]
- Rice WR. 1994. Degeneration of a nonrecombining chromosome. Science 263(5144):230–231. [DOI] [PubMed] [Google Scholar]
- Roco ÁS, Olmstead AW, Degitz SJ, Amano T, Zimmerman LB, Bullejos M.. 2015. Coexistence of Y, W, and Z sex chromosomes in Xenopus tropicalis. Proc Natl Acad Sci U S A. 112(34):E4752–E4761. [DOI] [PMC free article] [PubMed] [Google Scholar]
- Ruan X, Wang W, Kong J, Yu F, Huang X.. 2010. Genetic linkage mapping of turbot (Scophthalmus maximus L.) using microsatellite markers and its application in qtl analysis. Aquaculture 308(3):89–100. [Google Scholar]
- Session AM, et al. 2016. Genome evolution in the allotetraploid frog Xenopus laevis. Nature 538(7625):336–343. [DOI] [PMC free article] [PubMed] [Google Scholar]
- Shen JJ, Dushoff J, Bewick AJ, Chain FJ, Evans BJ.. 2013. Genomic dynamics of transposable elements in the western clawed frog (Silurana tropicalis). Genome Biol Evol. 5(5):998–1009. [DOI] [PMC free article] [PubMed] [Google Scholar]
- Stöck M, et al. 2011. Ever-young sex chromosomes in european tree frogs. PLoS Biol. 9(5):e1001062.. [DOI] [PMC free article] [PubMed] [Google Scholar]
- Stöck M, et al. 2013. Low rates of X-Y recombination, not turnovers, account for homomorphic sex chromosomes in several diploid species of palearctic green toads (Bufo viridis subgroup). J Evol Biol. 26(3):674–682. [DOI] [PubMed] [Google Scholar]
- Tymowska J. 1991. Polyploidy and cytogenetic variation in frogs of the genus Xenopus In: Green DM, Sessions SK, editors. Amphibian cytogenetics and evolution. San Diego (CA: ): Academic Press; p. 259–297. [Google Scholar]
- Tymowska J, Fischberg M.. 1973. Chromosome complements of the genus Xenopus. Chromosoma 44(3):335–342. [DOI] [PubMed] [Google Scholar]
- Venn O, et al. 2014. Strong male bias drives germline mutation in chimpanzees. Science 344(6189):1272–1275. [DOI] [PMC free article] [PubMed] [Google Scholar]
- Vicoso B, Kaiser VB, Bachtrog D.. 2013. Sex-biased gene expression at homomorphic sex chromosomes in emus and its implication for sex chromosome evolution. Proc Natl Acad Sci U S A. 110(16):6453–6458. [DOI] [PMC free article] [PubMed] [Google Scholar]
- Wong AK, et al. 2010. A comprehensive linkage map of the dog genome. Genetics 184(2):595–605. [DOI] [PMC free article] [PubMed] [Google Scholar]
- Wright AE, Dean R, Zimmer F, Mank JE.. 2016. How to make a sex chromosome. Nat Commun. 7:12087.. [DOI] [PMC free article] [PubMed] [Google Scholar]
- Wright AE, et al. 2017. Convergent recombination suppression suggests role of sexual selection in guppy sex chromosome formation. Nat Commun. 8:14251.. [DOI] [PMC free article] [PubMed] [Google Scholar]
- Wu R, Ma CX, Painter I, Zeng ZB.. 2002. Simultaneous maximum likelihood estimation of linkage and linkage phases in outcrossing species. Theor Popul Biol. 61(3):349–363. [DOI] [PubMed] [Google Scholar]
- Yazdi HP, Ellegren H.. 2014. Old but not (so) degenerated–slow evolution of largely homomorphic sex chromosomes in ratites. Mol Biol Evol. 31(6):1444–1453. [DOI] [PubMed] [Google Scholar]
- Yoshimoto S, et al. 2008. A w-linked dm-domain gene, dm-w, participates in primary ovary development in Xenopus laevis. Proc Natl Acad Sci U S A. 105(7):2469–2474. [DOI] [PMC free article] [PubMed] [Google Scholar]
- Zhou Q, et al. 2014. Complex evolutionary trajectories of sex chromosomes across bird taxa. Science 346(6215):1246338. [DOI] [PMC free article] [PubMed] [Google Scholar]
- Zickler D, Kleckner N.. 2016. A few of our favorite things: pairing, the bouquet, crossover interference and evolution of meiosis In: Seminars in cell and developmental biology. Vol. 54 Elsevier; p. 135–148. [DOI] [PMC free article] [PubMed] [Google Scholar]
Associated Data
This section collects any data citations, data availability statements, or supplementary materials included in this article.