

Abstract
Background
Air particulate matter (PM) is a ubiquitous environmental exposure associated with oxidation, inflammation, and age-related chronic disease. Whether PM is associated with loss of bone mineral density (BMD) and risk of bone fractures is undetermined.
Methods
We conducted two complementary studies of: (i) long-term PM <2.5 μm (PM2.5) levels and osteoporosis-related fracture hospital admissions among 9.2 million Medicare enrollees of the Northeast/Mid-Atlantic United States between 2003–2010; (ii) long-term black carbon [BC] and PM2.5 levels, serum calcium homeostasis biomarkers (parathyroid hormone, calcium, and 25-hydroxyvitamin D), and annualized BMD reduction over a 8-year follow-up of 692 middle-aged (46.7±12.3 yrs), low-income BACH/Bone cohort participants.
Findings
In the Medicare analysis, risk of bone fracture admissions at osteoporosis-related sites was greater in areas with higher PM2.5 levels (Risk ratio [RR] 1.041, 95% Confidence Interval [CI], 1.030, 1.051). This risk was particularly high among low-income communities (RR 1.076; 95% CI, 1.052, 1.100). In the longitudinal BACH/Bone study, baseline BC and PM2.5 levels were associated with lower serum PTH (Estimate for baseline one interquartile increase in 1-year average BC= −1.16, 95% CI −1.93, −0.38; Estimate for baseline one interquartile increase in 1-year average PM2.5= −7.39; 95%CI −14.17, −0.61). BC level was associated with higher BMD loss over time at multiple anatomical sites, including femoral neck (−0.08%/year per one interquartile increase; 95% CI −0.14, −0.02%/year) and ultradistal radius (−0.06%/year per one interquartile increase; 95% CI −0.12, −0.01%/year).
Interpretation
Our results suggest that poor air quality is a modifiable risk factor for bone fractures and osteoporosis, especially in low-income communities.
INTRODUCTION
In the U.S., ~2.1 million osteoporosis-related bone fractures are reported each year, resulting in as much as $20.3 billion in annual direct health costs.1 Within a year of a bone fracture, death risks for older individuals increase by 10%–20%2 with only 40% regaining full pre-fracture independence.1,3 Identification of novel, preventable risk factors for bone loss and fractures is an urgent global priority.4,5
Ambient levels of particulate matter (PM) air pollution have been associated with increased morbidity, hospitalization, and mortality from cardiovascular6–8 and respiratory diseases,9,10 as well as with cancer11,12 and impaired cognition.13–15 PM causes systemic oxidative damage16 and inflammation,17 which may result in accelerated bone loss and increased risk of bone fractures in older individuals. Tobacco smoke, which contains several toxic components also found in PM, has been repeatedly associated with decreased bone mineral density (BMD)18 and increased risk of bone fractures.19 However, evidence on whether individuals living in areas with higher PM levels have higher risk of bone fractures is inconclusive. To date, no longitudinal study has investigated ambient PM in relation to bone mineral loss over time, and there is no available data on PM and calcium homeostasis in adults.
To determine the relationship between ambient PM levels and bone health, we conducted two independent studies with complementary designs, objectives, and measures: (i) using data on 763,630 hospital admissions from 9.2 million Medicare enrollees in the Northeast/Mid-Atlantic U.S. from 2003 to 2010, we determined whether communities with higher levels of PM <2.5 μm in aerodynamic diameter (PM2.5) had higher rates of hospital admissions for osteoporosis-related bone fractures among older persons (>65 yrs old); (ii) in a longitudinal study of 692 middle-aged (mean age=47.5 years), low-income men from the Boston Area Community Health/Bone Survey cohort (BACH/Bone Study), we determined whether PM2.5 levels and traffic-derived ambient PM—as traced through ambient levels of black carbon (BC)—were associated with altered markers of calcium homeostasis, including serum parathyroid hormone (PTH), 25-hydroxyvitamin D, and calcium, as well as changes in BMD over an ~8-year follow-up.
METHODS
Medicare analysis: PM and hospital admissions for fractures
Medicare data
We obtained 2003–2010 hospital admission data for osteoporosis-related bone fractures from ~9.2 million beneficiaries of Medicare, ≥65 years old, who lived in 3,974 zip codes of 13 Northeast/Mid-Atlantic U.S. states located east of the 81° W meridian, for which we recently developed a high-resolution hybrid model for estimating PM2.5 levels (Figure 1).20 We identified primary hospital admissions for osteoporotic-related fractures using the International Classification of Diseases, 9th revision (ICD-9) (see Supplementary Table 1) and compiled data on number of admissions per year per zip code. Covariate data at the zip code levels were collected from various sources and were presented in its original unit to ensure accuracy. Medicare data are previously collected administrative data and, therefore, did not require individual patient consent.
Figure 1. Population and levels of fine air particulate pollution in the Northeast/Mid-Atlantic United States.
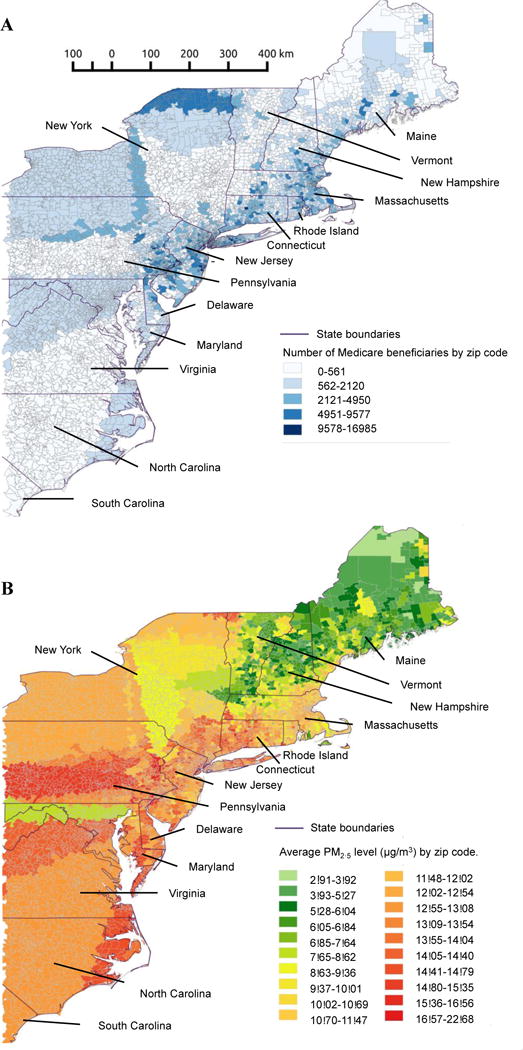
Panel A: Medicare population by zip code.
Panel B: Average PM2.5 levels per zip code between 2003–2010.
Particulate matter data
Annual PM2.5 levels between 2003–2010 were estimated using a recently developed and validated (mean out-of-sample R2=0.88) spatio-temporal prediction model that incorporates satellite Aerosol Optical Depth data, spatial smoothing and local predictors.21 We generated daily PM2.5 predictions at 1×1 km spatial resolution, as previously described20 and calculated 1-year averages of PM2.5 levels specific to each zip code for each calendar year. The exposure dataset with yearly averages of PM2.5 concentrations at a 1×1 km spatial resolution was matched to zipcodes using ArcGIS and SAS based on spatial location and date. For zip codes that covered several grids, a weighted exposure average was calculated for each zipcode based on all covered 1×1 km grid cells.
Statistical methods
We estimated the association of 1-year PM2.5 average with annual rates of bone fracture hospital admissions using generalized linear mixed models (PROC GLIMMIX, SAS Institute, Cary, NC) with Poisson distribution and random intercepts for zip code. We considered the Akaike information criterion (AIC) and residuals’ plots to evaluate goodness-of-fit. We adjusted the final model for the multiple zip code-level confounders described in Supplementary Table 2. We used Medicare data on age that provides per each zip code the percent of the population between 65 to 74 years old and the percent >75 years. We also adjusted for number of days below 0°C to minimize the potential impact of fall risk due to freezing weather. Urban and rural areas were classified according to the Rural-Urban commuting area from the U.S. Department of Agriculture, which classify U.S. census tracts using measures of population density, urbanization and daily commuting. In separate models, we tested interaction terms between zip-code characteristics and PM2.5 levels. Findings at p<0.05 were considered significant.
BACH/Bone Study: Air pollution, BMD, and calcium homeostasis
Study participants, sociodemographic, physical and diet information
The BACH/Bone Study is a population-based longitudinal study of musculoskeletal health, including 1,219 low-income black, Hispanic, and white male residents of Greater Boston, MA, aged 30–79 years.22 Data were collected at baseline (November 2002–July 2005) and follow-up (June 2010–October 2012) examinations from a total of 692 participants, who completed followup assessments. Physical activity level was measured using the Physical Activity for the Elderly (PASE) scale.23 Frequency and duration of leisure activities, work (hours/week), and housework and similar duties (yes/no) over the previous week were recorded for each subject. The PASE score was computed by multiplying the amount of time spent in each activity (hours/week) in each activity by empirical item weights and summing over all activities. PASE measurements were categorized as Low (0–99), Middle (100–249), and High (250+). Measurements of subjects’ height and weight were obtained using a stadiometer (Seca Corp., Hanover, MD) and digital scale (Tanita, Arlington Heights, IL), respectively. Body mass index (BMI) was calculated from by dividing measured weight (kg) by the square of measured height (m2). Information about dietary habits was obtained by survey in participants’ homes using the diet with Block food frequency questionnaire.24 Smoking was determined using data from in-person interviews; the questionnaires assessed whether men had smoked at least 100 cigarettes in their lifetime and whether they were currently smoking. Smoking status was defined as current smoker (smoked > 100 cigarettes and currently a smoker), never smokers (smoked < 100 cigarettes lifetime and not currently smoking), or former smokers (smoked > 100 cigarettes lifetime and currently not smoking). In case of former and current smokers, questions were administered to determine the usual number of cigarettes smoked per day and for how many years they had smoked; then, pack-years of smoking were calculated by multiplying the number of packs (20 cigarettes in one pack) smoked per day by the number of years smoked. Additional information about the BACH/Bone cohort has been published previously.22,25 The Institutional Review Boards at the New England Research Institute and Boston University School of Medicine (BUSM) approved protocols. Each participant provided written informed consent.
Air particle data
To estimate PM2.5 levels, we used the same spatiotemporal hybrid modeling approach20 described above for the Medicare analysis, but using a 1×1 km model instead of zip code areas, which allowed us more precise data about exposure.20 Due to the unavailability 1×1 km of satellite data before 2003, PM2.5 predictions could be obtained—as annual average—only for participants with baseline visits in 2004–2005 (i.e., only 282 of the total 692 participants). We obtained finer-scale and more complete (n=692) estimates of particle levels by calculating levels of BC—a measure of PM from vehicular traffic emissions and the dominant type of PM in urban areas—using a validated spatiotemporal land-use regression model that provided daily estimates of BC concentrations throughout the greater Boston area since 1995, as previously reported.26 To capture large local variability of vehicular traffic particles, the BC model generated estimates for each individual address rather than for grid cells. We calculated 1-year averages of PM2.5 and BC at baseline using 365 daily estimates for each participant using their residential address before the date of their baseline BMD assessment.
Phenotype measures
Examinations, including in-person interviews, questionnaires, anthropometries, and blood draws were conducted at the BUSM-General Clinical Research Unit. We measured serum bio-intact parathyroid hormone (PTH), serum calcium at baseline, and serum 25-hydroxyvitamin D [25(OH)D, i.e., 25(OH)D2 + 25(OH)D3], as previously described.27 Trained and certified technicians measured BMD at both baseline and follow-up at five different locations (femoral neck, total hip, lumbar spine [L1–L4], distal radius, ultradistal radius) with dual–energy X-ray absorptiometry (DXA) using a Hologic/QDR4500W densitometer (Hologic Inc., Waltham, MA). To facilitate study operations, and in consideration of the 6-year lag between the baseline and follow up measure, we did not require the same technician to perform the two BMD scans on each subject. However, all technicians were specifically trained and certified to use standardized procedures to reduce between-operator variability. Unfortunately, no measures of operator variability were collected. However, the total variability was very small: indeed, to reduce technical variability in BMD measurements, the DXA system was monitored weekly for drift and the coefficient of variation (CV) for BMD were less than 1.5%. We calculated annualized changes in BMD between baseline and follow-up scans, and we calculated annualized change in percentage from the difference between the first and last BMD measurement.
Statistical analysis
We used linear regression to estimate the association of long-term PM2.5 and BC levels (1-year average PM2.5 and BC levels before BMD measurement) with baseline PTH, calcium levels, and serum 25(OH)D. We used three sets of models: unadjusted; adjusted for age, race, and height; and adjusted for age, race, height, smoking, per-capita household income, physical activity, caffeine consumption, and weight. We used similar sets of linear regression models to evaluate the association of baseline PM2.5 and BC levels (1-year average) with change in BMD between baseline and ~8-year examinations.28 We rescaled the effect estimate to percent change to facilitate result comparison with previous studies.29,30 SUDAAN software (RTI International, Research Triangle Park, NC) was used for all analyses. Observations were weighted inversely to their probability of selection at baseline. Weights were also adjusted for non-response bias at the follow-up assessment and post-stratified to the Boston census population in 2000 (see Supplementary Table 3). The Multivariate Imputation by Chained Equations (MICE) algorithm in R was used to impute missing data,31 taking into account the complex survey sampling design and maintaining the observed relationships in the data. MICE imputes missing values with estimated predictions from regression models and fifteen datasets were multiply imputed and used for analysis.32,33 Imputed missing data was less than 5% per variable. Findings at p<0.05 were considered significant.
Role of the funding source
The sponsors of the study had no role in the study design, data collection, data analysis, data interpretation, or writing of the manuscript. The corresponding authors had full access to all the data in the study and had final responsibility for the decision to submit for publication.
RESULTS
Medicare analysis
PM2.5 levels and rates of hospital admissions for bone fractures
The area included in the analysis had a total population of 62 million, of which ~9.2 million (~15%) were Medicare beneficiaries. Characteristics of zip code areas are shown in Supplementary Table 4. From 2003–2010, 763,630 Medicare beneficiaries were admitted with a primary diagnosis of osteoporosis-related bone fracture. Communities with higher annual PM2.5 levels had higher rates of bone fracture admissions in analyses controlling for relevant covariates. An interquartile-range (4.18 μg/m3) increase in PM2.5 was associated with a 4.1 % (risk ratio [RR]=1.041; 95% CI, 1.030 to 1.051; p<0.001) higher rate of hospital admission for bone fracture (Table 1) in models adjusted for socio-demographic variables, geographic characteristics, obesity, number of days with freezing temperatures (<0 °C), and calendar year. A plot of the corresponding partial residuals obtained from a model controlling for all covariates except PM2.5 demonstrated a subtle, near-linear covariate-adjusted association between PM2.5 and rates of bone fracture admissions (Figure 2). The plot also illustrated that there remained substantial variability in bone fracture admission rates. Using a regression spline to fit PM2.5 level in the multivariable-adjusted regression model, we confirmed that the relationship between PM2.5 and rates of bone fractures was nearly linear across the entire range of PM2.5 levels (3–22 μg/m3) (Figure 2). The associations of PM2.5 with bone fractures were robust and stable across six alternative regression models including different sets of covariates (Supplementary Table 5). Relative risks were similar between females (RR=1.046; 95% CI, 1.036 to 1.056; p=<0.001) and males (RR=1.037; 95% CI, 1.027 to 1.047; p<0.001) (Table 1). The association of PM2.5 with bone fracture admission rates was higher among those communities in the lowest obesity rate quartile (RR=1.105; 95% CI, 1.080 to 1.129; p< 0.001) compared to those with highest obesity rates (RR=1.038; 95% CI, 0.763 to 1.312; p= 0.13; p-for-interaction 0.011). The effect modification by socioeconomic variables (percentage of population with high school level per zip code and median income per zip code), percentage of population white non-Hispanic per zip code, and percentage of obesity per zip code, on the association between long-term PM2.5 and hospital admissions by bone fractures are shown in Table 2.
Table 1.
Risk of hospital admissions by osteoporotic-related* bone fractures associated with 1-year average levels of PM2.5 a,b in the Medicare analysis
| Females | Males | ||
|---|---|---|---|
| Number of Medicare beneficiaries | 9,271,035 | 5,192,340 | 4,079,695 |
| Number of hospital admissions, 2003–2010 | 763,630* | 449,105 | 314,525 |
|
| |||
| RR (95% CI) | RR (95% CI) | RR (95% CI) | |
|
|
|||
| PM2.5 | 1.041 (1.030, 1.051) | 1.046 (1.036, 1.056) | 1.037 (1.027, 1.047) |
| % white, non-Hispanic | 1.045 (1.038, 1.052) | 1.044 (1.037, 1.051) | 1.045 (1.036, 1.054) |
| % high school graduate | 1.035 (0.998, 1.072) | 1.037 (0.998, 1.076) | 1.033 (0.996, 1.070) |
| Median income | 0.998 (0.992, 1.004) | 0.997 (0.995, 0.999) | 0.996 (0.991, 1.006) |
| % obese | 0.973 (0.935, 1.011) | 0.974 (0.935, 1.013) | 0.972 (0.936, 1.008) |
| % female | 1.087 (1.047, 1.127) | – | – |
| % of population that are 75 yrs or olderc | 1.096 (1.087, 1.105) | 1.097 (1.088, 1.106) | 1.095 (1.086, 1.104) |
| Number of days below 0°C | 1.011 (1.010, 1.011) | 1.011 (1.010, 1.011) | 1.011 (1.010, 1.011) |
| Urban (vs. rural)d | 0.998 (0.925, 1.071) | 0.998 (0.928, 1.068) | 0.998 (0.925, 1.071) |
Estimated risk of hospital admissions of Medicare enrollees with a primary diagnosis of bone fracture associated with an interquartile range (4.18 μg/m3) increase in 1-year average in the levels of fine particulate matter <2.5μm (PM2.5) across 3,974 zip code areas in the U.S. North/Mid-Atlantic area in the period from 2003–2010. The adjusted estimates of each variable were presented in the table.
The regression models also included indicator variables for year of hospital admission and state of residence, in addition to all the other independent variables listed in the table.
In each zipcode, age was reported in the Medicare data as the percent of the population 65 to 74 years old and the percent 75 years or older.
Rural areas included large, small, and isolated rural categories.
RR=Risk ratio; 95% CI= Confidence Interval.
Osteoporotic related fractures include all hospital admissions with a primary diagnosis of hip, wrist, spine and pelvis fractures only.
Figure 2. Long-term exposure to PM2.5 and risk of hospital admission for bone fractures.
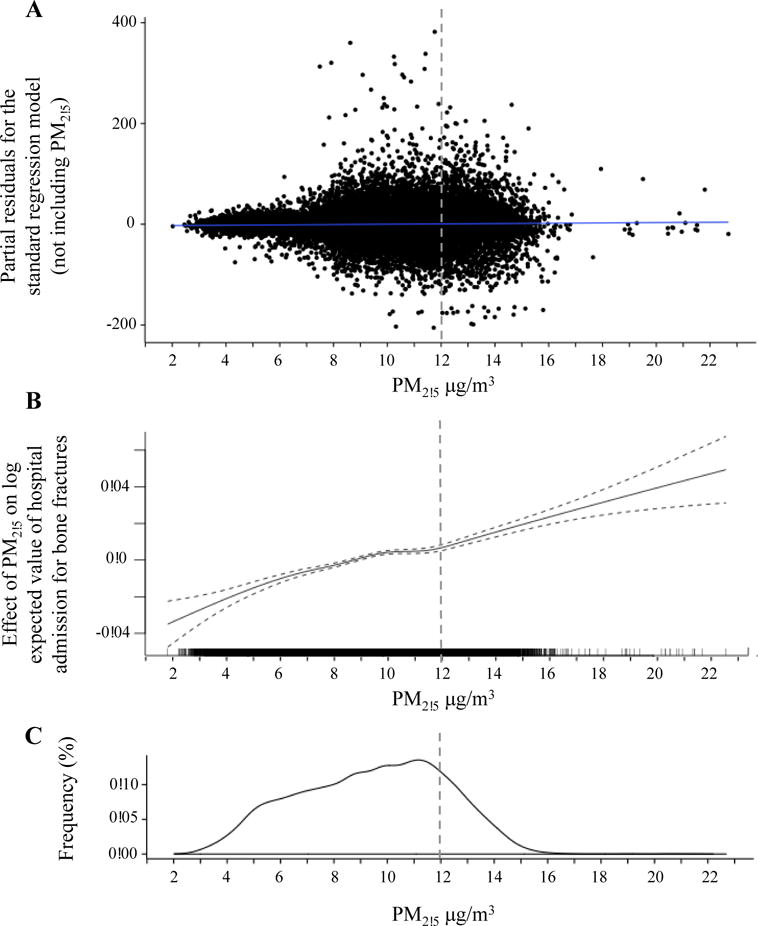
Panel A: Scatter plot of the multivariable-adjusted residuals from the standard regression model (not including PM2.5) versus level of exposure to fine particulate matter <2.5 μm (PM2.5).
Panel B: Spline for the multivariable-adjusted association between PM2.5 exposure and number of hospital admissions of Medicare enrollees per zip code, from 2003–2010.
Panel C: Density plot of exposure to PM2.5 in the Medicare analysis.
Dotted line represents the primary annual PM2.5 standard of 12 μg/m3 mandated by the U.S.
Environmental Protection Agency.
Table 2.
Risk of hospital admissions by osteoporosis-related bone fracture associated with PM2.5 levels in each quartile of socioeconomic status, race, and obesity.
| RR | 95% CI | p value for interaction | |
|---|---|---|---|
| % of population with high school level per zip codea | |||
| 1st quartile (7.31 – 25.52) | 1.046 | (1.023, 1.070) | <0.001 |
| 2nd quartile (25.53 – 32.21) | 1.097 | (1.075, 1.118) | |
| 3rd quartile (32.22 – 38.32) | 1.017 | (0.988, 1.046) | |
| 4th quartile (39.33 – 99.90) | 1.067 | (1.044, 1.091) | |
| Median income per zip codeb | |||
| 1st quartile (19.23 – 37.28k) | 1.076 | (1.052, 1.100) | <0.001 |
| 2nd quartile (37.29 – 48.65k) | 1.105 | (1.084, 1.126) | |
| 3rd quartile (48.66 – 61.83k) | 1.125 | (1.102, 1.149) | |
| 4th quartile (61.84 – 200.01k) | 0.937 | (0.906, 0.968) | |
| % of population white non-Hispanic per zip codec | |||
| 1st quartile (2.76 – 84.28) | 1.099 | (1.077, 1.121) | <0.001 |
| 2nd quartile (84.29 – 94.38) | 0.944 | (0.918, 0.971) | |
| 3rd quartile (94.39 – 97.33) | 1.102 | (1.070, 1.130) | |
| 4th quartile (97.34 – 100.00) | 1.109 | (1.089, 1.130) | |
| % of obesity per zip coded | |||
| 1st quartile (13.80 – 22.70) | 1.105 | (1.080, 1.129) | 0.011 |
| 2nd quartile (22.71 – 25.50) | 1.118 | (1.095, 1.140) | |
| 3rd quartile (25.51 – 27.80) | 0.968 | (0.698, 1.238) | |
| 4th quartile (27.81 – 35.60) | 1.038 | (0.763, 1.312) |
RR=Risk ratio; 95% CI=95% Confidence interval.
Adjusted by all variables included in Table 1, except % of population with high school level per zip code.
Adjusted by all variables included in Table 1, except Median income per zip code.
Adjusted by all variables included in Table 1, except % of population white non-Hispanic per zip code,
Adjusted by all variables included in Table 1, except % of obesity per zip code.
BACH/Bone Study
Association of PM2.5 and BC levels with markers of calcium homeostasis
Participants in the BACH/Bone Study included 30–79-year-old males, including 66.9% participants with annual household income <$30,000 and 58.9% Caucasians. We present additional characteristics of the participants at baseline, including BMD, PM2.5, and BC levels, in Table 3. Participants living in locations with higher BC levels had lower levels of serum PTH (β =−1.16; 95% CI, −1.93 to −0.38, p=0.004 in the fully adjusted model for an interquartile increase [0.106 μg/m3] in 1-year average in BC levels). PM2.5 showed also a negative association serum PTH levels (β=−7.39; 95%CI, −14.17 to −0.61, p=0.03 in the fully adjusted model for an interquartile increase [2.18 μg/m3] in 1-year average in PM2.5 levels). BC and PM2.5 were not associated with serum calcium, or serum 25(OH)D levels and results were robust across alternative regression models (Table 4).
Table 3.
Demographic, physical, and clinical characteristics at baseline in the BACH/Bone Study cohort
| Characteristic | N (%) or mean (SE) |
|---|---|
| Age | |
| <40 years | 139 (29.0%) |
| 40–49 years | 206 (31.7%) |
| 50–59 years | 183 (20.1%) |
| >60 years | 164 (19.2%) |
| Race | |
| Black | 214 (28.0%) |
| Hispanic | 204 (13.2%) |
| White | 274 (58.9%) |
| Household income | |
| <$6k | 146 (12.8%) |
| $6k–29.9k | 377 (54.1%) |
| ≥$30k | 169 (33.1%) |
| Smoking | |
| Never | 301 (47.3%) |
| Former | 196 (28.3%) |
| Current | 195 (24.4%) |
| Physical activity (PASE score) | |
| Low (0–99 units) | 191 (24.9%) |
| Middle (100–249 units) | 348 (51.2%) |
| High (>250 units) | 153 (23.9%) |
| Dietary caffeine | |
| ≤ 43.5 mg | 177 (24.7%) |
| 43.5 – 164.5 mg | 169 (25.1%) |
| 164.6 – 325.0 mg | 171 (25.1%) |
| >325.1 mg | 175 (25.0%) |
| Height (cm) | 175.64 (0.35) |
| Weight (Kg) | 88.13 (0.82) |
| Serum 25(OH)D (ng/mL) | 33.15 (0.80) |
| Parathyroid hormone (pg/mL) | 28.91 (0.63) |
| Serum calcium (mg/dL) | 9.42 (0.02) |
| PM2.5 1-year average (μg/m3)* | 11.65 (0.05) |
| BC 1-year average (μg/m3)** | 0.77 (0.01) |
| BMD at baseline (g/cm2) | |
| Femoral neck | 0.88 (0.01) |
| Ultradistal radius | 0.53 (0.004) |
| 1/3 distal radius | 0.77 (0.004) |
| Total hip | 1.03 (0.01) |
| L1–L4 | 1.05 (0.01) |
| Annualized change in BMD, baseline to follow-up (%) | |
| Femoral neck | −1.14 (0.03) |
| Ultradistal radius | −0.56 (0.04) |
| 1/3 distal radius | 0.26 (0.03) |
| Total hip | −0.29 (0.03) |
| L1–L4 | 0.10 (0.038) |
PM2.5 = fine particulate matter <2.5 μm; PASE = physical activity scale for the elderly; BC = black carbon; BMD = bone mineral density; L1–L4 = lumbar vertebrae.
Available only for 282 middle-aged, low-income males.
Available for 692 middle-aged, low-income males. ‘k’ in Median income= thousands.
Table 4.
Association of long-term PM2.5 and black carbon with calcium homeostasis biomarkers in the BACH/Bone Studya
| Unadjusted | Adjusted for age, race and height | Fully adjustedb | |
|---|---|---|---|
|
| |||
| Estimate (95% CI) | Estimate (95% CI) | Estimate (95% CI) | |
| PM2.5 | |||
| Parathyroid hormone | −5.69 (−13.73, 2.40) | −6.00 (−13.78, 1.77) | −7.39 (−14.17, −0.61) |
| Serum 25(OH)D | 4.51 (−6.13, 15.13) | 1.16 (−7.76, 10.05) | 2.90 (−6.21, 12.03) |
| Serum calcium | 0.13 (−0.09, 0.327) | 0.13 (−0.07, 0.33) | 0.13 (−0.07, 0.33) |
| BC | |||
| Parathyroid hormone | −1.29 (−2.05, −0.53) | −1.32 (−2.23, −0.42) | −1.16 (−1.93, −0.38) |
| Serum 25(OH)D | 0.63 (−0.31, 1.58) | 0.21 (−0.75, 1.17) | 0.27 (−0.69, 1.22) |
| Serum calcium | 0.01 (−0.01, 0.04) | 0.01 (−0.01, 0.04) | 0.01 (−0.01, 0.04) |
Regression coefficients for the association between one interquartile range increase in baseline PM2.5 (2.18 μg/m3, N=282) or black carbon (0.106 μg/m3, N=692, BC) 1-year average and calcium homeostasis biomarkers (parathyroid hormone, serum vitamin D, and serum calcium) in the BACH/Bone Study cohort.
Adjusted for age, race, height, weight, smoking, per-capita household income, physical activity, C-reactive protein and caffeine consumption.
PM2.5 = fine particulate matter <2.5μm. BC= black carbon. 95% CI=95% confidence interval.
Estimated Effects of Particulate Matter <2.5 μm and Black Carbon levels on Bone Mineral Density
At baseline, BMD measures of the study participants were not associated with PM2.5 or BC levels at their residential address (Table 5). During the 8-year follow-up, participants living at locations with higher levels of ambient particles, particularly BC levels, showed higher loss of BMD at multiple anatomical sites (Table 6). For each one interquartile (0.106 μg/m2) increase in 1-year BC level at baseline, participants had 0.08% per year (95% CI, −0.14 to −0.02%; p=0.009) more decrease in femoral neck BMD and 0.06% per year (95% CI, −0.12 to −0.01%; p=0.04) in ultra-distal radius BMD in fully-adjusted models, equivalent to 3,914 cases/year attributable to PM2.5. BMD also showed non-significant negative associations at one-third distal radius, total hip, and L1–L4 (Table 6). Associations remained robust across alternative regression models (Table 6) and relatively linear despite some non-influential outliers (Figure S1). In the subset of participants with available PM2.5 data (n=282), one-year average PM2.5 levels at baseline were negatively, but non-significantly, associated with changes in BMD for most anatomical sites evaluated (Table 6).
Table 5.
Estimated effects of PM2.5 and black carbon levels on bone mineral density at baseline in the BACH/Bone Studya
| Fully adjustedb | ||
|---|---|---|
|
| ||
| Anatomical site | Percent change (95% CI) | |
| PM2.5 | ||
| Femoral neck | 0.262 (−0.044, 0.094) | |
| Ultradistal radius | 0.017 (−0.050, 0.085) | |
| One-third distal radius | 0.022 (−0.052, 0.096) | |
| Total hip | 0.031 (−0.001, 0.061) | |
| L1–L4 | 0.011 (−0.020, 0.039) | |
| BC | ||
| Femoral neck | −0.001 (−0.007, 0.009) | |
| Ultradistal radius | −0.001 (−0.009, 0.008) | |
| One-third distal radius | −0.003 (−0.006, 0.011) | |
| Total hip | −0.001 (−0.003, 0.004) | |
| L1–L4 | −0.001 (−0.004, 0.004) | |
Regression coefficients for the association between baseline one interquartile range increase in PM2.5 (2.18 μg/m3, N=282) and black carbon levels (0.106 μg/m3, N=692) 1-year average and baseline bone mineral density in five anatomical sites in the BACH/Bone Study cohort (N=692).
Adjusted for age, race, height, smoking, household income, physical activity, caffeine consumption, weight, and serum 25(OH)D level.
PM2.5 = fine particulate matter <2.5 μm; BC = black carbon; 95% CI = 95% confidence interval; L1–L4 = lumbar vertebrae.
Table 6.
Annualized percent change in BMD associated with PM2.5 and black carbon exposure in the BACH/Bone Studya
| Unadjusted | Adjusted for age, race, and height | Fully adjustedb | |
|---|---|---|---|
|
| |||
| Percent change (95% CI) | Percent change (95% CI) | Percent change (95% CI) | |
| PM2.5 | |||
| Femoral neck | −0.09 (−0.44, 0.26) | −0.13 (−0.50, 0.22) | −0.13 (−0.52, 0.26) |
| Ultradistal radius | 0.22 (−0.20, 0.63) | 0.17 (−0.24, 0.59) | 0.22 (−0.20, 0.63) |
| One-third distal radius | −0.07 (−0.37, 0.22) | −0.09 (−0.37, 0.22) | −0.04 (−0.35, 0.24) |
| Total hip | −0.13 (−0.48, 0.20) | −0.17 (−0.52, 0.20) | −0.22 (−0.61, 0.17) |
| L1–L4 | −0.20 (−0.52, 0.13) | −0.17 (−0.52, 0.17) | −0.17 (−0.52, 0.15) |
| BC | |||
| Femoral neck | −0.08 (−0.14, −0.02) | −0.08 (−0.14, −0.02) | −0.08 (−0.14, −0.02) |
| Ultradistal radius | −0.06 (−0.11, 0.01) | −0.06 (−0.11, 0.01) | −0.06 (−0.12, −0.01) |
| One-third distal radius | −0.03 (−0.07, 0.01) | −0.03 (−0.07, 0.01) | −0.03 (−0.07, 0.01) |
| Total hip | −0.04 (−0.08, 0.01) | −0.04 (−0.08, 0.01) | −0.03 (−0.08, 0.01) |
| L1–L4 | −0.04 (−0.10, 0.02) | −0.05 (−0.10, 0.01) | −0.04 (−0.09, 0.01) |
Annualized percent change in bone mineral density (BMD) at five anatomical sites, from 2002–2005 to 2010–2012, associated with one interquartile range increase in PM2.5 (2.18 μg/m3, N=282) and black carbon levels (0.106 μg/m3, N=692) 1-year average exposure in the BACH/Bone Study.
Adjusted for age, race, height, weight, smoking, per-capita household income, physical activity, caffeine consumption, C-reactive protein, and serum 25(OH)D.
PM2.5 = fine particulate matter <2.5μm. BMD= Bone Mineral Density. BC= black carbon. 95% CI=95% confidence interval; L1–L4= lumbar vertebral mineral density.
DISCUSSION
In our analysis of ~9.2 million Medicare beneficiaries, we found evidence of an association between PM2.5 levels and rates of hospital admissions for bone fractures, independent of gender and community-level confounding factors. PM2.5 associations were stronger in communities with lower income, despite a protective influence of obesity rates. This result suggests that per each 4.18 μg/m3 increase in PM2.5, there is an increase in 4.1% higher rate of hospital admission for bone fractures in older individuals. In the prospective BACH/Bone Study of middle-aged, low-income males, we also found that participants living at addresses with higher levels of PM2.5 and BC exhibited lower serum PTH levels. BC was associated with decreases in BMD over an 8-year follow-up. These findings indicate poor air quality as a possible risk factor for BMD loss and fractures in older individuals, which may disproportionately affect low-income males. Reducing emissions as a result of innovation in technologies or policy changes in emission standards of this modifiable risk factor may reduce the impact of air pollution on bone fractures and osteoporosis.
Air particles may, directly or indirectly, impact bone biology and increase bone mineral loss. Air pollution particles have high potential to cause systemic oxidative damage34 and inflammation,17 both of which are established mechanisms for bone demineralization and osteoporosis.35
Tobacco smoke, which includes several chemo-physical components found in PM, causes bone mineral loss in animal experiments36 and has been associated with higher risk of bone fractures and increased bone mineral loss in human studies.19 PTH levels are also significantly lower in smokers37,38 and return to non-smoking levels after smoking cessation.38 Such PTH alteration may represent an adaptive response to smoking-induced calcium mobilization from bone.38 Our findings suggest that similar mechanisms may also be activated in response to PM. Similarities between PM and smoking may also suggest a potential role of renal calcium handling,39,40 but unfortunately, no data about renal calcium was available in the BACH/Bone cohort.
To date, very few studies have investigated the association of air pollution levels with bone health and bone fractures. A cross-sectional study of 5,976 middle-aged and older individuals living in Norway (15.23% with forearm fractures, ~910 cases) described an association of long-term PM2.5 levels with the prevalence of self-reported forearm fractures after the age of 50 years, but the association was evident only among male smokers.41 A previous study of 590 men aged 75–76 years showed a cross-sectional correlation of long-term PM2.5 and PM10 levels with lower total body BMD.42 Previous studies have also reported higher rates of bone fractures and age-related osteoporosis in urban areas compared to rural regions.43,44 For example, urban women have a 29% higher relative risk of forearm fracture and lower BMD compared to women in rural areas.45 Our Medicare analysis controlled for urban and rural locations. It is possible that our study is prone to residual confounding. However, considering the consistency between different models (Supplementary Table 5), it is unlikely the observed association of PM on hospital admissions by bone fractures reflect confounding due to lifestyle or other socioeconomically differences between urban and rural areas. We used yearly counts of admissions for each zip code area and specified a Poisson distribution. We applied generalized mixed models because we have counts for each zip code and then, we included a random intercept for zip code to take in account of the characteristics of each zip code. By using this Poisson regression, we accounted for temporal variation of counts by year and for the spatial variation with the zip code level. We did not evaluate daily time series because we were interested in the long-term effect of PM2.5. The magnitude of the relative risk we found in Medicare analysis is similar to the very well established associations between air pollution and other health outcomes (e.g. myocardial infarction, stroke, total mortality).46 Indeed, air pollution is considered a weak, but universal risk factor; therefore, it causes a proportionally higher number of attributable cases than other risk factors with higher relative risks but lower frequency.47
Several epidemiological studies have shown that socioeconomic factors, race,48,49 and obesity50–52 are related to a bone mineral density. Low socio-economic status has been associated with 25-OHD insufficiency, higher values of PTH, lower values of BMD and a higher prevalence of fragility fractures.53 Also, despite lower serum 25-hydroxyvitamin D concentrations and dietary calcium intake and, African Americans have higher BMD and develop osteoporosis less frequently than do European Americans.54 Our Medicare analysis showed a significant interaction of socioeconomic variables (education and income), but also of race and obesity, confirming those previous factors. For example, we found that the association of PM2.5 exposure with bone fracture admission rates was higher among those communities in the lowest obesity rate quartile compared to those with highest obesity rates, suggesting a protective influence of obesity rates.
During the 8-year follow-up, middle-aged, low-income males living at locations with higher BC levels had larger annualized decreases in BMD. BC, a major component of fine particles measured by PM2.5, is a tracer of particles from traffic and might share different toxicological properties compared to other PM components. Therefore, our results indicate that particles from traffic are critical contributors to decreased bone health. PM2.5 levels showed only weak and non-significant associations with both BMD annualized changes and serum PTH levels. However, the PM2.5 analysis included only ~40% of the BACH/Bone participants due to unavailability of PM2.5 model predictions in the early years of the study. Lack of significance could be attributable to the lower number of middle-aged, low-income males —compared to the BC analysis—with long-term PM2.5 data, but this result has the potential of selection bias for lack of data in the full BACH/Bone cohort. In the BACH/Bone study, we did not observe association between long-term BC exposure and BMD at baseline, but we found associations with yearly change between baseline and follow up BMD in the longitudinal analysis. Lack of association in the cross-sectional analysis of 1-year average BC exposure and BMD at baseline might indicate that individuals are less susceptible to BC at a younger age and, consequently, effects were observed only as participants aged during the follow-up analysis.55
We observed a negative association between long-term BC exposure and reduction in femoral neck and ultradistal radius BMD. Although non-significant, negative associations between BC and ultradistal radius, total hip, and lumbar vertebral BMD were also observed. Our study is consistent with the finding that air pollution contributes to bone health impairment reported by different groups.42,56–58 Chen et al. showed that traffic-related exposure was associated with lower body BMD.58 Also, Chang et al. found an association between air pollution (carbon monoxide and nitrogen dioxide) and increased risk of osteoporosis.57 The difference in observed associations across multiple anatomical sites might be explained by differential anatomical susceptibility to the effects of PM on bones.59 Alvaer et al. reported gender differences in the association between air pollution and BMD, with association observed only for men.42 However, our finding from the Medicare analysis suggested that the impacts of ambient particulate air pollution on bone health may not be different between men and women. The difference in conclusion and findings between our study and the Oslo Health Study might be explained by age differences of the participants. This finding suggests that the potential adverse consequences of ambient particulate air pollution on bone health may be similar in men and women.
The two studies reported in this paper have notable limitations. The Medicare analysis used an ecological design and has limited capability of establishing causality. The analysis was conducted at zip code level and does not allow for evaluating the association of long-term PM2.5 exposure with hospital admissions at the individual level. To avoid the potential ecological fallacy,60 we complemented the Medicare analysis with the BACH/Bone study to investigate the impact of individual-level environmental risk factors on bone health. However, the Medicare analysis included a large number of hospital admissions for osteoporotic-related bone fractures in older individuals, over a large and heterogeneous geographical region in the U.S. The Medicare analysis may also be subject to selection bias, which is always a concern in observational studies. However, all individuals ≥65 years old are encouraged to enroll in the free Medicare program. Based on the enrollment criteria of Medicare beneficiaries, we assume that the Medicare enrollees are representative of the aging population in the Northeast/Mid-Atlantic U.S. We acknowledge a major limitation in that the hospital admission data were not validated, therefore we cannot exclude coding errors. However, based on study operations, misclassification is unlikely to be differential in areas with low and high PM levels. Therefore, coding errors are likely to result by non-differential measurement error, and are expected to bias the association towards the null rather than producing the observed associations. Furthermore, although our Medicare analysis was adjusted for risk factors of fractures at the zip code level, there are other known risk factors for falls and bone fractures that were not available from Medicare data. However, most factors were accounted for at the individual level in the BACH/Bone Study. Therefore, combining the two studies limit concerns about population-level analysis and bias from known confounders.
We acknowledge that the analysis conducted in the BACH/Bone study has several limitations due to moderate sample size and lack of generalizability, given that the cohort included 692 males only. However, to the best of our knowledge, only one study has reported the association between PM exposure and bone fractures.41 Nonetheless, the BACH/Bone study is distinctively unique because of the prospective BMD assessment at two time points. Further, in the Medicare analysis, we found similar associations of PM2.5 with bone fracture rates in both men and women, which strengthened and complemented the findings from the BACH/Bone study. However, we assigned the closest PM exposure available both in the Medicare study as in the BACH/Bone study but long-term PM exposure was not directly measured and no personal data was available. Also, our results may be influenced by other unmeasured individual factors, such as UV exposure or calcium intake, among others, that can modify bone health and that were not evaluated here. Likewise, although our models used specifically levels of PM2.5 (for Medicare study and for a subset of participants in the BACH/Bone study) and black carbon (for BACH/Bone Study), we cannot exclude that the effect we observed might be mediated by other air pollutants or by the combination of them. In addition, the DXA-based BMD measures used may not detect microstructural alterations that are not readily apparent. Therefore, BMD may fail to fully capture alterations related to bone health.61 We also acknowledge potential misclassification, especially in the BACH/Bone study, but this is likely to be non-differential (i.e. the measurement error of exposure in the BACH/Bone study is unlikely to be dependent on BMD status), therefore it is expected to bias our results towards the null. On the other hand, other air pollutants such as carbon monoxide (CO) and nitrogen dioxide (NO2) have been previously associated with bone loss and osteoporosis.42,57 Unfortunately, we did not have access to CO and NO2 exposure data in for the Medicare study nor for BACH/Bone, limiting our capability to explore these associations. Further analyses to evaluate the role PM2.5 and BC, as well as of CO and NO2 on bone health are warranted. Finally, although we have adjusted for multiple potential confounders (smoking, race, physical activity, income, etc.) in the BACH/Bone study, our results might not be sufficient to rule out selection bias, especially in the PM2.5 model where the number of participants was low.
CONCLUSIONS
We found evidence of an association between air particle levels and increased rates of hospital admissions for bone fractures in older Medicare beneficiaries, particularly in low-income communities. In the BACH/Bone Study follow-up of middle-aged low-income men, participants with higher air particle levels had lower serum PTH levels and reductions in BMD. All associations were linear and observed—at least for part of the PM2.5 distribution—at PM2.5 concentrations below the annual average limits set by the U.S. Environmental Protection Agency (12 μg/m3) and the European Union (25 μg/m3),62 as well by other countries, such as for instance China (40 μg/m3)63 and Japan (15 μg/m3)64. Our findings support an association between long-term exposure to particulate air pollution and reduced bone health, particularly among low-income older individuals. Improvements in particulate air pollution levels could contribute to substantial better bone health, prevent bone fractures, and reduce the health costs associated with fractures, particularly in elderly and low-income populations.
Supplementary Material
RESEARCH IN CONTEXT.
Evidence before this study
Exposure to particulate Matter (PM) induces oxidative damage and inflammation, which may affect bone health, particularly of older populations. Smoking, which contains several PM components, has been consistently associated with bone damage. However, whether ambient PM levels affect calcium metabolism, bone damage, and risk of fractures is uncertain.
Added value of this study
We demonstrate for the first time higher rates of hospital admissions for bone fractures in communities with higher ambient PM2.5 levels. Participants living at addresses with higher levels of traffic-derived PM particles exhibit lower serum parathyroid hormone (PTH) levels and higher decreases in bone mineral density (BMD) over an 8-year follow-up.
Implications of all the available evidence
This study provides evidence that long-term PM exposure —a persistent environmental issue in Europe and globally— is an independent risk factor for bone fractures, possibly involving changes in PTH. These associations may disproportionately impact least-favored communities. We found PM association well below the annual average limits set by the U.S. Environmental Protection Agency and the European Union. Improvements in particulate air pollution levels may ameliorate bone health, prevent bone fractures, and reduce the health cost burden associated with fractures in older individuals.
Acknowledgments
This work was supported by the National Institutes of Health, Institute on Aging [R01AG020727], National Institute of Environmental Health Sciences [R01ES02173 and R01ES00002 to AAB, R01ES05172 to JS], and the U.S. Environmental Protection Agency [RD-83479801 to JS]. DP was financially supported by Consejo Nacional de Ciencia y Tecnología (CONACYT) and the Fundación México en Harvard. The authors are thankful to Dr. Douglas Dockery for helpful discussions of the study findings and insightful advice and to Ms. Cheng Peng for assistance with figure preparation.
Footnotes
Publisher's Disclaimer: This is a PDF file of an unedited manuscript that has been accepted for publication. As a service to our customers we are providing this early version of the manuscript. The manuscript will undergo copyediting, typesetting, and review of the resulting proof before it is published in its final citable form. Please note that during the production process errors may be discovered which could affect the content, and all legal disclaimers that apply to the journal pertain.
CONTRIBUTIONS
DP, JZ, BB, and AB contributed in the designing of the Medicare Study and the BACH/Bone Analysis. DP, EC, AZ, and JS contributed in the statistical modeling for the Medicare Study, as well as obtaining Medicare data. ND, SF, and BB contributed in the statistical modelling for the BACH/Bone Study. IK, AZ, and JS contributed in the modeling of PM and Black Carbon exposures for the Medicare and the BACH/Bone Study. DP run the statistical models for the Medicare Study. ND run the statistical models for the BACH/Bone Study. DP, JMZ, MH, LAH, LH, FD, and AB contributed in the designing of the integration of both cohorts and contributed actively in the discussion of results and its interpretation. DP, AZ, BB, JZ, EC, FD, and AB also contributed in the discussion of results. BB was the PI for the BACH/Bone cohort and AB was the PI for the Medicare Study. DP and JZ wrote the manuscript and the revisions.
DECLARATION OF INTEREST
We declare that we have no conflicts of interest.
References
- 1.Burge R, Dawson-Hughes B, Solomon DH, Wong JB, King A, Tosteson A. Incidence and economic burden of osteoporosis-related fractures in the United States, 2005–2025. J Bone Miner Res. 2007;22:465–75. doi: 10.1359/jbmr.061113. [DOI] [PubMed] [Google Scholar]
- 2.Leibson CL, Tosteson ANA, Gabriel SE, Ransom JE, Melton LJ. Mortality, disability, and nursing home use for persons with and without hip fracture: a population-based study. J Am Geriatr Soc. 2002;50:1644–50. doi: 10.1046/j.1532-5415.2002.50455.x. [DOI] [PubMed] [Google Scholar]
- 3.Li Y, Zhang Z, Liu X, et al. miR-124 functions as a tumor suppressor in the endometrial carcinoma cell line HEC-1B partly by suppressing STAT3. Mol Cell Biochem. 2014;388:219–31. doi: 10.1007/s11010-013-1913-2. [DOI] [PubMed] [Google Scholar]
- 4.Iacono MV. Osteoporosis: a national public health priority. J Perianesth Nurs. 2007;22:175–80. doi: 10.1016/j.jopan.2007.03.009. [DOI] [PubMed] [Google Scholar]
- 5.Wilkins CH, Birge SJ. Prevention of osteoporotic fractures in the elderly. Am J Med. 2005;118:1190–5. doi: 10.1016/j.amjmed.2005.06.046. [DOI] [PubMed] [Google Scholar]
- 6.Peng RD, Chang HH, Bell ML, et al. Coarse particulate matter air pollution and hospital admissions for cardiovascular and respiratory diseases among Medicare patients. JAMA. 2008;299:2172–9. doi: 10.1001/jama.299.18.2172. [DOI] [PMC free article] [PubMed] [Google Scholar]
- 7.Ye X, Peng L, Kan H, et al. Acute Effects of Particulate Air Pollution on the Incidence of Coronary Heart Disease in Shanghai, China. PLoS ONE. 2016;11:e0151119. doi: 10.1371/journal.pone.0151119. [DOI] [PMC free article] [PubMed] [Google Scholar]
- 8.Du Y, Xu X, Chu M, Guo Y, Wang J. Air particulate matter and cardiovascular disease: the epidemiological, biomedical and clinical evidence. J Thorac Dis. 2016;8:E8–E19. doi: 10.3978/j.issn.2072-1439.2015.11.37. [DOI] [PMC free article] [PubMed] [Google Scholar]
- 9.Xing Y-F, Xu Y-H, Shi M-H, Lian Y-X. The impact of PM2.5 on the human respiratory system. J Thorac Dis. 2016;8:E69–74. doi: 10.3978/j.issn.2072-1439.2016.01.19. [DOI] [PMC free article] [PubMed] [Google Scholar]
- 10.Franchini M, Mengoli C, Cruciani M, Bonfanti C, Mannucci PM. Association between particulate air pollution and venous thromboembolism: A systematic literature review. Eur J Intern Med. 2016;27:10–3. doi: 10.1016/j.ejim.2015.11.012. [DOI] [PubMed] [Google Scholar]
- 11.Di Lorenzo G, Federico P, De Placido S, Buonerba C. Increased risk of bladder cancer in critical areas at high pressure of pollution of the Campania region in Italy: A systematic review. Crit Rev Oncol Hematol. 2015;96:534–41. doi: 10.1016/j.critrevonc.2015.07.004. [DOI] [PubMed] [Google Scholar]
- 12.Li J, Li WX, Bai C, Song Y. Particulate matter-induced epigenetic changes and lung cancer. Clin Respir J. 2015 doi: 10.1111/crj.12389. published online Sept 25. [DOI] [PMC free article] [PubMed] [Google Scholar]
- 13.Clifford A, Lang L, Chen R, Anstey KJ, Seaton A. Exposure to air pollution and cognitive functioning across the life course - A systematic literature review. Environ Res. 2016;147:383–98. doi: 10.1016/j.envres.2016.01.018. [DOI] [PubMed] [Google Scholar]
- 14.Power MC, Weisskopf MG, Alexeeff SE, Coull BA, Spiro A, Schwartz J. Traffic-Related Air Pollution and Cognitive Function in a Cohort of Older Men. Environ Health Perspect. 2010;119:682–7. doi: 10.1289/ehp.1002767. [DOI] [PMC free article] [PubMed] [Google Scholar]
- 15.Schikowski T, Vossoughi M, Vierkotter A, et al. Association of air pollution with cognitive functions and its modification by APOE gene variants in elderly women. Environ Res. 2015;142:10–6. doi: 10.1016/j.envres.2015.06.009. [DOI] [PubMed] [Google Scholar]
- 16.Møller P, Loft S. Oxidative damage to DNA and lipids as biomarkers of exposure to air pollution. Environ Health Perspect. 2010;118:1126–36. doi: 10.1289/ehp.0901725. [DOI] [PMC free article] [PubMed] [Google Scholar]
- 17.Bind M-A, Baccarelli A, Zanobetti A, et al. Air pollution and markers of coagulation, inflammation, and endothelial function: associations and epigene-environment interactions in an elderly cohort. Epidemiology. 2012;23:332–40. doi: 10.1097/EDE.0b013e31824523f0. [DOI] [PMC free article] [PubMed] [Google Scholar]
- 18.Krall EA, Dawson-Hughes B. Smoking and bone loss among postmenopausal women. J Bone Miner Res. 1991;6:331–8. doi: 10.1002/jbmr.5650060404. [DOI] [PubMed] [Google Scholar]
- 19.Law MR, Hackshaw AK. A meta-analysis of cigarette smoking, bone mineral density and risk of hip fracture: recognition of a major effect. BMJ. 1997;315:841–6. doi: 10.1136/bmj.315.7112.841. [DOI] [PMC free article] [PubMed] [Google Scholar]
- 20.Kloog I, Koutrakis P, Coull BA, Lee HJ, Schwartz J. Assessing temporally and spatially resolved PM2.5 exposures for epidemiological studies using satellite aerosol optical depth measurements. Atmospheric Environment. 2011;45:6267–75. [Google Scholar]
- 21.Kloog I, Nordio F, Zanobetti A, Coull BA, Koutrakis P, Schwartz JD. Short term effects of particle exposure on hospital admissions in the Mid-Atlantic states: a population estimate. PLoS ONE. 2014;9:e88578. doi: 10.1371/journal.pone.0088578. [DOI] [PMC free article] [PubMed] [Google Scholar]
- 22.Piccolo RS, Araujo AB, Pearce N, McKinlay JB. Cohort Profile: The Boston Area Community Health (BACH) survey. Int J Epidemiol. 2012;43:42–51. doi: 10.1093/ije/dys198. [DOI] [PMC free article] [PubMed] [Google Scholar]
- 23.Washburn RA, Smith KW, Jette AM, Janney CA. The Physical Activity Scale for the Elderly (PASE): development and evaluation. J Clin Epidemiol. 1993;46:153–62. doi: 10.1016/0895-4356(93)90053-4. [DOI] [PubMed] [Google Scholar]
- 24.Block G, Hartman AM, Dresser CM, Carroll MD, Gannon J, Gardner L. A data-based approach to diet questionnaire design and testing. American Journal of Epidemiology. 1986;124:453–69. doi: 10.1093/oxfordjournals.aje.a114416. [DOI] [PubMed] [Google Scholar]
- 25.McKinlay JB, Link CL. Measuring the urologic iceberg: design and implementation of the Boston Area Community Health (BACH) Survey. Eur Urol. 2007;52:389–96. doi: 10.1016/j.eururo.2007.03.013. [DOI] [PMC free article] [PubMed] [Google Scholar]
- 26.Gryparis A, Coull BA, Schwartz J, Suh HH. Semiparametric latent variable regression models for spatiotemporal modelling of mobile source particles in the greater Boston area. J Royal Statistical Soc C. 2007;56:183–209. [Google Scholar]
- 27.Chen TC, Turner AK, Holick MF. Methods for the determination of the circulating concentration of 25-hydroxyvitamin D. J Nutr Biochem. 1990;1:315–9. doi: 10.1016/0955-2863(90)90067-u. [DOI] [PubMed] [Google Scholar]
- 28.Hannan MT, Litman HJ, Araujo AB, et al. Serum 25-hydroxyvitamin D and bone mineral density in a racially and ethnically diverse group of men. J Clin Endocrinol Metab. 2008;93:40–6. doi: 10.1210/jc.2007-1217. [DOI] [PMC free article] [PubMed] [Google Scholar]
- 29.Austin M, Yang Y-C, Vittinghoff E, et al. Relationship between bone mineral density changes with denosumab treatment and risk reduction for vertebral and nonvertebral fractures. J Bone Miner Res. 2012;27:687–93. doi: 10.1002/jbmr.1472. [DOI] [PMC free article] [PubMed] [Google Scholar]
- 30.Wei RL, Jung BC, Manzano W, et al. Bone mineral density loss in thoracic and lumbar vertebrae following radiation for abdominal cancers. Radiother Oncol. 2016;118:430–6. doi: 10.1016/j.radonc.2016.03.002. [DOI] [PubMed] [Google Scholar]
- 31.Team RDC. A Language and Environment for Statistical Computing. R Foundation for Statistical Computing. 2011 published online March 19. [Google Scholar]
- 32.Buuren S, Groothuis-Oudshoorn K. MICE: Multivariate imputation by chained equations in R. Journal of Statistical Software. 2011;45:1–67. [Google Scholar]
- 33.Bureau USC. U.S. Census Bureau. Census 2000 Summary File 3 (SF 3) 2002 1 March, 2015 date last accessed. [Google Scholar]
- 34.Knaapen AM, Borm PJA, Albrecht C, Schins RPF. Inhaled particles and lung cancer. Part A: Mechanisms. Int J Cancer. 2004;109:799–809. doi: 10.1002/ijc.11708. [DOI] [PubMed] [Google Scholar]
- 35.Smith BJ, Lerner MR, Bu SY, et al. Systemic bone loss and induction of coronary vessel disease in a rat model of chronic inflammation. Bone. 2006;38:378–86. doi: 10.1016/j.bone.2005.09.008. [DOI] [PubMed] [Google Scholar]
- 36.Ajiro Y, Tokuhashi Y, Matsuzaki H, Nakajima S, Ogawa T. Impact of passive smoking on the bones of rats. Orthopedics. 2010;33:90–5. doi: 10.3928/01477447-20100104-14. [DOI] [PubMed] [Google Scholar]
- 37.Gunnarsson O, Indridason OS, Franzson L, Sigurdsson G. Factors associated with elevated or blunted PTH response in vitamin D insufficient adults. J Intern Med. 2009;265:488–95. doi: 10.1111/j.1365-2796.2008.02044.x. [DOI] [PubMed] [Google Scholar]
- 38.Jorde R, Saleh F, Figenschau Y, Kamycheva E, Haug E, Sundsfjord J. Serum parathyroid hormone (PTH) levels in smokers and non-smokers. The fifth Tromsø study. Eur J Endocrinol. 2005;152:39–45. doi: 10.1530/eje.1.01816. [DOI] [PubMed] [Google Scholar]
- 39.Tamadon MR, Nassaji M, Ghorbani R. Cigarette smoking and nephrolitiasis in adult individuals. Nephrourol Mon. 2013;5:702–5. doi: 10.5812/numonthly.5251. [DOI] [PMC free article] [PubMed] [Google Scholar]
- 40.Liu C-C, Huang S-P, Wu W-J, et al. The impact of cigarette smoking, alcohol drinking and betel quid chewing on the risk of calcium urolithiasis. Ann Epidemiol. 2009;19:539–45. doi: 10.1016/j.annepidem.2009.02.006. [DOI] [PubMed] [Google Scholar]
- 41.Alver K, Meyer HE, Falch JA, Søgaard AJ. Outdoor air pollution, bone density and self-reported forearm fracture: the Oslo Health Study. Osteoporos Int. 2010;21:1751–60. doi: 10.1007/s00198-009-1130-8. [DOI] [PubMed] [Google Scholar]
- 42.Alvaer K, Meyer HE, Falch JA, Nafstad P, Søgaard AJ. Outdoor air pollution and bone mineral density in elderly men - the Oslo Health Study. Osteoporos Int. 2007;18:1669–74. doi: 10.1007/s00198-007-0424-y. [DOI] [PubMed] [Google Scholar]
- 43.Bjørgul K, Reikerås O. Incidence of hip fracture in southeastern Norway: a study of 1,730 cervical and trochanteric fractures. Int Orthop. 2007;31:665–9. doi: 10.1007/s00264-006-0251-3. [DOI] [PMC free article] [PubMed] [Google Scholar]
- 44.Cooley HM, Jones G. Symptomatic fracture incidence in southern Tasmania: does living in the country reduce your fracture risk? Osteoporos Int. 2002;13:317–22. doi: 10.1007/s001980200032. [DOI] [PubMed] [Google Scholar]
- 45.Omsland TK, Ahmed LA, Grønskag A, et al. More forearm fractures among urban than rural women: the NOREPOS study based on the Tromsø study and the HUNT study. J Bone Miner Res. 2011;26:850–6. doi: 10.1002/jbmr.280. [DOI] [PubMed] [Google Scholar]
- 46.Nawrot TS, Perez L, Künzli N, Munters E, Nemery B. Public health importance of triggers of myocardial infarction: a comparative risk assessment. The Lancet. 2011 doi: 10.1016/S0140-6736(10)62296-9. [DOI] [PubMed] [Google Scholar]
- 47.Baccarelli A, Benjamin EJ. Triggers of MI for the individual and in the community. Lancet. 2011;377:694–6. doi: 10.1016/S0140-6736(10)62348-3. [DOI] [PMC free article] [PubMed] [Google Scholar]
- 48.Nam H-S, Kweon S-S, Choi J-S, et al. Racial/ethnic differences in bone mineral density among older women. J Bone Miner Metab. 2013;31:190–8. doi: 10.1007/s00774-012-0402-0. [DOI] [PMC free article] [PubMed] [Google Scholar]
- 49.Nam H-S, Shin M-H, Zmuda JM, et al. Race/ethnic differences in bone mineral densities in older men. Osteoporos Int. 2010;21:2115–23. doi: 10.1007/s00198-010-1188-3. [DOI] [PMC free article] [PubMed] [Google Scholar]
- 50.Douchi T, Yamamoto S, Oki T, et al. Difference in the effect of adiposity on bone density between pre- and postmenopausal women. Maturitas. 2000;34:261–6. doi: 10.1016/s0378-5122(99)00114-0. [DOI] [PubMed] [Google Scholar]
- 51.Guney E, Kisakol G, Ozgen G, Yilmaz C, Yilmaz R, Kabalak T. Effect of weight loss on bone metabolism: comparison of vertical banded gastroplasty and medical intervention. Obes Surg. 2003;13:383–8. doi: 10.1381/096089203765887705. [DOI] [PubMed] [Google Scholar]
- 52.Radak TL. Caloric restriction and calcium’s effect on bone metabolism and body composition in overweight and obese premenopausal women. Nutr Rev. 2004;62:468–81. doi: 10.1111/j.1753-4887.2004.tb00019.x. [DOI] [PubMed] [Google Scholar]
- 53.Navarro MDC, Saavedra P, Jódar E, Gómez de Tejada MJ, Mirallave A, Sosa M. Osteoporosis and metabolic syndrome according to socio-economic status, contribution of PTH, vitamin D and body weight: The Canarian Osteoporosis Poverty Study (COPS) Clin Endocrinol (Oxf) 2013;78:681–6. doi: 10.1111/cen.12051. [DOI] [PubMed] [Google Scholar]
- 54.Freedman BI, Register TC. Effect of race and genetics on vitamin D metabolism, bone and vascular health. Nat Rev Nephrol. 2012;8:459–66. doi: 10.1038/nrneph.2012.112. [DOI] [PMC free article] [PubMed] [Google Scholar]
- 55.Cashman KD. Diet, nutrition, and bone health. J Nutr. 2007;137:2507S–2512S. doi: 10.1093/jn/137.11.2507S. [DOI] [PubMed] [Google Scholar]
- 56.Meyer HE, Berntsen GKR, Søgaard AJ, et al. Higher bone mineral density in rural compared with urban dwellers: the NOREPOS study. American Journal of Epidemiology. 2004;160:1039–46. doi: 10.1093/aje/kwh337. [DOI] [PubMed] [Google Scholar]
- 57.Chang K-H, Chang M-Y, Muo C-H, et al. Exposure to air pollution increases the risk of osteoporosis: a nationwide longitudinal study. Medicine (Baltimore) 2015;94:e733. doi: 10.1097/MD.0000000000000733. [DOI] [PMC free article] [PubMed] [Google Scholar]
- 58.Chen Z, Salam MT, Karim R, et al. Living near a freeway is associated with lower bone mineral density among Mexican Americans. Osteoporos Int. 2015 doi: 10.1007/s00198-015-3051-z. published online Feb 13. [DOI] [PMC free article] [PubMed] [Google Scholar]
- 59.Kanis JA, Odén A, Johnell O, Jónsson B, de Laet C, Dawson A. The burden of osteoporotic fractures: a method for setting intervention thresholds. Osteoporos Int. 2001;12:417–27. doi: 10.1007/s001980170112. [DOI] [PubMed] [Google Scholar]
- 60.Piantadosi S, Byar DP, Green SB. The ecological fallacy. American Journal of Epidemiology. 1988;127:893–904. doi: 10.1093/oxfordjournals.aje.a114892. [DOI] [PubMed] [Google Scholar]
- 61.Fonseca H, Moreira-Gonçalves D, Coriolano H-JA, Duarte JA. Bone quality: the determinants of bone strength and fragility. Sports Med. 2014;44:37–53. doi: 10.1007/s40279-013-0100-7. [DOI] [PubMed] [Google Scholar]
- 62.Jacquemin B, Siroux V, Sanchez M, et al. Ambient air pollution and adult asthma incidence in six European cohorts (ESCAPE) Environ Health Perspect. 2015;123:613–21. doi: 10.1289/ehp.1408206. [DOI] [PMC free article] [PubMed] [Google Scholar]
- 63.Department of Environmental Science. Air quality standards - DCE - National Center for Miljo of Energy. 2016 Jun; http://www2.dmu.dk/AtmosphericEnvironment/Expost/database/docs/AQ_limit_values.pdf (accessed Aug 7, 2016)
- 64.Miller J. Japan: Air Quality Standards. TransportPolicy.net. 2016 Feb 26; Date. http://transportpolicy.net/index.php?title=Japan:_Air_Quality_Standards (accessed Aug 7, 2016)
Associated Data
This section collects any data citations, data availability statements, or supplementary materials included in this article.