

Abstract
A mass spectral library search algorithm that identifies compounds that differ from library compounds by a single ‘inert’ structural component is described. This algorithm, the Hybrid Similarity Search, generates a similarity score based on matching both fragment ions and neutral losses. It employs the parameter DeltaMass, defined as the mass difference between query and library compounds, to shift neutral loss peaks in the library spectrum to match corresponding neutral loss peaks in the query spectrum. When the spectra being compared differ by a single structural feature, these matching neutral loss peaks should contain that structural feature. This method extends the scope of the library to include spectra of ‘nearest-neighbor’ compounds that differ from library compounds by a single chemical moiety. Additionally, determination of the structural origin of the shifted peaks can aid in the determination of the chemical structure and fragmentation mechanism of the query compound. A variety of examples are presented, including the identification of designer drugs and chemical derivatives not present in the library.
Keywords: Electron Ionization Mass Spectrometry, Fentanyl, Library-Searching, New Psychoactive Substances, Reference Data, Structural Similarity
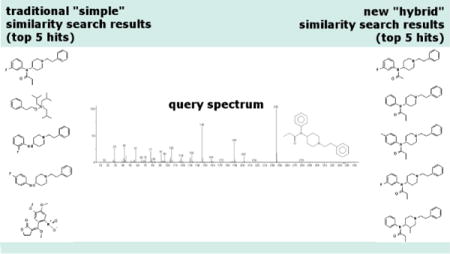
TOC image
1. Introduction
Mass spectral library searching has been integral to compound identification by GC-MS for well over 50 years.1–3 In electron ionization (EI) mass spectrometry, ion fragments of an ionized molecule produce a mass spectrum. The spectrum provides a reproducible ‘fingerprint’ for the precursor molecule. The closest matching spectra in a library of spectra are then located and sorted by similarity to the query spectrum to form a ‘hit list’.4–9 The principal drawback of present library search methods is the possibility that the compound generating the query spectrum is not present in the library. This limitation greatly restricts library searching in areas such as illicit drug identification where new drug analogs are rapidly appearing.10
The Hybrid Similarity Search (HSS) is a new spectrum comparison function that does not require the spectrum of a query compound to be present in the library during a library search. Instead, it can generate a high similarity score for spectra of compounds with substantially similar fragmentation mechanisms that differ by the insertion, deletion, or replacement of a discrete chemical moiety. This, in effect, increases the coverage of a library to include ‘nearest neighbor’ library compounds. Though the hit list of a HSS will not contain a compound identification itself, the frequency of homologs will aid an analyst in deducing an identification. Following the description of the algorithm, several examples and applications of the HSS are outlined, including comparison of the HSS to a Simple Similarity Search (SSS) for their ability to classify fentanyl analogs in the NIST 17 MS EI Library.
2. Method
Similarity between any two spectra is quantified by a computed match factor. The basic concept that distinguishes match factors computed using the HSS from more commonly applied spectral matching methods is that both neutral loss and direct fragments contribute equally to the final score. Therefore, if two compounds differ by the insertion/deletion or replacement of structural groups that do not affect the fragmentation mechanism, match factors computed using the HSS will be substantially higher than other methods. This section details the procedures for computing a match factor using the HSS. A brief description of the SSS (sometimes referred to as the Direct Method) is provided prior to a complete description of the HSS. For simplicity, this discussion assumes that spectra are measured at unit mass resolution, as has long been commonplace for EI spectra. Extensions to high mass accuracy spectra are straightforward.
2.1 Simple Similarity Search
The ‘Simple’ Similarity Search algorithm is a long standing library search approach.5,6 A summary of this method is provided to support description of the HSS algorithm.
The mass spectrum of a query compound is searched against a library of spectra of known chemical compounds. Spectra are represented as vectors where the index is the integral mass of a fragment ion and the value is its abundance. Let Q be the vector for a query compound (analyte), and L be the vector for a compound from the library. To compute the similarity Match Factor between vectors Q and L, the following modified cosine similarity function is employed:
| (1) |
where Qi and Li are the abundance of Q and L, respectively, at unit mass i, and C is an arbitrary constant. For historical reasons, C is 999. Equation (1) was derived for optimal performance, and is similar to other empirically derived expressions found in literature.6,11 A Match Factor close to 999 is indicative of nearly identical spectra, and a Match Factor approaching 0 occurs when the spectra have no peaks in common. In practice, a score above 800 is commonly considered a ‘good’ match and a score below 700 a questionable one. The meaning of these values, however, depends in a complex way on both the details of the spectra being compared (numbers of peaks, for example) and, more importantly, on the number of library compounds giving rise to spectra similar to the query compound. Consequently, the identification process requires human evaluation.
2.2 Hybrid Similarity Search
The HSS scoring algorithm is a straightforward extension of the SSS. Each query peak can match library peaks in two ways – by direct m/z match and by matching a shifted library peak. This is a quantitative expression of the well-known Biemann shift technique12,13 used in spectral interpretation. The shift is referred to as DeltaMass (Δm) and is defined as the nominal mass difference between the query and library compound. In cases where both the direct m/z and shifted library peaks match a corresponding query peak, the abundance is split between the two library peaks as to optimize match factor and conserve total abundance. The HSS Match Factor is computed as:
| (2) |
where H is a vector that contains the appropriately apportioned peak intensity matching information from library and shifted peaks. Figure 1 illustrates the mechanics of generating a H vector during a HSS. The query compound 8-chlorocaffeine is shown as the top spectrum. The lower spectrum is for library compound caffeine. Unshifted peaks are shown in black, while peaks before and after shifting are shown in gray and red, respectively. Note the shift from gray to red peaks corresponds to DeltaMass (34 Da). Select major shifts are highlighted with arrows. The black and red peaks together are, in effect, a hybrid spectrum (the H vector). The sum of intensities in the hybrid spectrum is the same as the original library spectrum. The match factor computed using (1) is 260. In comparison, the match factor computed using (2) is 865. Worked numerical examples demonstrating the construction of hybrid spectra and computation of match factors, including an assessment of the effect of noise, are included as supplementary material(Appendix A).
Figure 1.
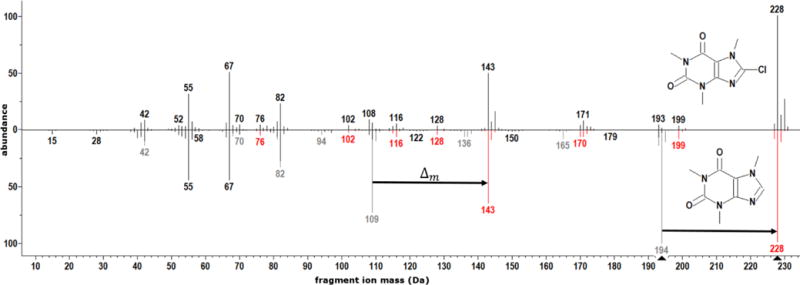
Head-to-tail plot comparing mass spectra of 8-chlorocaffeine (top) with caffeine (black and gray peaks in bottom spectrum). The hybrid spectrum corresponds to the black and red peaks in the bottom spectrum. The mass shift from gray to red peaks is DeltaMass (Δm) – the nominal mass difference between 8-chlorocaffeine and caffeine. Select shifts highlighted with arrows.
Requirement for Molecular Mass
Computation of DeltaMass requires the mass of both the library and query compounds. When the query compound is an unknown and its molecular ion is not evident in its spectrum, a variety of methods for estimating the nominal mass are available.5,14 Such estimates are made in NIST MS Search 2.3.15 An approach for estimating nominal mass using the HSS scores themselves is introduced in Section 3.4.
3. Results and Discussion
The HSS is implemented in the NIST MS Search Program v.2.315, which is freely available for download.16 All results in this paper are generated using that program and the NIST 17 EI mass spectral library.16 In the proceeding discussion, we present several simple examples intended to illustrate how computed match factors vary between pairs of compounds, followed by two applications of the search algorithm for classification/identification. Although this manuscript focuses on the application of HSS to EI mass spectrometry, concepts discussed can be applied to high mass accuracy spectra common in tandem mass-spectrometry as well as the new generation of high resolution GC-MS instruments used for metabolite and small molecule identification. A modified implementation of the HSS has been shown to identify unanticipated modifications, insertions and deletions in bottom-up proteomics experiments.17
3.1. Computing Match Factors: Illustrative Examples
As a preliminary example, consider the compound methyl phenylacetate. It contains a single labile bond. A mass spectrum of methyl phenylacetate contains two major peaks: a fragment ion with mass 91 Da and its molecular ion of mass 150 Da. The compound methyl p-methylphenylacetate contains an additional methyl at the para position of the aromatic ring. The labile bond in methyl p-methylphenyl acetate is the same as methyl phenylacetate (i.e. the methyl addition is ‘inert’ from the standpoint of mass spectral fragmentation). Accordingly, the mass spectrum of methyl p-methylphenylacetate contains two major peaks: a fragment ion with mass 105 Da and its molecular ion of mass 164 Da. The spectra of both compounds are shown as a head-to-tail plot in Figure 2. Let Q be the vector containing the spectral information of methyl phenylacetate and L be the vector for methyl p-methylphenylacetate, using (1), the SSS match factor is 126. Alternatively, using (2), the HSS match factor is 946.
Figure 2.
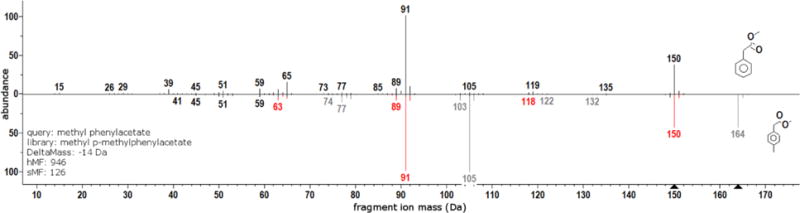
Head-to-tail plot comparing mass spectra of methyl phenylacetate (top) with methyl p-methylphenylacetate (black and gray peaks in bottom spectrum). The hybrid spectrum corresponds to the black and red peaks in the bottom spectrum.
Note that there were no ‘multiply matched’ peaks in the previous example, and so construction of the hybrid spectrum only required the shifting of peaks. In some cases, a library peak and shifted peak will match the same single query peak. This requires the abundance of the library peak to be split between two masses. Consider the query of 4-fluoro-1,2-diphenylethane against 1,2-diphenylethane. Figure 3 shows a head-to-tail plot of the spectra. In constructing the hybrid spectrum, peaks from 1,2-diphenylethane must be shifted by DeltaMass of 18 and intensities split as necessary. For example, the peak at 91 Da in the library spectrum matches a peak at 91 Da in the query spectrum and a peak at 109 Da.
Figure 3.

Head-to-tail plot comparing spectra of 4-fluoro-1,2-diphenylethane (top) and 1,2-diphenylethane (black and gray peaks in bottom spectrum). The hybrid spectrum corresponds to the black and red peaks in the bottom spectrum.
Both of the previous examples considered compounds with well understood fragmentation mechanisms and clear fragment-peak assignments. The same principles apply to more complex chemical structures even when peak assignments are not clear. Consider tetrahydrocannabinol (THC) and its analog methoxy THC. Both compounds generate rich spectra and so construction of a hybrid spectrum is less obvious than previous examples presented – many shifts and splits are required. Head-to-tail plot of the spectra for these compounds is provided as Figure 4. The improvement in computed match factors is not as pronounced as the previous straightforward examples, yet it is clear that the HSS match factor captures spectral similarity that would be lost using the SSS.
Figure 4.
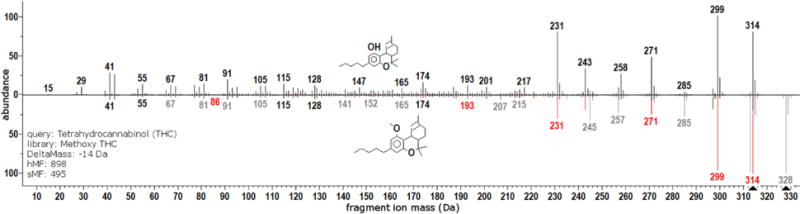
Head-to-tail plot comparing spectra tetrahydrocannabinol (top) and methoxy tetrahydrocannabinol (black and gray peaks in bottom spectrum). Hybrid spectrum corresponds to black and red peaks in bottom spectrum.
To conclude this section, we include a ‘map’ of structures and their spectral similarity scores for a variety of compounds (including those previously discussed) as Figure 5. In the map, DeltaMass and hybrid match factor values are computed using the arrow start and end points to indicate query and library compound designations, respectively. The figure should make clear that the increase in match factor associated with the hybrid algorithm is significant when the compared compounds differ by a single modification, and less notable if compounds differ by two or more modifications. This ensures that library searching using the hybrid match factor generates hit-lists filled with homologues of the query compound.
Figure 5.
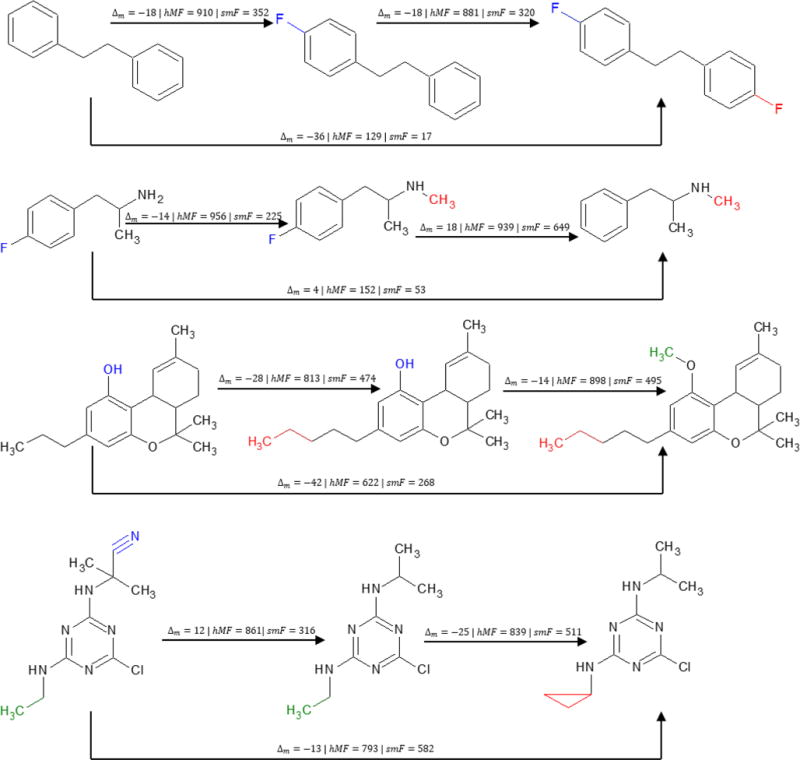
Map of computed similarity scores between several compounds in the NIST 17 EI Library. DeltaMass (Δm) and hybrid match factor (hMF) values are computed using the arrow start and end points to indicate query and library compound designations, respectively. Simple match factor (sMF) values are included for comparison. Note that the increase in match factor associated with the hybrid algorithm is significant when the compared compounds differ by a single modification, and less notable if compounds differ by two or more modifications.
3.2. Library Searching
The primary use of spectral similarity scores is to generate a hit-list, which serves to aid an analyst in identifying an analyte. In this section, we first present a simple example of searching an unknown amino acid. This is followed by a detailed assessment of classifying fentanyl and related compounds in the NIST 17 library.
3.2.1. Amino acids
In this application, we use as a spectrum of an ‘unknown’ compound, the spectrum of Valine, 2 trimethylsilyl (TMS). In effect, we logically remove it from the library. Table 1 presents the top ten hits from its search using the HSS.
Table 1.
Top ten hit list generated using query Valine, 2TMS derivative and the Hybrid Similarity Search. Simple Similarity Search rankings included for comparison.
| Compound Name | HSS Rank | hMF | DeltaMass (Da) | SSS Rank | sMF |
|---|---|---|---|---|---|
| Isoleucine, 2TMS derivative | 1 | 900 | −14 | >100 | 238 |
| Norleucine, N-timethylsily l-trimethylsily 1 ester | 2 | 878 | −14 | >100 | 130 |
| 3,4 - Methylenedioxymandelic acid, 2TMS derivative | 3 | 846 | −79 | >100 | 144 |
| 3,4-Dimethoxymandelic acid, di-TMS | 4 | 840 | −95 | >100 | 95 |
| L-Isoleucine, 2TMS derivative | 5 | 834 | −14 | >100 | 183 |
| 4-Methylmandelic acid, di-TMS | 6 | 834 | −49 | >100 | 143 |
| L-Leucine, 2TMS derivative | 7 | 832 | −14 | >100 | 139 |
| 2-Aminoctanoic acid, 2TMS derivative | 8 | 829 | −42 | >100 | 113 |
| 2,3,4-Trimethoxymandelic acid, di-TMS | 9 | 822 | −125 | >100 | 76 |
| N-methyl-L-leucine, 2TMS derivative | 10 | 822 | −28 | >100 | 209 |
The identity of this compound can be deduced using the homologues and their DeltaMass values in the hit-list. First, note that all of the top ten hits are amino acid derivatives and that scores by the standard search are so low that none of them would have appeared in a hit list resulting from the conventional search. Further examination shows that virtually all of the top 50 hits are TMS derivatives of amino acids. Examination of the delta mass values shows that the ‘unknown’ contains one fewer methylene groups than isoleucine – which, on inspection of the shifted peaks, shows this compound to be the valine di-TMS derivative.
Further examination reveals many other cases where the hybrid search connects closely related derivatives, such as tert-butyldimethyl silyl and TMS, ethoxamines and methoxamines as well as pentafluoropropionates and trifluoroacetates. This can greatly increase the utility of libraries for investigators using alternative derivatization agents.
3.2.2. Fentanyl-related compounds
Designer drugs often differ by a single, relatively inert modification from a known controlled substance. As such, the hybrid search is particularly well suited for identifying one designer drug on the basis of spectra of drugs that differ by a single group. The fact that many fentanyls are present in the NIST 17 library allow the use of HSS to organize this important class of compounds according to their structures and fragmentation behavior. This illustrates the strengths and limitation of the HSS method for identifying fentanyls.
To assess the quality of hit-lists generated using the search algorithms, we define ‘fentanyl-related compounds’ (FRCs) using using Scheme 1 where R1, R2, R3 and R4 can contain any or no additional attachments.
Scheme 1.
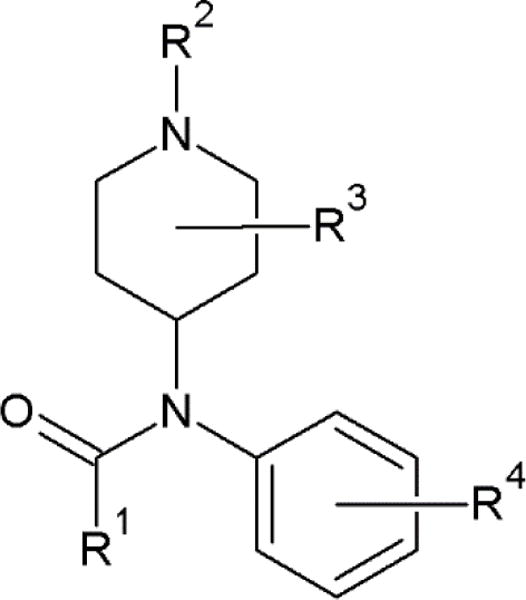
Structure motif used in defining Fentanyl Related Compounds for analysis.
For example, using scheme 1, fentanyl itself includes an ethyl at modification site R1, and 1-ethyl-2-phenyl at site R2. Using Scheme 1 and a maximum common substructure implemented in Osiris Data Warrior Software (openmolecules.org/datawarrior)18, 63 compounds were identified as FRCs in the NIST MS 17 EI Library, most of which are explicitly classified as fentanyl analogs in the literature.19,20 Fentanyl metabolites, such as norfentanyl analogs, were also identified in this process. A complete description of the identified compounds is provided as Appendix B.
The hit-list top ten of a SSS using Fentanyl as an ‘unknown’ query searched against the entire NIST 17 EI Library (removing the unknown spectrum itself) contains 8 FRCs, only 3 of which recorded match factors greater than 800. In comparison, the hit list top ten of the equivalent HSS contains 10 FRCs, all with match factors greater than 800. In fact, 18 of the top 20 hits of the HSS were FRCs with match factors greater than 800. Table 2 summarizes hit list statistics (number of FRCs in the hit list top ten, number of FRCs with scores greater than 800 in the hit-list top 20) for select FRCs queried against the NIST 17 EI Library using both the SSS and HSS.
Table 2.
Summary of hit list statistics when select Fentanyl Related Compounds (FRCs) are queried against the entire NIST 17 EI Library. H = Hybrid Similarity Search, S = Simple Similarity Search. Complete list of FRCs is provided in Appendix B.
| Query: Select Fentanyl Related
Compounds (FRC) Library: NIST 17 EI Library |
Structure Specifications using Scheme 1 | Hit list Stats | ||||||||
|---|---|---|---|---|---|---|---|---|---|---|
| n FRC in top 10 | n FRC > 800 in top 20 | |||||||||
| Ref. | Query Name: | MW | R1 | R2 | R3 | R4 | S | H | S | H |
| 1 | Lofentanil | 408 | -CH2CH3 | -CH2CH2Ph | -4-C(=O)OCH3; -3-CH3 | 0 | 3 | 0 | 1 | |
| 2 | Carfentanil | 394 | -CH2CH3 | -CH2CH2Ph | -4-C(=O)OCH3 | 0 | 5 | 0 | 1 | |
| 3 | Acryl fentanyl | 334 | -CH=CH2 | CH2CH2Ph | 1 | 8 | 0 | 10 | ||
| 4 | Cyclopentyl fentanyl | 376 | -cPentane | -CH2CH2Ph | 4 | 6 | 0 | 5 | ||
| 5 | para-Chloro fentanyl | 370 | -CH2CH3 | -CH2CH2Ph | -4-Cl | 1 | 7 | 0 | 6 | |
| 6 | Ocfentanil | 370 | -CH2OCH3 | -CH2CH2Ph | -2-F | 1 | 7 | 0 | 3 | |
| 7 | Butyrl fentanyl | 350 | -CH2CH2CH3 | -CH2CH2Ph | 6 | 9 | 1 | 10 | ||
| 8 | para-Fluorobutyryl fentanyl | 368 | -CH2CH2CH3 | -CH2CH2Ph | -4-F | 4 | 9 | 2 | 10 | |
| 9 | ortho-Fluorobutyryl fentanyl | 368 | -CH2CH2CH3 | -CH2CH2Ph | -2-F | 4 | 9 | 2 | 9 | |
| 10 | para-Fluorofentanyl | 354 | -CH2CH3 | -CH2CH2Ph | -4-F | 1 | 9 | 1 | 12 | |
| 11 | 3-Fluorofentanyl analog | 354 | -CH2CH3 | -CH2CH2Ph | -3-F | 5 | 10 | 1 | 13 | |
| 12 | 1-(2-phenylethyl)-4-(4-methyl-N- propananilido)piperidine | 350 | -CH2CH3 | -CH2CH2Ph | -4-CH3 | 7 | 10 | 3 | 10 | |
| 13 | 3 - Methylfentanyl | 350 | -CH2CH3 | -CH2CH2Ph | -3-CH3 | 5 | 10 | 3 | 11 | |
| 14 | Isobutyryl fentanyl | 350 | -CH(CH3)CH3 | -CH2CH2Ph | 5 | 10 | 1 | 10 | ||
| 15 | α -Methyl fentanyl | 350 | -CH2CH3 | -CH(CH3)CH2Ph | 5 | 6 | 0 | 2 | ||
| 16 | β-Methyl fentanyl | 350 | -CH2CH3 | -CH2CH(CH3)Ph | 7 | 10 | 3 | 8 | ||
| 17 | para-Methoxy fentanyl | 366 | -CH2CH3 | -CH2CH2Ph | -4-OCH3 | 1 | 9 | 0 | 9 | |
| 18 | Acetanilide, N-(1-phenethyl-4-piperidyl)- | 322 | -CH3 | -CH2CH2Ph | 5 | 10 | 4 | 15 | ||
| 19 | 1-(2-phenylethyl)-4-(4-methyl-N- acetanilido)piperidine | 336 | -CH3 | -CH2CH2Ph | -4-CH3 | 4 | 9 | 1 | 8 | |
| 20 | Fentanyl | 336 | -CH2CH3 | -CH2CH2Ph | 8 | 10 | 3 | 18 | ||
A total of 44 FRCs were considered in this analysis (listed in Appendix B). In no cases were fewer FRCs found in the hit list top ten by the HSS than the SSS search. In 39 of the 44 HSS searches more FRCs were found, all of which had 5 or more FRCs among the top 10 hits. In 12 cases, the entire top ten were FRCs. In comparison, 24 of the SSS hit lists contained greater than 5 fentanyl analogs in their list; none of the lists contained 10.
In the 5 queries where the hit lists of the HSS and SSS contained the same number of FRCs, the average match factor of FRCs identified using the HSS is 815 whereas the average score using the SSS is 699. This result demonstrates that the HSS matches more peaks (hence the higher average score).
The plots shown in Figure 6 provide an overview of relationship by spectral similarity score between the 44 FRCs. SSS results are shown in panel (a) while HSS are shown in panel (b). The clustering was completed using the hierarchical clustering algorithm with complete linkages available in base R21. Clustering with SSS scores results in many, small, well-defined clusters, where clusters primarily contain isomeric FRCs with similar fragmentation mechanisms. In contrast, clustering using the HSS Match Factors results in large clusters, where clusters contain a diverse collection of FRCs of different masses, most of which differ by a single modification. An example of this behavior is illustrated as Scheme 2, where DeltaMass and the hybrid match factor are computed using the arrow start and end points to indicate the query and library compounds, respectively, and FRCs are defined in Table 2.
Figure 6.
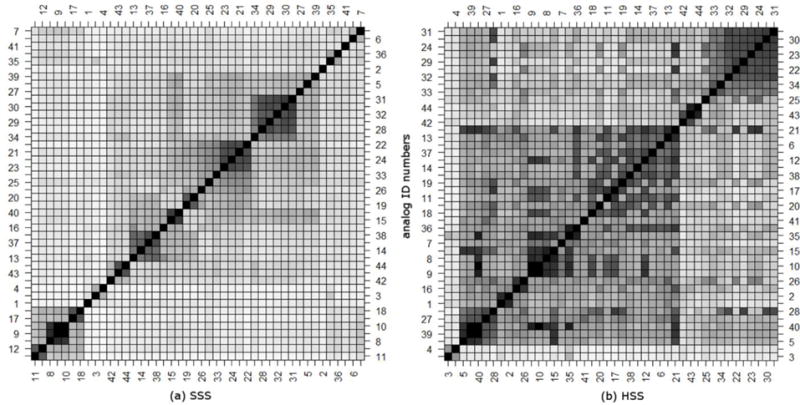
Summary of similarity clustering of fentanyl related compounds (FRCs) as computed using hierarchical clustering and both the (a)Simple (SSS) and (b) Hybrid Similarity Search (HSS) algorithms as distance measures. Darker squares indicate higher scores for the corresponding FRC pairs (x,y axes), which are represented by numbers and listed in Appendix B.
Scheme 2.
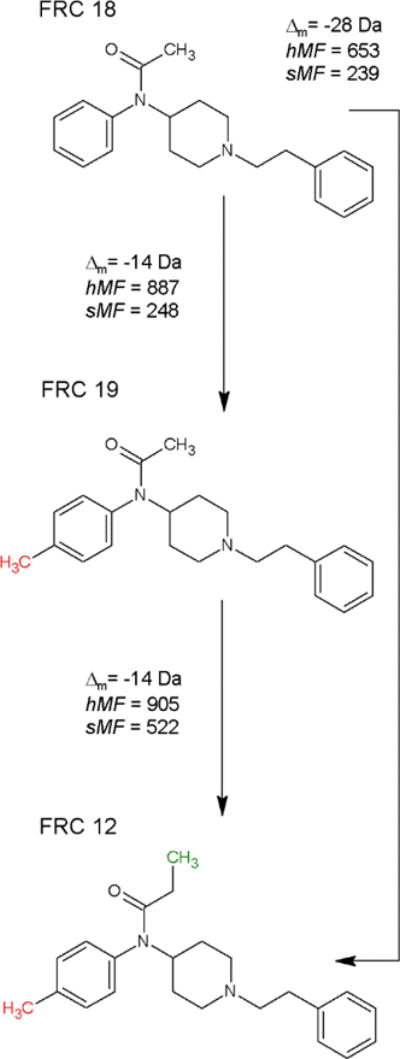
Scoring between types of fentanyl related compounds. FRC labeling is consistent with Table 2.
As expected, the single modification from FRC 18 to 19 produces a high HSS score between the two compounds, and the single modification from FRC 19 to 12 produces a high HSS score between those two compounds. Since there are two modifications required to transform between FRC 18 and 12, the HSS scores between these compounds is much lower. This behavior is the underlying origin of the clustering shown in Figure 6b.
Beyond a class identification, a key feature of the HSS algorithm is that its output can be used to aid chemical structure determination. This is illustrated using FRC 10 in Table 2 as the ‘unknown’ and five hits generated using a HSS provided as Table 4. The high hMF values and large differences between them and sMF values suggest that all compounds likely differ from the unknown by a localized chemical moiety, with different DeltaMass values showing that this moiety differs among the hits. The first DeltaMass value, 14 Da suggests that a methylene unit was inserted into the first library compound. The second value of 18 Da suggests that a fluorine atom replaced a hydrogen atom in fentanyl. The last three, differing by 4 Da, are consistent with the replacement of a methyl group in each library compounds by a fluorine atom in the unknown. All of these findings are consistent with compound 11 in Table 2, where the fluorine is on the ε-aromatic ring. The assessment of substructure corresponding to peak shifts was accomplished using MS Interpreter v3.1 available with NIST MS Search v2.315.
3.3. Search Scope and Performance
Although the examples in this manuscript focus on forensics applications, the hybrid search is a general procedure that can be applied to many cases of compounds. The key requirement is that the library being search contains similar compounds to the query. More precisely, the library must contain compounds that differ from the query by a discrete chemical group that does not greatly affect fragmentation. Examples of modifications that may fit this definition include alkylation, halogenation, acetylation, phenylation, silylation and other varieties of derivations.
Measurement noise is an important factor when discussing the performance of a library search. The types of noise that can affect a mass spectrum are varied, ranging from the instrumentation used to collect the spectrum to the chemical nature of the analyte. In general, however, the effect of noise on the computation of a hybrid match factor is comparable to its effect on simple match factors. An example computation of “random mass low abundance” noise effects computed match factors with a query of fentanyl is provided in Appendix A. A noisy spectrum altered the computed hybrid match factors between −20 and −42 points than a “clean” spectrum. Similarly, a noisy spectrum altered computed simple match factors between 6 and −85 points.
We also note that because of the high degree of non-uniformity of ‘small molecule’ search space1 as compared to the rather regular spectra of, for example, peptides, it does not appear possible to compute false discovery rates (FDR), as is common practice in proteomics22,23. Hundreds of ‘classes’ of compounds and distinct fragmentation behaviors are found among small molecules, preventing the application of this variety of statistical analysis. Moreover, a more thorough statistical analysis of the accuracy of the hybrid search would require a detailed chemical structure analysis of hits lists, which is beyond the scope of the present work.
3.4. Additional Application: Nominal Mass Identification
While use of the HSS requires the molecular mass of the search spectrum, the search itself can be used for estimating this value. The hybrid search will produce significantly higher scores when the correct molecular mass for the query spectrum is used and significant matching neutral loss peaks are present (i.e. the shift employed as DeltaMass is not an arbitrary value). Accordingly, the difference between HSS and SSS match factors should maximize when the assumed molecular mass entered is correct. To demonstrate this idea, we use the following expression to measure the extent of score elevation from application of the hybrid search for the top n hits:
| (3) |
which is simply the average increase in score for the top n hits scaled by the computed HSS match factor. This scaling places extra weight on hits with higher HSS scores, which are more likely to be correct. Making this measurement for hit lists generated over a series of nominal mass estimates, the correct nominal mass of the query can be identified by finding the estimate that gives a maximum Ωn value. This method is illustrated in Figure 7 for fentanyl, which lacks a molecular ion. The score improvement for the top ten members of the hit list, Ω10, changes as a function of nominal mass estimate for a query fentanyl. A local maximum is achieved at 336, which is the correct nominal mass of fentanyl. When neutral losses do not contribute to peak matching, little change will be observed over any mass range, and the hybrid search has no special value in making identifications. We should note that this method of nominal mass estimation method is still being evaluated/optimized for practical application.
Figure 7.
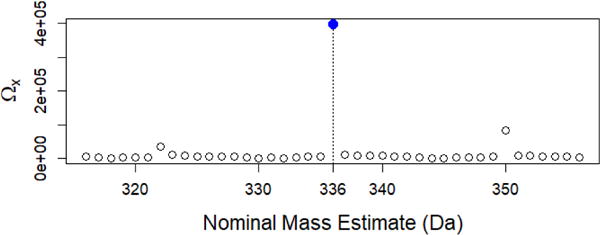
Change in ‘score spread’ as defined in (3) using a series of nominal mass estimates for query fentanyl. The correct nominal mass of fentanyl is 336, corresponding to the maximum ‘score spread’ in the tested domain.
4. Conclusions
The Hybrid Similarity Search is a novel search algorithm for extending the coverage of mass spectral libraries. The algorithm considers both fragment ions and neutral losses when computing similarity. In doing so, the Hybrid Similarity Search can classify and, under certain conditions, identify query compounds even when the spectrum of the query compound is not already contained in the library. Its principal drawback is that it requires the precursor mass of the query compound, although preliminary testing suggest that it can assist in the determination of this quantity. In addition, the Hybrid Similarity Search can also assist in the determination of fragmentation mechanisms. Finally, we note that a similar algorithm has been shown to identify modifications in peptide identifications for proteomics and work is underway in demonstrating the applicability to high mass accuracy tandem spectra in small molecule LC/MS-MS experiments.
Table 3.
Hit list produced doing hybrid search of para-fluorofentanyl (Entry 10 in Table 2) spectrum in the NIST 17 EI Library.
| Name | HSS rank | hMF | Δm (Da) | SSS rank | sMF |
|---|---|---|---|---|---|
| 3-fluorofentanyl acetal analog | 1 | 968 | 14 | >100 | 394 |
| Fentanyl | 2 | 925 | 18 | >100 | 118 |
| Fentanyl para-tolyl analog | 3 | 901 | 4 | >100 | 117 |
| 3-methyl fentanyl | 5 | 899 | 4 | >100 | 110 |
| Fentanyl meta-tolyl analog | 7 | 897 | 4 | >100 | 106 |
Acknowledgments
The authors would like to thank Drs. Brian Cooper, Gary Mallard and Kirill Tretyakov for their fruitful discussion.
Appendix A: Example Calculations and Effect of Noise on Match Factors
A general description of match factor computations used in spectral similarity search algorithms is provided in the primary manuscript. To complement that general description, we have included three detailed constructions of “Hybrid Spectra” and numerical computations of match factors to aid readers interested in extending or implementing custom versions of the Simple Similarity or Hybrid Similarity Searches. An additional example demonstrating the effect of noise on match factor computations is also provided.
Example 1
Assume we have a query spectrum with exactly two peaks at mass 15 Da and 25 Da with intensities of 100 and 999, respectively. This can be presented concisely as:
Assume further that the nominal mass of the query compound is 25 Da. A library compound with two peaks is as follows:
The nominal mass of the library compound is 50 Da. The simple match factor between this query and library pairing is:
The simplicity of this calculation, as well as the small value of this match factor, is due to there being only one shared fragment among the query and library spectra – the fragment peak at mass 15 Da.
Computation of a Hybrid Match Factor requires the construction of a Hybrid Spectrum (H). This non-physical spectrum is created by comparing peaks in the query spectrum to those from the library spectrum that have been shifted by DeltaMass, and assessing whether the shifted peaks improve the computed match factor. DeltaMass is the nominal mass difference between the query compound and library compound. Using the same example compounds and spectra, DeltaMass is −25 Da. Accordingly, the Hybrid Spectrum would be constructed as follows:
Notice that in the case of the first library peak (15 Da), the shift by DeltaMass results in a peak that is physically impossible, and does not improve correspondence with the query spectrum. In the case of the second peak, the shift results in improved correspondence with the query spectrum. The computed Hybrid Match Factor:
Example 2
Consider the query spectrum:
The nominal mass of this query compound is 91 Da. A library compound is:
The nominal mass of the library compound is 105 Da. The simple match factor between query and library spectra is
For this pair of compounds, DeltaMass would be −14 Da. A Hybrid Spectrum constructed from these query and library spectra:
where the choice between original and shifted library peak is made by determining which has better correspondence with the query spectrum. The computed hybrid match factor is then
Example 3
A slightly more complicated scenario arises when original and shifted peaks from the library spectrum correspond with peaks from the query spectrum. An example of this scenario arises when computing the spectral similarity of 4-fluoro-1,2-diphenylethane and 1,2-diphenylethane as discussed in Figure 3 of the main manuscript.
For this pair of compounds, DeltaMass is 18 Da. Rather than show peak-by-peak construction of the hybrid spectrum as we had for the previous examples, we highlight where peaks in the query spectrum match both original and shifted peaks from the library spectrum.
The peaks at 39, 65, 89 and 91 Da in the query spectrum have corresponding library peaks at those same masses. Additionally, peaks from the query spectrum at 57, 83, 107, and 109 would match the same library peaks if we consider shifts of DeltaMass. In our implementation of the hybrid search, this scenario is resolved by apportioning the abundance of the library peak between its original fragment mass and the shifted mass such that the total abundance is conserved and the computed match factor is optimized when creating the hybrid spectrum.
We note that this is the approach of our implementation of the hybrid search and appears to provide expected results. However, alternative strategies may provide reasonable results as well.
Example 4: Effect of Noise
In this section we show that ‘noise’ is not expected to have any special effect on the hybrid versus a conventional score. For this purpose, we use a good quality spectrum of fentanyl (a) versus a ‘noisy’ spectrum (b) shown as Figure A1. The match factor between clean fentanyl (a) and the fentanyl spectrum contained in the NIST 17 EI Library is 974. The match factor between the noisy fentanyl (b) and that contained in the library is lower by 44 points.
Figure A1.
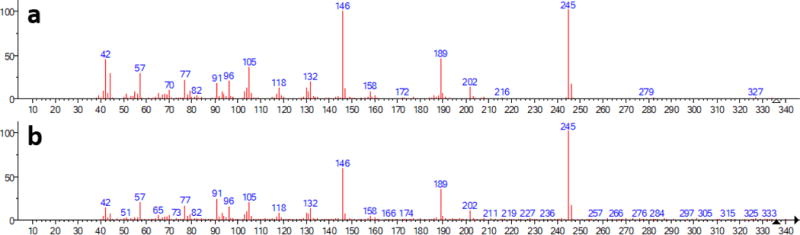
Fentanyl spectra considered in this example, where (a) is a ‘clean’ reading, and (b) is a ‘noisy’ spectrum.
The simple match factor (sMF) for these spectra with the library spectra for 3-methylfentanyl is 378 for fentanyl (a) and 30 points lower for noisy spectrum (b). The hybrid match factor (hMF) between the ‘clean’ fentanyl (a) and 3-methyfentanyl is 968, and the hMF using the ‘noisy’ fentanyl (b) is 20 points lower. Table A1 shows changes in match factors due to noise for the fentanyl spectra from Figure A1 searched against fentanyl related spectra in the NIST 17 EI library. Taken together, these results demonstrate that the effect of noise on computed match factors is modest and comparable regardless of method (simple vs hybrid).
Table A1.
Summary of change in computed hybrid match factors (ShMF), and simple match factors (SsMF) due to noise when fentanyl is searched against select fentanyl related compounds from the NIST 17 EI Library.
| Library Compound | ShMF | SsMF | |
|---|---|---|---|
| 1 | 3 -methylfentanyl | −20 | −30 |
| 2 | 3 -fluorofentanyl analog | −28 | 6 |
| 3 | valeryl fentanyl | −37 | −73 |
| 4 | butyrylfentanyl | −42 | −85 |
| 5 | 1-[2-(3 -methylphenyl)ehtyl]-4 -(N-propanilido)piperdine | −33 | −40 |
| 6 | Propanamide, N-Phenyl-N-p1 -(2-(4-methylphenyl)ethyl)- | −32 | −30 |
| 7 | para-Methoxyfentanyl | −36 | −17 |
| 8 | β-methylfentanyl | −14 | −10 |
| 9 | cyclopentylfentanyl | −32 | −72 |
| 10 | acryfentanyl | −29 | −67 |
Appendix B: Fentanyl Related Compounds in the NIST 17 Main Library
A total of 63 compounds were defined as Fentanyl Related Compounds (FRCs) using a maximum common substructure search in the NIST 17 Mass Spectral Main Library and Scheme 1 from the main manuscript. Many of these compounds are clearly related to fentanyl, consistent with findings in literature. Nineteen additional compounds were captured as FRCs during the maximum common substructure search that were either (1) Lorcainide and related compounds, (2) Norfentanyl and related compounds, or (3) Fentanyl derivatives developed for laboratory assessment (e.g. 4-Anlino-1-benzylpiperidine, N-heptafluorobutyrl-). These compounds were removed from the study, resulting in 44 FRCs used for analysis of the hybrid search documented in this Appendix and the main manuscript. The 44 FRCs and their hybrid search results are detailed in Table B1.
Table B1.
Summary of hit list statistics when Fentanyl Related Compounds (FRCs) are queried against the entire NIST 17 Main Library. H = Hybrid Similarity Search, S = Simple Similarity Search. Ambiguous structural symbols defined below table.
| Query: Fentany1 Related
Compounds (FRC) of interest Library: NIST 17 Main Library |
Structure Specifications using Scheme I | Hit list Stats | ||||||||
|---|---|---|---|---|---|---|---|---|---|---|
| n FRC in top 10 | n FRC > 800 in top 20 | |||||||||
| Ref. | Query Name: | MW | R1 | R2 | R3 | R4 | S | H | S | H |
| 1 | Lofentanil | 408 | -CH2CH3 | -CH2CH2Ph | -4-C(=O)OCH3;-3-CH3 | 0 | 3 | 0 | 1 | |
| 2 | Carfentanil | 394 | -CH2CH3 | -CH2CH2Ph | -4-C(=O)OCH3 | 0 | 5 | 0 | 1 | |
| 3 | Sufentanil | 386 | -CH2CH3 | -CH2CH2-thiofuran | -CH2OCH3 | 1 | 1 | 0 | 0 | |
| 4 | Propanamide, N-(1-(2-(4-ethyl-4,5-dihydro-5-oxo- 1H-tetrazol-1-yl)ethyl)-4-(methoxymethyl)-4- piperidinyl)-N-phenyl- | 416 | -CH2CH3 | -CH2CH2
|
-CH2OCH3 | 1 | 1 | 0 | 0 | |
| 5 | Cyclopentyl fentanyl | 376 | -cPentane | -CH2CH2Ph | 4 | 6 | 0 | 5 | ||
| 6 | p ara-Chlorofentanyl | 370 | -CH2CH3 | -CH2CH2Ph | -4-CI | 1 | 7 | 0 | 6 | |
| 7 | Ocfentanil | 370 | -CH2OCH3 | -CH2CH2Ph | -2-F | 1 | 7 | 0 | 3 | |
| 8 | FIBF | 368 | -CH(CH3)CH3 | -CH2CH2Ph | -4-F | 4 | 10 | 2 | 10 | |
| 9 | para-Fluorobutyryl fentanyl | 368 | -CH2CH2CH3 | -CH2CH2Ph | -4-F | 4 | 9 | 2 | 10 | |
| 10 | ortho-Fluorobutyryl fentanyl | 368 | -CH2CH2CH3 | -CH2CH2Ph | -2-F | 4 | 9 | 2 | 9 | |
| 11 | Para-fluorofentanyl | 354 | -CH2CH3 | -CH2CH2Ph | -4-F | 1 | 9 | 1 | 12 | |
| 12 | 3-Fluorofentanyl analog | 354 | -CH2CH3 | -CH2CH2Ph | -3-F | 5 | 10 | 1 | 13 | |
| 13 | 3-Methylfentanyl | 350 | -CH2CH3 | -CH2CH2Ph | -3-CH3 | 5 | 10 | 3 | 11 | |
| 14 | Propanamide, N-(2-methylphenyl)-N-[1-(2- phenylethyl)-4-piperidinyl]- | 350 | -CH2CH3 | -CH2CH2Ph | -2-CH3 | 5 | 9 | 3 | 9 | |
| 15 | Isobutyryl fentanyl | 350 | -CH(CH3)CH3 | -CH2CH2Ph | 5 | 10 | 1 | 10 | ||
| 16 | α-Methylfentanyl | 350 | -CH2CH3 | -CH(CH3)CH2Ph | 5 | 6 | 0 | 2 | ||
| 17 | 3-Fluorofentanyl acetyl analog | 340 | -CH3 | -CH2CH2Ph | -3-F | 1 | 9 | 1 | 9 | |
| 18 | 2-Fluorofentanyl acetyl analog | 340 | -CH3 | -CH2CH2Ph | -2-F | 5 | 8 | 1 | 9 | |
| 19 | 1-(2-phenylethyl)-4-(2-methyl-N- acetanilido)piperidine | 336 | -CH3 | -CH2CH2Ph | -2-CH3 | 5 | 9 | 1 | 9 | |
| 20 | 1-(2-phenylethyl)-4-(4-methyl-N- acetanilido)piperidine | 336 | -CH3 | -CH2CH2Ph | -4-CH3 | 4 | 9 | 1 | 8 | |
| 21 | Fentanyl | 336 | -CH2CH3 | -CH2CH2Ph | 8 | 10 | 3 | 18 | ||
| 22 | β-Methylfentanyl | 350 | -CH2CH3 | -CH2CH(CH3)Ph | 7 | 10 | 3 | 8 | ||
| 23 | Propanamide, N-Phenyl-N-[1-(2-(4- methylphenyl)ethyl)-4-piperidinyl]- | 350 | -CH2CH3 | -CH2CH2Ph-4-CH3 | 7 | 10 | 3 | 8 | ||
| 24 | 1-[2-(3-methylphenyl)ethyl]-4-(N- propanilido)piperidine | 350 | -CH2CH3 | -CH2CH2Ph-3-CH3 | 7 | 10 | 3 | 9 | ||
| 25 | β-Hydroxy thiofentanyl | 358 | -CH2CH3 | -CH2CH(OH)-thiofuran | 6 | 6 | 0 | 1 | ||
| 26 | α-Methylfentanyl acetyl analog | 336 | -CH3 | -CH(CH3)CH2Ph | 7 | 8 | 0 | 3 | ||
| 27 | Acrylfentanyl | 334 | -CH=CH2 | -CH2CH2Ph | 1 | 8 | 0 | 10 | ||
| 28 | Acetanilide, N-(1-phenethyl-4-piperidyl)- | 322 | -CH3 | -CH2CH2Ph | 5 | 10 | 4 | 15 | ||
| 29 | Acetamide, N-pheny l-N-[1-(1-phenyl-2-propyl)-4- piperidinyl]- | 336 | -CH3 | -CH2CH(CH3)Ph | 5 | 9 | 4 | 7 | ||
| 30 | Acetyl fentanyl 4-methylphenethyl analog | 336 | -CH3 | -CH2CH2Ph-4-CH3 | 5 | 9 | 4 | 8 | ||
| 31 | 1-[2-(2-methylphenyl)ethyl]-4-(N- acetanilido)piperidine | 336 | -CH3 | -CH2CH2Ph-2-CH3 | 5 | 9 | 4 | 8 | ||
| 32 | 1-[2-(3-methylphenyl)ethyl]-4-(N- acetanilido)piperidine | 336 | -CH3 | -CH2CH2Ph-3-CH3 | 5 | 9 | 4 | 7 | ||
| 33 | Propanamide, N-phenyl-N-[1-(3-phenyl)propyl-4- piperidinyl]- | 350 | -CH2CH3 | -CH2CH2CH2Ph | 8 | 10 | 0 | 4 | ||
| 34 | Acetamide, N-pheny l-N-[1-(3-phenyl)propyl-4- piperidinyl]- | 336 | -CH3 | -CH2CH2CH2Ph | 5 | 9 | 0 | 5 | ||
| 35 | 4-Methoxy-butyryl fentanyl | 380 | -CH2CH2CH3 | -CH2CH2Ph | 4-OCH3 | 1 | 8 | 0 | 7 | |
| 36 | para-Methoxy fentanyl | 366 | -CH2CH3 | -CH2CH2Ph | 4-OCH3 | 1 | 9 | 0 | 9 | |
| 37 | Propanamide, N-(3-methylphenyl)-N-[1-(2- phenylethyl)-4-piperidinyl]- | 350 | -CH2CH3 | -CH2CH2Ph | 3-CH3 | 7 | 10 | 3 | 10 | |
| 38 | 1-(2-phenylethyl)-4-(4-methyl-N- propananilido)piperidine | 350 | -CH2CH3 | -CH2CH2Ph | 4-CH3 | 7 | 10 | 3 | 10 | |
| 39 | Valeryl fentanyl | 364 | -CH2CH2CH2CH3 | -CH2CH2Ph | 5 | 6 | 0 | 6 | ||
| 40 | butyrlfentanyl | 350 | -CH2CH2CH3 | -CH2CH2Ph | 6 | 9 | 1 | 10 | ||
| 41 | Furanylfentanyl | 374 | -furan | -CH2CH2Ph | 0 | 5 | 0 | 2 | ||
| 42 | Benzyl Carfentanil | 380 | -CH2CH3 | -CH2Ph | -4-C(=O)-OCH3 | 2 | 2 | 0 | 1 | |
| 43 | Propanamide, N-phenyl-N-[1-(phenylmethyl)-4- piperidinyl]- | 322 | -CH2CH3 | -CH2Ph | 4 | 5 | 4 | 5 | ||
| 44 | Acetamide, N-pheny l-N-[1-(phenylmethyl)-4- piperidinyl]- | 308 | -CH3 | -CH2Ph | 4 | 4 | 4 | 4 | ||
References
- 1.Stein SE. Anal Chem. 2012;84:7274–7282. doi: 10.1021/ac301205z. [DOI] [PubMed] [Google Scholar]
- 2.Zemany PD. Anal Chem. 1950;22:920–922. [Google Scholar]
- 3.Sparkman OD. J Am Soc Mass Spectrom. 1996;7(4):313–318. doi: 10.1016/1044-0305(95)00705-9. [DOI] [PubMed] [Google Scholar]
- 4.McLafferty FW, Hertel RH, Villwock RD. Org Mass Spectrom. 1974;9:690–702. [Google Scholar]
- 5.Stein SE. J Am Soc Mass Spectrom. 1994;5:316–323. doi: 10.1016/1044-0305(94)85022-4. [DOI] [PubMed] [Google Scholar]
- 6.Stein SE, Scott DR. J Am Soc Mass Spectrom. 1994;5:859–866. doi: 10.1016/1044-0305(94)87009-8. [DOI] [PubMed] [Google Scholar]
- 7.Wei X, Koo I, Kim S, Zhang X. Analyst. 2014;139:2507–2514. doi: 10.1039/c3an02171h. [DOI] [PMC free article] [PubMed] [Google Scholar]
- 8.Wallace WE, Ji W, Tchekhovskoi DV, Phinney KW, Stein SE. J Am Soc Mass Spectrom. 2017;28:733–738. doi: 10.1007/s13361-016-1589-4. [DOI] [PMC free article] [PubMed] [Google Scholar]
- 9.Willard MAB, McGuffin VL, Smith RW. Forensic Sci Int. 2017;270:111–120. doi: 10.1016/j.forsciint.2016.11.013. [DOI] [PubMed] [Google Scholar]
- 10.Reitzel LA, Dalsgaard PW, Müller IB, Cornett C. Drug Test Anal. 2012;4:342–354. doi: 10.1002/dta.358. [DOI] [PubMed] [Google Scholar]
- 11.Kim S, Koo I, Wei X, Zhang X. Bioinformatics. 2012;28:1158–1163. doi: 10.1093/bioinformatics/bts083. [DOI] [PMC free article] [PubMed] [Google Scholar]
- 12.Biemann K. Tetrahedron Lett. 1960:9–14. [Google Scholar]
- 13.Biemann K. Mass Spectrometry: Organic Chemical Applications. McGraw-Hill Book Company; New York: 1962. p. 308. [Google Scholar]
- 14.Stein SE. J Am Soc Mass Spectrom. 1995;6:644–655. doi: 10.1016/1044-0305(95)00291-K. [DOI] [PubMed] [Google Scholar]
- 15.Stein SE. NIST/EPA/NIH Mass Spectral Library (NIST 17) and NIST Mass Spectral Spectral Search Program (Version 2.3) User Manual [Google Scholar]
- 16.Mass Spectrometry Data Center. NIST; http://chemdata.nist.gov/ (accessed: July 20, 2017) [Google Scholar]
- 17.Burke MC, Mirokhin YA, Tchekhovskoi DV, Markey SP, Heidbrink Thompson J, Larkin C, Stein SE. J Proteome Res. 2017;16:1924–1935. doi: 10.1021/acs.jproteome.6b00988. [DOI] [PubMed] [Google Scholar]
- 18.Sander T, Freyss J, Von Korff M, Rufener C. J Chem Inf Model. 2015;55:460–473. doi: 10.1021/ci500588j. [DOI] [PubMed] [Google Scholar]
- 19.Higashikawa Y, Suzuki S. Forensic Toxicol. 2008;26:1–5. [Google Scholar]
- 20.Ohta H, Suzuki S, Ogasawara K. J Anal Toxicol. 1999;23:280–285. doi: 10.1093/jat/23.4.280. [DOI] [PubMed] [Google Scholar]
- 21.R Core Team. R: A Language and Environment for Statistical Computing. Vienna, Austria: 2016. [Google Scholar]
- 22.Jeong K, Kim S, Bandeira N. BMC Bioinformatics. 2012;13:S2. doi: 10.1186/1471-2105-13-S16-S2. [DOI] [PMC free article] [PubMed] [Google Scholar]
- 23.Elias JE, Gygi SP. Proteome Bioinforma. 2010:55–71. [Google Scholar]