Abstract
Many researchers used National Health Insurance database to publish medical papers which are often retrospective, population-based, and cohort studies. However, the author's research domain and academic characteristics are still unclear.
By searching the PubMed database (Pubmed.com), we used the keyword of [Taiwan] and [National Health Insurance Research Database], then downloaded 2913 articles published from 1995 to 2017. Social network analysis (SNA), Gini coefficient, and Google Maps were applied to gather these data for visualizing: the most productive author; the pattern of coauthor collaboration teams; and the author's research domain denoted by abstract keywords and Pubmed MESH (medical subject heading) terms.
Utilizing the 2913 papers from Taiwan's National Health Insurance database, we chose the top 10 research teams shown on Google Maps and analyzed one author (Dr. Kao) who published 149 papers in the database in 2015. In the past 15 years, we found Dr. Kao had 2987 connections with other coauthors from 13 research teams. The cooccurrence abstract keywords with the highest frequency are cohort study and National Health Insurance Research Database. The most coexistent MESH terms are tomography, X-ray computed, and positron-emission tomography. The strength of the author research distinct domain is very low (Gini < 0.40).
SNA incorporated with Google Maps and Gini coefficient provides insight into the relationships between entities. The results obtained in this study can be applied for a comprehensive understanding of other productive authors in the field of academics.
Keywords: authorship collaboration, Google Maps, Medline library, National Health Insurance Database, social network analysis
Key Points
Using Google maps to show geographical presentations are rarely seen in previous papers.
A focused research domain by the most productive author can be displayed on Google Maps.
A scientific and objective way to recognize an author who published many papers in Medline library.
1. Introduction
As of October 31, 2017, over 57,852 papers can be found on Pubmed.com by searching for the keyword [Health Insurance data], and 29 papers were found with the keywords (“Eur J Intern Med”[Journal]) and [Health Insurance data] in the past years. If we added an additional keyword [Taiwan] in above searches, 3098 and 24 papers can be found respectively. Many authors have conducted a retrospective, population-based, and cohort study utilizing the National Health Insurance Research Database (NHIRD).[1]
In essence, a disease group was established using NHIRD. Each patient was selected by frequency matching according to age, gender, and comorbidities without the study disease from the general population to form a control group. Logistic regression analysis is commonly performed to estimate the influences on the disease risk.[2] Many papers had thus applied similar formatting to their NHIRD studies.
Hampson and Weaver[1] criticized these researchers appears to be a template without hypothesis-driven from one study model and unhelpful to the clinician because each paper just described 2 conditions that were associated in NHIRD and is often with no apparent connection to medical practice. Hampson and Weaver illustrated one paper that was published in 2016 “Examining the diagnosis of other diseases following an episode of CO poisoning.”[2] Following 4 CO publications[3–6] from the same research team were found in other journals published in 2015, using the same research model and database.[2–4,7]
An apocryphal story often told to illustrate data mining concepts is about beer and diaper sales in a supermarket. It is based on both beer and diaper sales, which are strongly correlated.[8–10] All possible pairs of cooccurrence diseases can be found in search of the sets of patient's diagnosis using social network analysis (SNA).[11–14] Thus, the present study is interested in using SNA to analyze the most productive author mentioned by Hampson and Weaver.[1]
The objectives of this study are to apply SNA and Google Maps to visualize: the most productive author using Taiwan's NHIRD; the pattern of the target coauthor collaboration; and the author research domain denoted by abstract keywords and Pubmed MESH (medical subject heading) terms.
2. Methods
2.1. Data source
By searching the PubMed database (Pubmed.org) maintained by the US National Library of Medicine, National Institutes of Health, we used the keywords of [Taiwan] and [National Health Insurance Research Database] on October 7, 2017, and downloaded 2913 articles that are published from 1995 to 2017. An author-made Microsoft Excel VBA (visual basic for application) module was used to analyze and present the contents and research results. All downloaded abstracts are based on the type of Journal Article. The prerequisite condition for a paper is at least 1 author from Taiwan. The target author is Chia-Hung Kao who was mentioned by Hampson and Weaver,[1] see the Additional File 1. All data used in this study were downloaded from Pubmed library, which means the study is not necessary for the ethical approval according to the regulation promulgated by Taiwan Ministry of Health and Welfare.
2.2. Social network analysis using Pajek software
In keeping with the Pajek guidelines[15] using SNA, we defined an author (or paper keyword or Pubmed MESH) as a node (or an actor) that is connected to another counterpart at another node through the edge of a line. Usually another weight is defined by the number of connections between 2 nodes.
The Pajek procedures are described as follows:
-
(1)
Selecting a control file; a specific control file can be opened through the path File>Read project file>selecting the file (e.g., D:\pajek\NHIRD.net).
-
(2)
Clustered analysis by selecting commands: Network>Create partition>Community.
-
(3)
Computing centrality values through commands: Network>Create vector>Centrality>Weighted Degree>All.
-
(4)
Drawing a network selecting: Draw>Network+first partition+first vector.
-
(5)
In the drawing window, selecting Layout>Energy>Kamada-Kawai>Separate components, the visualized presentation displays the key nation immediately on the computer screen, see the Additional File 2.
Centrality is an important index to analyze the network. Any individual or keyword lies in the center of the social network will determine its influence on the network and its speed to gain information.[14] Degree centrality is used in this study.
2.3. Ways to create Google Maps joined with SNA
The centrality measures are computed by SNA algorithm in Pajek. We included them in an author-made Excel module to create a page of Hyper Text Mark-up Language (HTML) used for Google Maps.
2.4. Using bootstrap to calculate Gini coefficient and its 95% confidence intervals
Statistically, bootstrapping relies on random sampling with replacement to gain 95% confidence intervals (CI) for data. Bootstrapping allows assigning measurement of accuracy (defined in terms of bias, variance, confidence intervals, prediction error, or some other such measurement) to sample estimates.[16] This technique allows estimation of the sampling distribution of almost any statistics using random sampling methods.[17] Gini coefficient[18] is used to measure the strength of a role in a network: the higher, the Gini; the stronger is the role in the network. The CIs of Gini coefficient are computed by the bootstrapping method when the highest value of the target node is constantly involved in the simulation dataset. We performed 1000 repetitions based on a constant number of sample (=100) for each bootstrapping because Gini coefficient is dependent on the number of calculated sample, see the Additional File 3. The fewer number of the data, the lower Gini coefficient will be.
3. Results
3.1. The most productive author using Taiwan's NHIRD
Authors from Taiwan using NHIRD to publish papers in Medline have formed 10 clusters (or say research teams) shown in Fig. 1. The most productive author is Tzeng-Ji Chen shown in the top left side in Fig. 1. Dr. Kao mentioned by Hampson and Weaver[1] follows at the middle top cluster. Interested readers are recommended to click the link[19] and looked at the details with Zoom-in and Zoom-out functionality.
Figure 1.
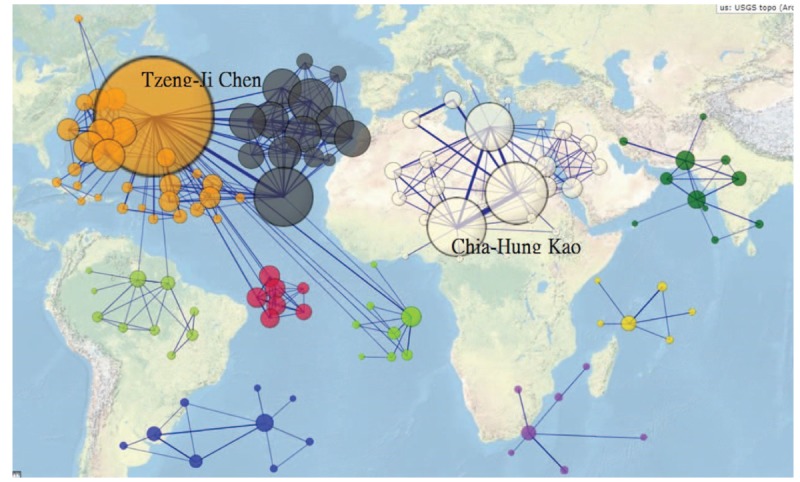
Top 10 clusters of authors in Taiwan regarding publications on Medline using Taiwan's National Health Insurance Research database (n = 126, max. size = 1016, Gini = 0.31).
3.2. The pattern of the target coauthor collaboration
A PubMed search on October in 2017, revealed that Dr. Kau published 594 articles from the same database analysis since 2002. The highest number of journal papers was in the field of Medicine (Baltimore), see Table 1. Dr. Kau published 149 papers in 2015. The pattern of coauthor collaboration led by Dr. Kau was shown with 2978 edges connecting other coauthors, see Fig. 2.[20]
Table 1.
The number of trends in Kao's publications across the years.
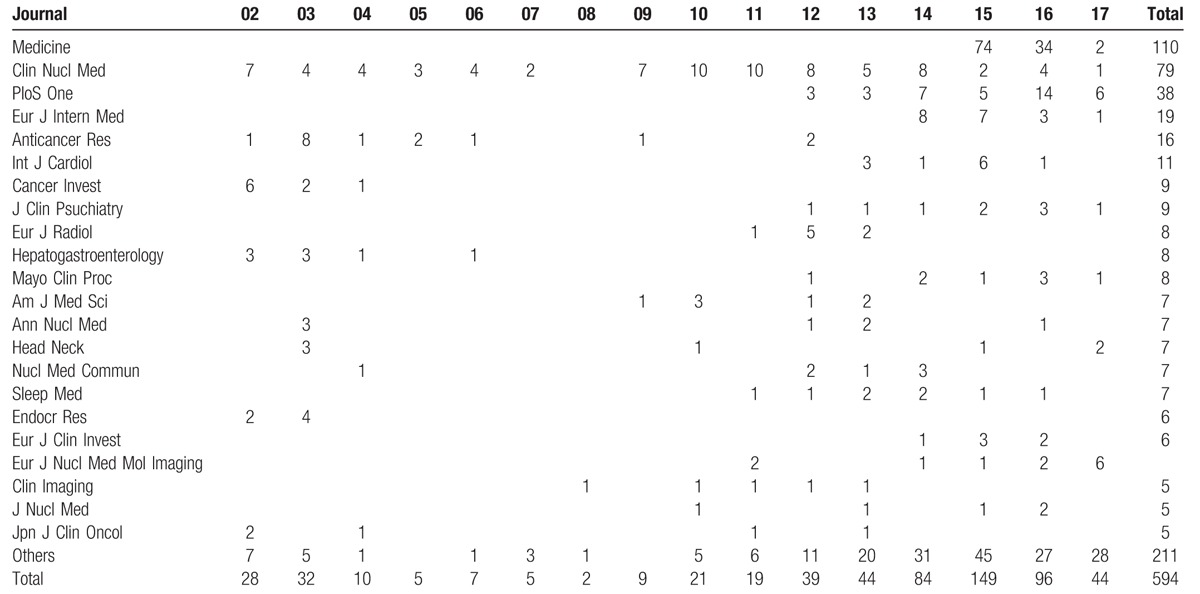
Figure 2.
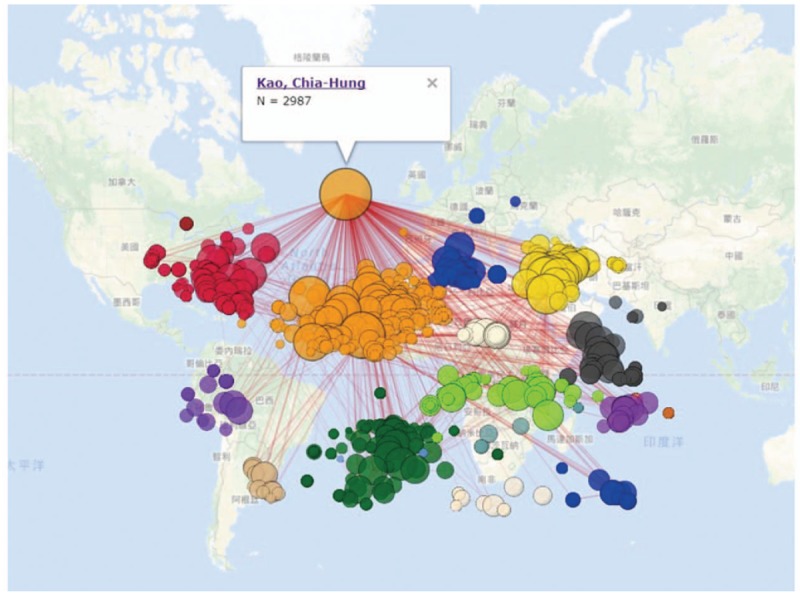
Coauthor collaboration related to Dr. Kao's 595 published papers on Medline (n = 747, max. size = 2987, Gini = 0.39).
3.3. The research domain denoted by abstract keywords and MESH terms
Dr. Kau's research domain can be identified in Fig. 3.[21] We can see that the cooccurrence abstract keywords with the highest frequency are cohort study and NHIRD. The most coexistent MESH terms are tomography, X-ray computed, and positron-emission tomography, see Fig. 4.[22]
Figure 3.
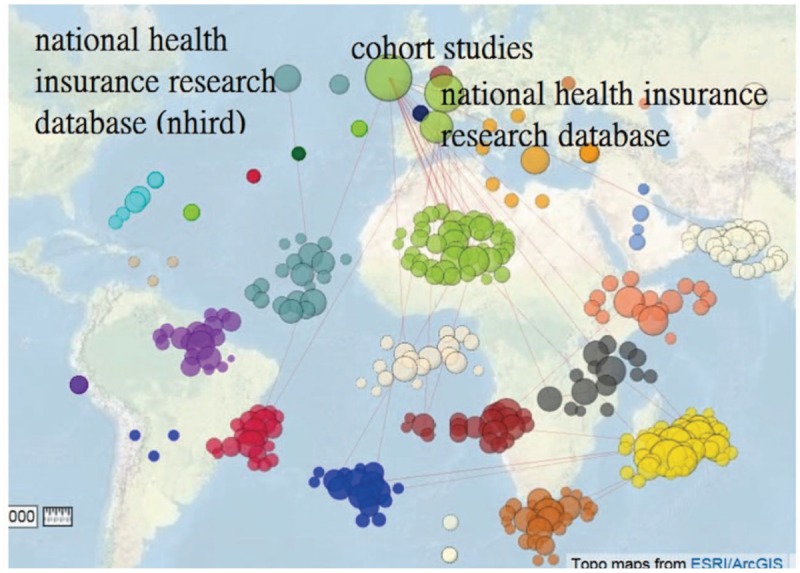
Abstract keywords related to Dr. Kao's 595 published papers on Medline (n = 368, max. size = 109, Gini = 0.36).
Figure 4.
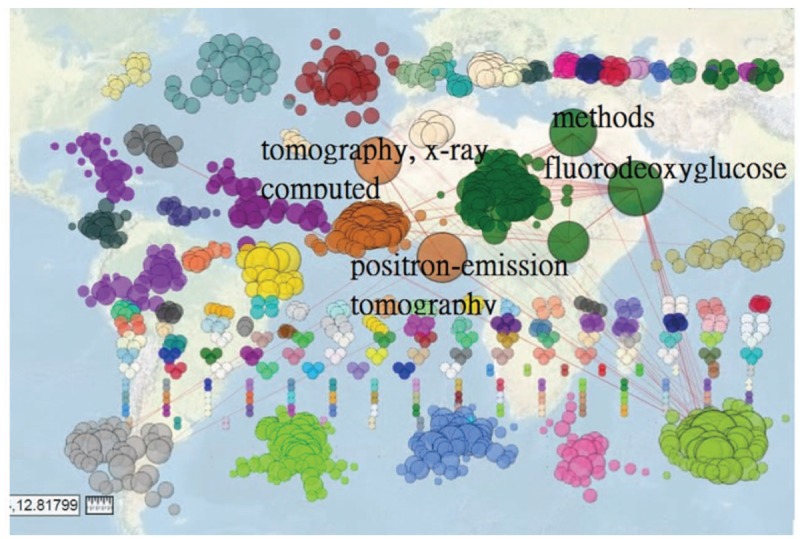
Article Mesh terms related to Dr. Kao's 595 published papers on Medline (n = 20/1340, max. size = 316, Gini = 0.47).
3.4. Gini coefficient and its 95% confidence intervals
The Gini coefficients demonstrated in figures are 0.31 (95% CI: 0.23, 0.39), 0.59 (95% CI: 0.50, 0.68), 0.36 (95% CI: 0.27, 0.36), 0.47 (95% CI: 0.40, 0.54), respectively. We can see that the strength of the author (Dr. Kao) research domain is very mild and trivial.
4. Discussion
Comorbidity is defined in medicine as existing simultaneously with and usually independently of another medical condition. As for cancer patient care, psychological distress problems are often comorbid with and can usually complicate the treatment of patients with breast cancer.[20] A chronic pain problem is also common and often cooccurs with other anxiety problems.[23,24] In many situations, it is very hard to observe the association of 2 or more symptoms at 1 moment.
Many authors recently use NHIRD to categorize a disease group. Each patient was selected by frequency matching according to age, gender, and comorbidities without the study of disease from the general population to form a control group. Logistic regression analysis is commonly performed to estimate the influences on the disease risk.[2] Through the visualize representations in figures, we can see that any 2 groups can be significantly separated from each other using SNA if we apply the patient disease sets. It is similar to the apocryphal story separating beer and diaper as a close group with a strong correlation in a supermarket.[8–10] The way they used in data mining and the SNA algorithm displayed in this study.
We particularly incorporated SNA with Google Maps which was never seen in the previous papers. This study discovered that the top 10 research teams are shown on Google Maps. Links[19–22] that can be manipulated by readers to see details and changes of interest for any focused target.
The productive author (Dr. Kao) published 149 papers in 2015, which is different from 151 pieces mentioned by Hampson and Weaver.[1] The main reason for the difference is possibly attributable to the journal articles particularly selected by the present study.
In the past 15 years, we found Dr. Kao had 2987 connections with other coauthors from 13 research teams. If we apply SNA to any dual couple in a group using NHIRD, it can be anticipated that the 2 groups will be significantly separated apart from each other. Future studies are encouraged to perform them using SNA in NHIRD.
The cooccurrence abstract keywords with the highest frequency are cohort study and NHIRD. We can see that the most coexistent MESH terms (i.e., tomography, X-ray computed, and positron-emission tomography) are clearer and more understandable than using traditional author-defined keywords. However, the Gini coefficients in both figures are very low, indicating the author's research domain is not strengthened in a specific area.
Similarly, there is no any particular big bubble-sized focusing on Dr. Kao's research domain in figures. It might be the reason that Dr. Kao published a variety of topics. No such fascination can be represented on Dr. Kao's research domain in terms of his Gini coefficients. Using SNA incorporated with Gini coefficient to explore and measure author's research domain is merit presented in academics.
We used SNA to analyze coauthor collaboration and research domain for a particular author; this is different from the approaches applied in other studies on health issues.[25,26] Although entities are not located relative to the countries which coordinate on Google Maps, we imported the coordinates from Pajek software and then transformed them into Google coordinates, see Additional File 1. The clusters can be gathered in colors and sizes on Google Maps with a hyperlink. It is worth developing as new concepts and approaches for readers in future studies.
This study has several limitations. First, all data were extracted from the PubMed database (Pubmed.com). Some papers without complete information have yet to be included in this study. Therefore, the results such as those shown in figures may affect the overall study results and inferences. Second, many algorithms can be used for SNA. We merely applied the algorithm of degree centrality shown in the figures. Any changes in the algorithm used will present a different pattern and judgment. Third, SNA is not subjected to the Pajeck software package used in this study; other software such as Ucinet[27] and Gephi[28] are recommended for use in future studies on other topics plotting diagrams on Google Maps.
In conclusion, these findings demonstrate that the SNA combined with Google Maps is possible to be used in the future, especially for the NHIRD analyzed by SNA and Gini coefficient to explore the association between 2 diseases of interest. SNA incorporated with Google Maps provides insight into the relationships between entities. The results obtained in this study can be applied to the comprehensive understanding of other productive authors in the field of academics.
Author contributions
Developed the study concept and design: Tsair-Wei Chien.
Analyzed and interpreted the data: Tsair-Wei Chien and Yu Chang.
Monitored the process of this study and helped in responding to the reviewers’ advice and comments: Hsien-Yi Wang.
Drafted the manuscript: Tsair-Wei Chien.
Supervised the study: Hsien-Yi Wang.
Read and approved the final manuscript: All authors.
Acknowledgment
We thank Coding Language Service providing medical writing services to the manuscript.
Footnotes
Abbreviations: CI = confidence interval, HTML = Hyper Text Mark-up Language, MESH = medical subject heading, NHIRD = National Health Insurance Research Database, SNA = social network analysis, VBA = visual basic for application.
The authors have no conflicts of interest to disclose.
References
- [1].Hampson NB, Weaver LK. Carbon monoxide poisoning and risk for ischemic stroke. Eur J Intern Med 2016;31:e7. [DOI] [PubMed] [Google Scholar]
- [2].Lin CW, Chen WK, Hung DZ, et al. Association between ischemic stroke and carbon monoxide poisoning: a population-based retrospective cohort analysis. Eur J Intern Med 2016;29:65–70. [DOI] [PubMed] [Google Scholar]
- [3].Chung WS, Lin CL, Kao CH. Carbon monoxide poisoning and risk of deep vein thrombosis and pulmonary embolism: a nationwide retrospective cohort study. J Epidemiol Community Health 2015;69:557–62. [DOI] [PubMed] [Google Scholar]
- [4].Lee FY, Chen K, Lin CL, et al. Carbon monoxide poisoning and subsequent risk of cardiovascular disease: a nationwide population-based cohort study. Medicine 2015;94:1–8. [DOI] [PMC free article] [PubMed] [Google Scholar]
- [5].Lai CY, Chou MC, Lin CL, et al. Increased risk of Parkinson disease in patients with carbon monoxide intoxication: a population-based cohort study. Medicine 2015;94:1–6. [DOI] [PMC free article] [PubMed] [Google Scholar]
- [6].Chen YG, Lin TY, Dai MS, et al. Risk of peripheral artery disease in patients with carbon monoxide poisoning: a population-based retrospective cohort study. Medicine 2015;94:1–6. [DOI] [PMC free article] [PubMed] [Google Scholar]
- [7].Lin SY, Lin CL, Hsu WH, et al. Association of statin use and the risk of end-stage renal disease: a nationwide Asian population-based case-control study. Eur J Intern Med 2016;31:68–72. [DOI] [PubMed] [Google Scholar]
- [8].Domingos P. A few useful things to know about machine learning. Commun ACM 2012;55:78–87. [Google Scholar]
- [9].Verhoef PC, Kooge E, Walk N. Creating Value with Big Data Analytics: Making Smarter Marketing Decisions. London: Routledge; 2016. [Google Scholar]
- [10].Power DJ. What is the “true story” about data mining, beer and diapers? DSS News. Available at: https://goo.gl/1FtGft. Accessed March 20, 2017. [Google Scholar]
- [11].Sadoughi F, Valinejadi A, Shirazi MS, et al. Social Network Analysis of Iranian Researchers on Medical Parasitology: a 41 year co-authorship survey. Iran J Parasitol 2016;11:204–12. [PMC free article] [PubMed] [Google Scholar]
- [12].Osareh F, Khademi R, Rostami MK, et al. Co-authorship Network Structure Analysis of Iranian Researchers’ scientific outputs from 1991 to 2013 based on the Social Science Citation Index (SSCI). Collnet J Scientometr Info Manag 2014;8:263–71. [Google Scholar]
- [13].Liu X, Bollen J, Nelson ML, et al. Co-authorship networks in the digital library research community. Info Process Manag 2005;41:1462–80. [Google Scholar]
- [14].Zhang C, Yu Q, Fan Q, et al. Research collaboration in health management research communities. BMC Med Inform Decis Mak 2013;13:52. [DOI] [PMC free article] [PubMed] [Google Scholar]
- [15].Batagelj V, Mrvar A. Jünger M, Mutzel P. Pajek—analysis and visualization of large networks. Graph Drawing Software. Berlin: Springer; 2003. 77–103. [Google Scholar]
- [16].Efron B, Tibshirani R. An Introduction to the Bootstrap. Boca Raton, FL: Chapman & Hall/CRC; 1993. [Google Scholar]
- [17].Varian H. Bootstrap tutorial. Math J 2005;9:768–75. [Google Scholar]
- [18].Gini C. Concentration and dependency ratios (in Italian). English translation in Rivista di Politica Economica 1997;87:769–89. [Google Scholar]
- [19].Chien TW. Google Maps on researchers using Taiwan National Health Insurance Research Database. Available at: http://www.healthup.org.tw/gps/nhi.htm. Accessed November 1, 2017. [Google Scholar]
- [20].Chien TW. Google Maps on author collaboration of Chia-Hung Kao using Taiwan National Health Insurance Research Database. Available at: http://www.healthup.org.tw/gps/Kaoprofessor.htm. Accessed November 1, 2017. [Google Scholar]
- [21].Chien TW. Google Maps on keywords of Chia-Hung Kao using Taiwan National Health Insurance Research Database. Available at: http://www.healthup.org.tw/gps/Kaoprofessor_keyword.htm. Accessed November 1, 2017. [Google Scholar]
- [22].Chien TW. Google Maps on MESH terms of Chia-Hung Kao using Taiwan National Health Insurance Research Database. Available at: http://www.healthup.org.tw/gps/Kaoprofessor_mesh.htm. Accessed November 1, 2017. [Google Scholar]
- [23].Stefanic N, Iverson DC, Caputi P, et al. Examining the influence of personal goal interference and attainability on psychological distress in non-metastatic breast cancer patients. Eur J Cancer Care (Engl) 2017;26:5. [DOI] [PubMed] [Google Scholar]
- [24].Wurm M, Edlund S, Tillfors M, et al. Characteristics and consequences of the co-occurrence between social anxiety and pain-related fear in chronic pain patients receiving multimodal pain rehabilitation treatment. Scand J Pain 2016;12:45–52. [DOI] [PubMed] [Google Scholar]
- [25].Stewart SA, Abidi SS. Applying social network analysis to understand the knowledge sharing behavior of practitioners in a clinical online discussion forum. J Med Internet Res 2012;14:e170. [DOI] [PMC free article] [PubMed] [Google Scholar]
- [26].Zhao K, Wang X, Cha S, et al. A multirelational social network analysis of an online health community for smoking cessation. J Med Internet Res 2016;18:e233. [DOI] [PMC free article] [PubMed] [Google Scholar]
- [27].Borgatti SP, Everett MG, Freeman LC. Ucinet for Windows: Software for Social Network Analysis. Harvard, MA: Analytic Technologies; 2002. [Google Scholar]
- [28].Bastian M, Heymann S, Jacomy M. Gephi: an open source software for exploring and manipulating networks. International AAAI Conference on Weblogs and Social Media 2009. Available at: https://gephi.org/publications/gephi-bastian-feb09.pdf. Accessed January 13, 2018. [Google Scholar]


