

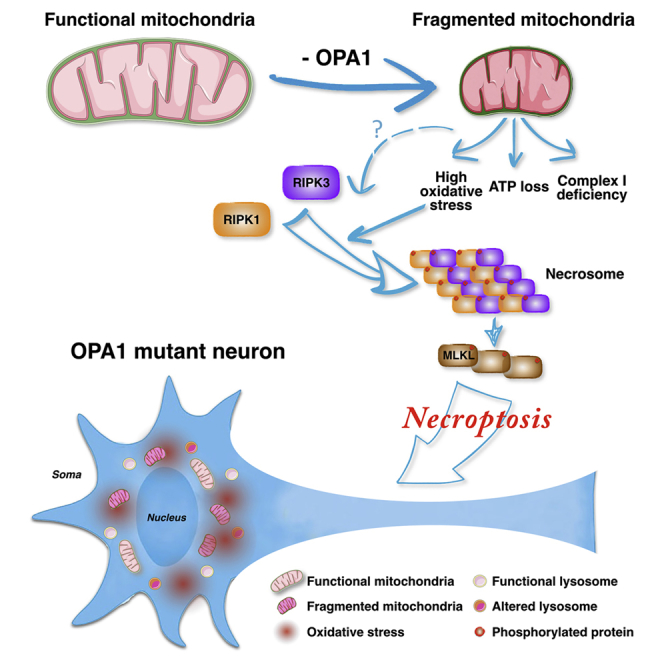
Summary
Dysfunctions in mitochondrial dynamics and metabolism are common pathological processes associated with Parkinson’s disease (PD). It was recently shown that an inherited form of PD and dementia is caused by mutations in the OPA1 gene, which encodes for a key player in mitochondrial fusion and structure. iPSC-derived neural cells from these patients exhibited severe mitochondrial fragmentation, respiration impairment, ATP deficits, and heightened oxidative stress. Reconstitution of normal levels of OPA1 in PD-derived neural cells normalized mitochondria morphology and function. OPA1-mutated neuronal cultures showed reduced survival in vitro. Intriguingly, selective inhibition of necroptosis effectively rescued this survival deficit. Additionally, dampening necroptosis in MPTP-treated mice protected from DA neuronal cell loss. This human iPSC-based model captures both early pathological events in OPA1 mutant neural cells and the beneficial effects of blocking necroptosis, highlighting this cell death process as a potential therapeutic target for PD.
Keywords: Parkinson’s disease, iPSCs, OPA1, necroptosis, apoptosis, necrosis, cell death, mitochondria, neurodegeneration
Graphical Abstract
Highlights
-
•
OPA1 mutant iPSC-derived NPCs contain dysfunctional mitochondria
-
•
OPA1 mutant iPSC-derived NPCs present high levels of oxidative stress
-
•
Nec-1s can improve survival of OPA1 mutant human neurons in vitro
-
•
Nec-1s counteracts the dopaminergic cell loss in MPTP-treated neurons
Iannielli et al. generate iPSCs from Parkinson’s disease patients with OPA1 mutations and find that derived NPCs have mitochondria with impaired morphology and bioenergetics. Nec-1s, a pharmacological inhibitor of necroptosis, promotes the survival of human OPA1 mutant neurons and attenuates dopaminergic neuronal loss in MPTP-treated mice.
Introduction
Degeneration of the dopaminergic (DA) neurons of the substantia nigra is the main cause leading to the severe motor deficits afflicting Parkinson’s disease (PD) patients. Over the past two decades, several genes have been found to be mutated in rare familial forms of PD, providing an opportunity to decipher the molecular causes underlying this disease (Abeliovich and Gitler, 2016, Hardy, 2010, Obeso et al., 2010). Importantly, the largest group of PD-causative genes encodes for crucial modulators of mitochondrial quality control and homeostasis (Giannoccaro et al., 2017). A recent addition to this group is the dynamin-related GTPase optic atrophy type 1 (OPA1), whose dominant heterozygous mutations were identified in two families with chronic progressive external ophthalmoplegia (CPEO), parkinsonism, and dementia (Carelli et al., 2015). OPA1 is a resident protein of the inner mitochondrial membrane and plays a key role in controlling both mitochondrial structure and dynamics (MacVicar and Langer, 2016). OPA1 together with the mitofusins MFN1 and MFN2 promote fusion of mitochondria, a process that is associated with increased respiratory efficiency (Cipolat et al., 2004). In addition, OPA1 protein polymerization preserves cristae morphogenesis, facilitating activity of the respiratory super-complexes (Frezza et al., 2006). The absence of OPA1 severely destabilizes the cristae structure and might lead to activation of the apoptotic pathway (Frezza et al., 2006). However, fibroblasts from PD patients with OPA1 mutations presented a normal phenotype with only mild mitochondrial alterations (Carelli et al., 2015). Thus, it remains unknown to what extent these OPA1 mutations affect mitochondria activity in neural cells. Moreover, it would be relevant to elucidate the molecular events that link primary mitochondrial dysfunctions with the final downstream consequence as represented by the DA neuronal degeneration.
In neurodegenerative disease, the causative pathological mechanisms are thought to stimulate a cascade of events leading to the activation of the programmed cell death (PCD) pathways responsible for irreversible neuronal cell demise (Levy et al., 2009, Venderova and Park, 2012). In particular, solid findings in cells and mice have shown that mitochondrial dysfunctions triggered by neurotoxins, such as 1-methyl-4-phenyl-1,2,3,6-tetrahydropyridine (MPTP) and rotenone, activate the apoptotic pathway (Vila and Przedborski, 2003). In fact, the apoptotic Bcl-2 proteins Bax and Bak are activated downstream to a defective respiratory complex I, leading to mitochondrial outer membrane permeabilization, cytochrome c leakage, and caspase cascade activation (Perier et al., 2007). However, it remains less clear whether DA neuronal degeneration during PD pathogenesis in humans is exclusively caused by apoptosis. In fact, concurrent activation of both apoptosis and necrosis have been described in human PD brain tissues (Levy et al., 2009, Venderova and Park, 2012).
Thus, other non-apoptotic cell death modalities might play a neglected role in DA neuronal loss. It is conceivable that multiple adverse stimuli co-exist during PD pathogenesis, such as mitochondrial and lysosomal dysfunctions, protein misfolding, inflammation, and bioenergetic alterations that can trigger multiple cell death pathways even in the same cell. In this regard, the alternative PCD pathway known as necroptosis has emerged to play a relevant role in triggering neuronal death in neurodegenerative disorders (Conrad et al., 2016, Zhang et al., 2017a). Necroptosis is a regulated process of necrosis that is triggered by inflammatory signals and is dependent on the RIPK1/3 kinases (Grootjans et al., 2017). In fact, when caspase-8 is inactive, RIPK1 and RIPK3 are not cleaved but rather associate forming the necrosome complex (Grootjans et al., 2017). Activated RIPK3 phosphorylates and recruits MLKL, which creates a supramolecular protein complex at the plasma membrane leading to necroptosis execution by causing membrane disruption (Conrad et al., 2016). Importantly, specific necroptosis inhibitors, such as necrostatin-1 (Nec-1), have been developed by targeting the kinase activity of RIPK1/3 (Degterev et al., 2005). Recent research has revealed that in pathological conditions with a strong inflammatory component, necroptosis is a leading cause of neuronal cell death (Ito et al., 2016, Ofengeim et al., 2015, Re et al., 2014). In fact, in multiple sclerosis (MS), tumor necrosis factor alpha (TNF-α) is upregulated and leads to oligodendrocyte death by necroptosis, which can be limited by Nec-1 (Ofengeim et al., 2015). Similarly, neuroinflammation mediated by activated microglia mainly through the TNF-α pathway has been shown to contribute to PD pathogenesis (Deleidi and Gasser, 2013). Remarkably, in GBA mutant mice deficient for the lysosomal enzyme beta-glucocerebrosidase as occurs in Gaucher’s lysosomal storage disease, neuronal cell death mainly occurs via necroptosis (Vitner et al., 2014). In fact, RIPK3 inactivation substantially improved the clinical course of GBA mutant mice, rescuing neurological and systemic deficits (Vitner et al., 2014). Importantly, heterozygous mutations in GBA are the major risk factor for PD, causing lysosomal activity impairment and altered autophagy (Nalls et al., 2013, Sidransky et al., 2009). Thus, these pathological processes described in cellular and animal models of PD have been previously associated with active necroptosis, however, its contribution to this pathology has not yet been established. In this study, we showed that PD-associated OPA1 mutations in patient induced pluripotent stem cell (iPSC)-derived neural cells cause severe mitochondrial dysfunctions, impaired oxidative phosphorylation, and high oxidative stress levels, leading to neuronal cell loss. Importantly, necroptosis inhibition rescued the neuronal differentiation potential of these cells and was effective in protecting nigral DA neurons in mice treated with the MPTP neurotoxin.
Results
PD-OPA1 Mutant iPSC-Derived NPCs Exhibit Morphological and Functional Mitochondrial Alterations
To investigate the pathological bases of the OPA1 mutations leading to PD, skin fibroblasts were obtained from two individuals manifesting PD symptoms, one for each family, and reprogrammed into iPSCs with a non-integrating system based on Sendai viruses expressing the Yamanaka genes (CytoTune-iPS). For the subsequent functional studies, iPSC lines were initially selected based on the correct colony morphology, expression of crucial pluripotency genes, and silencing of fibroblast-specific genes (Figures S1A–S1AO). Then, iPSCs were assessed for multi-lineage cell differentiation competence as validated by the generation in vitro of somatic cells for the three germinal layers (data not shown). Moreover, Sanger sequencing confirmed the presence of the p.G488R or the p.A495V disease mutation, and iPSCs maintained a normal euploid karyotype over several passages in vitro (Figures S1AP and S1AQ). We then selected iPSC lines from age-matched normal donors that passed the equivalent quality control procedures (Figure S1). It was recently reported that iPSC lines might carry a heavy load of homoplasmic or heteroplasmic mtDNA mutations, reflecting the mtDNA state present in the single fibroblast from which each cell line was derived (Kang et al., 2016, Lorenz et al., 2017, Perales-Clemente et al., 2016). This unfavorable event is even more pronounced in iPSCs derived from the fibroblasts of elderly people that present a significantly higher incidence of mtDNA defects in the overall cell population (Kang et al., 2016). Considering these results, functional studies to profile the mitochondrial activity in patient iPSCs need to be performed excluding confounding effects of the disease-independent harmful mtDNA mutations. To this end, mtDNA from iPSC lines derived from both OPA1-mutant PD patients (PD-OPA1 iPSCs) and normal donors was fully sequenced and analyzed. Among the six different iPSC lines, G488R #34 and G488R #37 carried a homoplastic disruptive mutation in the ND5 gene and were therefore discarded (data not shown). Conversely, PD-OPA1 iPSC lines G488R #12, G488R #22, and A495V #72 and normal donor (ND) #37 and ND #68 did present few synonymous mutations without any predictable functional significance (Figure S2A). Hence, we focused on these five lines for the following studies. Immunoblotting analysis showed that OPA1 protein levels were reduced in all the PD-OPA1 iPSC lines, suggesting that the missense mutations lead to protein instability and increased protein degradation (Figures S2B and S2C). In support of this, levels of OPA1 gene transcripts were comparable among all the lines, suggesting that the mutations operate through a post-transcriptional mechanism (Figure S2E).
To rescue the phenotypic defects directly caused by the OPA1 gene mutations, we integrated by lentiviral transduction the wild-type OPA1 isoform 1 into each of the three PD-OPA1 iPSC lines. Then, for each PD-OPA1 iPSC line, one OPA1-complemented cell line was selected with levels of total OPA1 protein comparable to those present in ND cells (Figures S2B and S2D). Both PD-OPA1 and ND iPSC lines showed a comparable growth rate with long-term, stable maintenance of the undifferentiated state. This was expected considering that iPSC metabolism and bioenergetics mostly rely on aerobic glycolysis (Folmes et al., 2011). Conversely, iPSC-differentiated somatic cell lineages, as in particular neuronal cells, requires mitochondrial biogenesis and maturation of efficient oxidative energy generation for metabolic sustenance (Lorenz et al., 2017). Hence, we directed the differentiation of iPSCs into neural progenitor cells (NPCs) by generating neural rosettes through a sequential exposure to SB431542 and Noggin to select a population of Nestin/Pax6 double-positive cells growing in a basal-free medium with basic fibroblast growth factor (bFGF) and B27/N2 supplements (Figure S3). Once we obtained highly homogeneous NPCs comparable with respect to cell growth and number of passages in vitro (Figure S3), we carried out a detailed morphological assessment of their mitochondrial component. Interestingly, immunostaining for the protein of the external mitochondrial membrane TOMM20 showed a filamentous mitochondrial network in ND NPCs, which was significantly fragmented in the PD-OPA1 NPCs (Figures 1A–1D and 1H). This aberrant morphology was normalized in the OPA1-complemented patient NPCs, indicating that this defect was directly caused by OPA1 gene alterations (Figures 1E–1H). On the same line, quantitative measurement of transmission electron microscopy images confirmed that OPA1-mutant mitochondria were reduced in length with a tendency to present a round-shaped morphology (Figures 1I and 1J).
Figure 1.

Mitochondrial Network Morphology of PD-OPA1, Normal Donor (ND), and OPA1-Complemented NPCs
(A–G) Representative images of mitochondrial morphology stained with TOMM20 (green) in PD-OPA1 (B–D), ND (A), and OPA1-complemented (E–G) NPCs.
(H) Quantification of mitochondrial morphology confirming the fragmented morphology in PD-OPA1 compared with ND and OPA1-complemented NPCs.
(I and J) Transmission electron microscopy (TEM) images (I) showing the mitochondria-altered morphological aspect. The mitochondrial size was calculated by measuring the perpendicular axis with respect to the larger diameter for all the mitochondria (200 mitochondria in total) and relative quantifications (J).
Data are mean ± SEM, n = 3 independent experiments. ∗∗p < 0.01, ∗∗∗p < 0.001 for ND NPCs and °°p < 0.01, °°°p < 0.001 for OPA1-complemented NPCs. Statistical analysis was performed using one-way ANOVA followed by Tukey post-test. Scale bars, 100 μm (A–G), 500 nm (I).
Given the significantly altered mitochondrial morphology in PD-OPA1 NPCs, we thoroughly evaluated mitochondrial functionality using several readouts. Initially, total mitochondrial content was quantified by Mitotracker-green staining, which localizes to the mitochondria irrespective of a charged mitochondrial membrane potential both in live staining and flow cytometry. Interestingly, PD-OPA1 NPCs showed a significant loss in total mitochondrial content (Figures 2A–2L and 2P). In concurrent independent assays, mitochondrial membrane potential was assessed with orange CMTMRos fluorescent dye, whose accumulation in the mitochondria is correlated to the membrane potential. This analysis revealed that a significant fraction of the PD-OPA1 NPC mitochondria had a reduced membrane potential (Figures 2A–2L and 2Q). Remarkably, both the total mass and membrane potential of mitochondria were robustly complemented in the OPA1-rescued mutant cell lines (Figures 2M–2O, 2R, and 2S). Overall, these results revealed that the PD-OPA1 NPCs have a global altered mitochondrial network, with loss of the overall mass and a significant fraction of dysfunctional organelles. Given these results, we sought to determine if these alterations might affect the overall bioenergetic profile of these cells. Initially, we investigated respiratory activity as a critical parameter of mitochondrial function. Oxygen consumption in NPCs was determined by microscale oxygraphy in basal conditions or in response to the ATP synthase inhibitor oligomycin, the proton ionophore FCCP, and the mitochondrial complex I inhibitor rotenone. The oxygen consumption rate (OCR) was significantly reduced in PD-OPA1 NPCs in all the conditions tested (Figure 3A). Accordingly, direct measurements of total ATP production in permeabilized cells revealed a significant reduction in ATP levels in the PD-OPA1 compared with control NPCs (Figure 3B), confirming a dysfunctional oxidative metabolism and mitochondrial uncoupling. Importantly, the ATP levels remained severely affected in PD-OPA1 NPCs also in the presence of pyruvate and malate, which stimulate complex I ATP production. These findings indicate that PD-OPA1 NPCs have a defective respiratory complex I, which leads to a robust loss of intracellular ATP content (Figure 3C).
Figure 2.

OPA1 Mutant NPCs Show Reduced and Dysfunctional Mitochondrial Content
(A–O) Representative images of MitoTracker Green and Orange CMTMRos in PD-OPA1 (D–L), ND (A–C), and OPA1-complemented (M–O) NPCs.
(P and Q) Quantification of fluorescence intensity of Mitotracker Green (P) and Orange CMTMRos (Q) by flow cytometetry highlights a reduction in number and functionality of mitochondria in PD-OPA1 NPCs.
(R and S) The introduction of the wild-type OPA1 gene re-establishes the normal content (R) and activity (S) of mitochondria in PD-OPA1 NPCs.
Data are mean ± SEM of n = 3 independent experiments. ∗p < 0.05. Statistical analysis was performed using one-way ANOVA followed by Tukey post-test. Scale bars, 100 μm.
Figure 3.

Activity and Mitochondrial Membrane Potential Are Affected in PD-OPA1 NPCs
(A) OCR measurements of control and PD-OPA1 NPCs analyzed individually. OCR is normalized to cell number. OCR is measured in basal conditions and after oligomycin, FCCP, and rotenone addition. OCR results lower in all tested conditions in PD-OPA1 compared with ND NPCs.
(B and C) Quantification of total mitochondrial ATP (B) and complex I-driven ATP (in the presence of 5 mM pyruvate plus 5 mM malate) (C). Concentration in the NPC medium. PD-OPA1 compared with ND NPCs produce less ATP and more lactate than controls.
(D) Effect of oligomycin (O) on mitochondrial membrane potential. Control and OPA1-mutant NPCs are loaded with TMRM as described in the Experimental Procedures. F, FFCP.
(E) Quantification of L-lactate concentration in the NPC medium.
Data are mean ± SEM; n = 3 independent experiments. ∗p < 0.05, ∗∗p < 0.01, ∗∗∗p < 0.001. Statistical analysis was performed by Student’s t test (A) or one-way ANOVA followed by Tukey post-test (B and C).
We then evaluated the mitochondrial membrane potential (MMP) as determined by loading with TMRM, a fluorescent dye that accumulates in polarized mitochondria and is released when MMP decreases. MMP maintained in the presence of the ATP-synthase inhibitor oligomycin (Figure 3D) was drastically reduced in PD-OPA1 NPCs (Figure 3D). If mitochondria-dependent energetics is insufficient, the aerobic glycolytic pathway might be upregulated to cope with the metabolic needs. According to this scenario, medium from PD-OPA1 NPCs presented increased levels of lactate, the final metabolic product of glycolysis, suggesting a partial shift in the metabolic program (Figure 3E). Accordingly, the hexokinase-2 (HK2) gene, encoding for the kinase catalyzing the rate-limiting step of glucose metabolism was found upregulated in PD-OPA1 NPCs (Figure S4).
Heightened Oxidative Stress and Lysosomal Impairment in PD-OPA1 NPCs
An adverse effect of impaired respiration is the increase of radical oxygen species (ROS) generation. Thus, we monitored the intracellular oxidants using the fluorescent ROS-sensitive 2′-7′-dichlorodihydrofluorescein diacetate (DCFDA) on NPCs in basal conditions. Noticeably, ROS levels were strongly enhanced in the PD-OPA1 compared with the ND NPCs (Figures 4A–4D and 4P). We then evaluated membrane oxidants using the lipophilic dye BODIPY-C11, whose signal vanished after interaction with peroxyl radicals. In accordance with DFCDA results, the BODIPY-C11 fluorescence was strongly diminished in PD-OPA1 NPCs indicating high levels of membrane oxidants in these cells (Figures 4F–4I and 4Q). As expected, OPA1 gene reintroduction was sufficient to normalize both ROS and oxidized lipid levels in PD-OPA1 NPCs (Figures 4E, 4J, 4S, and 4T). In addition, we measured the reduced form of glutathione using the Thioltracker violet probe. In line with the heightened ROS levels, significantly lower levels of reduced glutathione were detected in PD-OPA1 NPCs that were recovered after OPA1 gene reintroduction (Figures 4K–4O, 4R, and 4U). High intracellular ROS promotes protein carbonylation that can be evaluated by OxyBlot. The results confirmed that PD-OPA1 NPCs showed increased carbonylated protein levels compared with control NPCs (Figures 4Vand 4W). According to these results, RNA sequencing (RNA-seq) analysis showed a number of genes belonging to ROS-dependent molecular pathways whose expression was altered in PD-OPA1 NPCs (Figure S4). In fact, qPCR assays confirmed that expression levels of the SOD1 and SOD2 dismutases, SESTRIN3, and NRF2 and its target gene GPX1 were robustly increased in PD-OPA1 NPCs (Figure S4). Importantly, OPA1 complementation was sufficient to significantly reduce oxidized protein levels in all of the three PD-OPA1 NPC lines (Figures 4V and 4W).
Figure 4.

High Oxidative Stress Level in PD-OPA1 NPCs
(A–O) Representative images of NPCs stained with ROS-sensitive fluorescent probe DCFDA (A–E), BODIPY Lipid Probe (F–J), and ThiolTracker Violet (K–O).
(P–R) Quantification of DCFDA (P), BODIPY (Q), and ThiolTracker Violet (R) fluorescence reveal the heightened oxidative state in PD-OPA1 NPCs.
(S–U) OPA1 gene complementation is effective in significantly reducing the heightened oxidative state (S), lipid oxidation (T), and oxidized glutathione (U).
(V and W) OxyBlot assay (V) and quantification (W) of carbonylated protein levels confirming the altered oxidative condition of PD-OPA1 NPCs. Quantification of carbonylated protein signal was performed after normalization to the housekeeping protein actin.
Data are mean ± SEM; n = 3–4 independent experiments. ∗p < 0.05, ∗∗∗p < 0.001 for ND NPCs and °p < 0.05, °°°p < 0.001 for OPA1-complemented NPCs. Statistical analysis was performed using one-way ANOVA followed by Tukey post-test. Scale bars, 100 μm.
High intracellular ROS levels might seriously compromise over time the functionality of cellular organelles. The lysosomal total content was not evidently changed in PD-OPA1 compared with ND NPCs as assessed by LAMP1 immunostaining (Figures 5A–5D, 5I, 5K, and 5N). However, the LysoTracker fluorescent probe, which stains exclusively functional lysosomes with an acidic content, revealed a reduced number of active lysosomes in PD-OPA1 NPCs (Figures 5E–5H and 5J). A lysosomal impairment in these cells was also independently suggested by detecting an increasing amount of the total P62 protein, whose turnover is regulated exclusively by lysosomal-dependent degradation (Figures 5L and 5O). On the same line, PD-OPA1 NPCs showed a reduced amount of the mature form of cathepsin D, a lysosomal enzyme involved in alpha-synuclein degradation (Figures 5M and 5P) (Bae et al., 2015). Accordingly, other lysosomal genes and the master regulator TFEB were to some extent downregulated, further indicating an alteration in the lysosome-dependent molecular pathway (Figure S4).
Figure 5.

Lysosomal Activity Impairment in PD-OPA1 NPCs
(A–H) Representative images of NPCs stained with LAMP1 (A–D) and LysoTracker Red (E–H).
(I and J) Quantification of LAMP1 (I) and LysoTracker (J) stainings show a loss of lysosomal acidic pH in PD-OPA1 NPCs. Quantification was performed by analyzing the number of dots normalized on the cell surfaces.
(K and N) Immunoblot analysis (K) and relative quantification (N) for LAMP1 indicates a comparable lysosomal content in PD-OPA1 and ND NPCs.
(L and O) Immunoblot analysis (L) and quantification of intensity (O) of p62 protein levels after normalization to the housekeeping protein.
(M and P) Immunoblot analysis (M) and relative quantification (P) for cathepsin D (CTSD) reveals a reduction of intensity of CTSD in PD-OPA1 NPCs.
Data are mean ± SEM, n = 3–4 independent experiments. ∗p < 0.05, ∗∗p < 0.01, ∗∗∗p < 0.001. Statistical analysis was performed using one-way ANOVA followed by Tukey post-test. Scale bars, 100 μm (A–D), 50 μm (E–H).
Reduced Neuronal Differentiation Potential of PD-OPA1 NPCs and Rescue by Small Molecules
We next examined patient and control NPCs for their potential to generate post-mitotic neurons and, in particular, DA neurons. Concomitant CHIR99021 treatment with sonic hedgehog (SHH) signaling activation, followed by a change in Neurobasal medium supplemented with Forskolin, ascorbic acid, and neurotrophins, induced complete NPC differentiation into neurons and astrocytes. In particular, at two months from initial NPC differentiation, control neuronal cultures contained 73% ± 6% MAP2+ neurons, of which 42% ± 6% expressed TH+ (triplicates for five independent experiments) (Figures 6A 6Q, and 6R). Of note, despite TH+ neurons not displaying an evident regional identity, they express the crucial markers of the DA neuronal sub-type and were functional as assessed by their ability to produce and release dopamine (Figures S5A–S5F). Strikingly, neuronal cultures from all three PD-OPA1 NPCs showed a consistent decrease in the MAP2+ neuronal population (62% ± 5%) with an even more significant loss of TH+ neurons (18% ± 7%) (triplicates for four independent experiments) (Figures 6E–6P, 6Q, and 6R). This neuronal deficiency was not associated with a complementary increase in the astrocyte number, indicating that this loss is not caused by an aberrant neural lineage commitment of the PD-OPA1 NPCs (data not shown). Quantitative analysis of one-month-old neuronal cultures revealed already a decreased neuronal content in the PD-OPA1 group, suggesting a premature impairment in neuronal survival (data not shown). Remarkably, OPA1 reconstitution rescued the neuronal survival impairment in all three PD-OPA1 mutant neuronal cultures (Figures S5G–S5L). Given the serious dysfunctions previously described in the PD-OPA1 NPCs, we wondered whether these alterations were maintained in the post-mitotic neurons. In fact, DCFDA fluorescent staining confirmed that intracellular ROS levels were higher in the PD-OPA1 compared with control neurons (Figure S6). Thus, the functional alterations described in the PD-OPA1 NPCs are likely the cause of the underlying neuronal differentiation impairment. In addition, we analyzed the mtDNA copy number in both NPCs and their differentiated neuronal progeny. Noticeably, although mtDNA content was comparable in NPCs independently from their genotype, OPA1 mutant presented a significantly higher mtDNA copy number compared with ND neurons (Figure S7). This increased mtDNA biogenesis in OPA1 mutant neurons might be a compensatory response to the severe mitochondrial functional deficits affecting these cells.
Figure 6.

PD-OPA1 NPCs Have a Reduced Neuronal Differentiation Potential
(A–P) TH (green) and MAP2 (red) immunofluorescence staining for PD-OPA1 and ND NPC-derived neurons in the basal condition (A, E, I, and M) or treated with NAC (B, F, J, and N), Z-VAD (C, G, K, and O), or Nec-1s (D, H, L, and P).
(Q and R) PD-OPA1 NPCs generated a reduced number of viable neurons compared with ND NPCs after two months in culture. All the treatments increased the number of Map2+ (Q) and TH+ (R) cells, showing a protective effect on the NPC differentiation potential. However, Z-VAD is less efficient than NAC and Nec-1s in protecting from DA neuronal death.
Data expressed as mean ± SEM, n = 4 independent experiments. ∗p < 0.05, ∗∗p < 0.01 ∗∗∗p < 0.001. Statistical analysis is performed using two-way ANOVA followed by Bonferroni post-test. Scale bars, 100 μm.
We then attempted to rescue this neuronal loss using candidate small molecules. In particular, we initially selected obvious candidates, such as N-acetylcysteine (NAC), a strong antioxidant acting by replenishing glutathione levels and Z-VAD, a strong cell-permeable apoptotic inhibitor with a pan-caspase blocking activity. When either NAC or Z-VAD where added throughout the differentiation period, they exerted a robust effect in promoting survival of the general neuronal population and the TH+ neurons derived from the PD-OPA1 NPCs (Figures 6B–6O, 6Q, and 6R). However, Z-VAD was, in general, less potent than NAC in protecting from neuronal cell loss. Although apoptosis is the most common process investigated during neuronal cell loss in neurodegenerative diseases, the alternative cell death pathway of necroptosis has recently been found to contribute to these processes as well (Conrad et al., 2016, Zhang et al., 2017a). Noticeably, the immunoblotting analysis revealed a robust increase in RIPK1, RIPK3, and MLKL protein levels in PD patients compared with ND-derived post-mortem nigral tissue (Figure S8A). Likewise, neuronal cultures from all three PD-OPA1 mutant cell lines exhibited heightened RIPK1, RIPK3, and MLKL protein levels (Figure S8B). Thus, we differentiated PD-OPA1 NPCs in the presence of Nec-1s, a specific and potent necroptosis inhibitor (Takahashi et al., 2012). Strikingly, Nec-1s showed a strong effect in promoting PD-OPA1 neuronal survival comparable to that obtained with Z-VAD (Figures 6D–6P, 6Q, and 6R).
In contrast, treatment with these molecules for only a few days at late stages of differentiation did not obtain any functional rescue, indicating that extended treatment is necessary for their beneficial effects (data not shown).
Pharmacological Inhibition of Necroptosis Protects from MPTP-Induced DA Neuronal Cell Loss and Attenuates Oxidative Stress
Considering the beneficial effects triggered by necroptosis inhibition in PD-OPA1 neurons, we next thought to inhibit this pathway in vivo in a well-established PD mouse model based on sub-acute MPTP intoxication (Sedelis et al., 2001). MPTP is oxidized to the neurotoxin MPP+, which is specifically transported by DAT into the DA neuronal terminals and soma where it interferes with mitochondrial complex I activity leading to severe deficits in ATP formation and an increase in ROS production that in turn, cause an energy crisis and oxidative stress (Vila and Przedborski, 2003). Therefore, MPTP-dependent neuronal cell loss recapitulates the cardinal defects on mitochondrial complex I described in the PD-OPA1 neuronal cells and, therefore, represents a suitable in vivo model for evaluating the neuroprotective potential of necroptosis inhibition.
Mice were injected daily for five consecutive days with MPTP (20 mg/kg; intraperitoneally [i.p.]) and concomitantly injected with 1 μg of Nec-1 for 21 days. Due to the poor BBB penetration of this compound, mice were previously implanted with a cannula for chronic intra-cerebral ventricle (ICV) injections. At day 21, mice were sacrificed and brains processed for biochemical and histological evaluation. TH immunolabeling in DA striatal fiber density was quantified by optical density. The neurotoxic effect caused by MPTP led to a ∼50% reduction of TH+ fibers compared with the saline-treated group (Figures 7A–7D). In contrast, Nec-1 treatment led to a ∼34% fiber density decline in MPTP-treated mice, accounting for about 15% of recovery (Figures 7A–7D). To determine the effective loss of DA neurons, stereological counting was performed on the whole TH-stained nigral tissue. MPTP treatment caused a 60% loss of DA nigral neurons, which was reduced to 27% with the Nec-1 co-administration (Figures 7E–7H). These results indicate that Nec-1 by ICV delivery has a substantial effect in reducing MPTP-induced DA neuronal degeneration. To establish a less invasive and more feasible treatment, we switched to a derivative of Nec-1, known as Nec-1s (7-Cl−O-Nec-1), which has superior stability, reduced off-target effects, and is capable of crossing the blood-brain barrier (Takahashi et al., 2012). The i.p. Nec-1s administration exerted significant neuroprotection by reducing the loss of striatal DA fiber from 42% to 29% and the number of nigral DA neurons from 47% to 21% compared with MPTP treatment alone (Figures 7I–7P). Thus, peripheral delivery of Nec-1s achieved substantial DA neuronal protection from MPTP comparable to the effects obtained with the Nec-1 ICV injections. Next, we wondered whether Nec-1s neuroprotection was achieved by modulating any of the cellular dysfunctions caused by the MPTP-dependent mitochondrial impairment. Specifically, as a reliable indicator of intracellular oxidative stress levels, we performed immunohistochemistry for 4-hydroxynonenal (4-HNE), an aldehydic product of lipid peroxidation. Interestingly, Nec-1s treatment significantly reduced the strong 4-HNE immunofluorescence signal in TH+-nigral DA neurons caused by the MPTP intoxication (Figure S9). Altogether, these data demonstrate that pharmacological inhibition of necroptosis is effective in reducing DA neuronal loss caused by MPTP-dependent mitochondrial intoxication.
Figure 7.

Inhibition of Necroptosis Attenuates Nigrostriatal Degeneration Induced by MPTP Treatment
(A–C) Representative pictures of TH+ fibers in the striatum of animals used for Nec-1 treatment.
(I–K) Representative pictures of TH+ fibers in the striatum of animals used for Nec-1s treatment.
(D and L) Quantification of TH+ fiber density calculated as the mean of the level of greys (8-bit) showed a reduction in MPTP-treated mice compared with saline-injected mice and a partial restoration in both Nec-1 (D) and Nec-1s (L) groups.
(E–G) Representative pictures of TH+ neurons in SN animals used for Nec-1 treatment.
(M–O) Representative pictures of TH+ neurons in SN animals used for Nec-1s treatment.
(H and P) Stereological quantification highlights a decrease in the total number of TH+ neurons in animals receiving MPTP. The neuronal loss was prevented by Nec-1 (H) and Nec-1s (P) treatment.
Values are means ± SEM; n = 5–8 animals. ∗p < 0.05, ∗∗p < 0.01, ∗∗∗p < 0.001. Statistical analysis was performed using one-way ANOVA followed by Tukey post-test. Scale bar, 2 mm (A–C and J–L), 400 μm (E–G, and M–O).
Discussion
Herein, we showed that iPSC-based disease modeling unmasked a full spectrum of mitochondrial dysfunctions in neural cells harboring two different OPA1 mutations associated with parkinsonism and nigrostriatal degeneration. iPSC-derived neural cells showed a compromised mitochondrial network in basal conditions with impaired oxidative metabolism and heightened oxidative stress. Importantly, most of these deficits were not readily detectable in fibroblasts from patients under basal conditions, indicating that the iPSC modeling is pivotal for the exploitation of the mechanisms leading to neurodegeneration (Carelli et al., 2015). In our analysis, OPA1-A495V neural cells exhibited, in general, more severe alterations compared with those detected in OPA1-G488R analogous cells. Interestingly, this difference matches the clinical diversity at the time of the last clinical assessment between the two patients carrying either the A495V or G488R mutation. In fact, the former displayed a fully symptomatic parkinsonism with bradykinesia, rigidity, and postural tremor (individual III-1 in Family 2), whereas the latter had only a partial nigrostriatal degeneration based on DAT-scan imaging but did not yet have the full-blown motor symptoms of parkinsonism (individual III-11 in Family 1) (Carelli et al., 2015).
OPA1 mutations are a common cause of pure dominant optic atrophy (DOA) which, however, might be associated with additional debilitating neurological manifestations, including CPEO, sensorineural deafness, ataxia, myopathy, and polyneuropathy, referred to as DOA “plus” (Amati-Bonneau et al., 2008, Yu-Wai-Man et al., 2010). Only recently were parkinsonism and dementia shown to be associated with two novel OPA1 mutations (Carelli et al., 2015). Our work provides a detailed analysis of the mitochondrial and metabolic deficits caused by these peculiar OPA1 mutations, showing that these alterations can lead to neuronal survival defects in iPSC-derived neural cells. Future studies are needed to understand whether only these mutations can trigger an irreversible neurodegenerative process. Previous studies have shown that some of the defects described herein in the iPSC derivatives are consistent with the alterations described in other cell types from DOA and DOA-plus patients (Chevrollier et al., 2008, Zanna et al., 2008). For instance, PD-OPA1 NPCs shared with DOA-plus primary cells a recurrent and prevalent impairment of ATP synthesis when driven by complex I substrates (Carelli et al., 2015, Zanna et al., 2008), which has been subsequently proposed to be related to poor super-complex formation determined by altered cristae morphology (Cogliati et al., 2013). Overall, these findings suggest that DOA-plus patients could be at seriously increased risk of developing parkinsonism during disease progression at an elderly age. Thus, these results call for longitudinal clinical evaluation of these patients over an extended period of time to ascertain this important eventuality. Additionally, generation of iPSCs from DOA-plus patients and the characterization of their differentiated neuronal cells, as carried out herein, might provide important indications as to whether this is a likely possibility. The DOA syndromic form is also associated with the increased accumulation and clonal expansion of multiple mtDNA deletions in post-mitotic tissues, such as skeletal muscle, resulting in the emergence of cytochrome c oxidase-negative and ragged-red fibers (Amati-Bonneau et al., 2008, Yu-Wai-Man et al., 2010). Furthermore, reduced or abolished expression of OPA1 is also associated with mtDNA depletion (Del Dotto et al., 2017). The potential combination to various degrees of accumulation and clonal expansion of mtDNA deletions with reduced copy number might be a strong determinant of the multi-organ pathology that develops in an age-related fashion, ultimately including DA neurons and related parkinsonism (Carelli et al., 2015, Yu-Wai-Man et al., 2010). iPSC-derived neurons did not present loss or deletions in mtDNA, while they exhibited a significant increase in mtDNA copy number. This is in agreement with the compensatory activation of mitochondrial biogenesis and increased mtDNA copy number documented in both the blood cells and skeletal muscle of patients with Leber’s hereditary optic neuropathy (Giordano et al., 2014), a complex I disorder, and OPA1-related DOA (Iommarini et al., 2012). In fact, disturbed mtDNA maintenance appears to be only a late age-related event during OPA1 disease progression (Amati-Bonneau et al., 2008). This indicates that OPA1 pathogenetic mechanisms primarily impact on mitochondrial dynamics and mitochondrial respiratory complex structural organization and function and only subsequently lead to mtDNA defects. Thus, our observation of increased mtDNA copy number in PD-OPA1 iPSC-derived neurons most probably reflects the initial phase of the disease when mitobiogenesis is activated to cope with the defective mitochondrial functions caused by OPA1 mutations. This is consistent with the young age of the iPSC-derived neurons in vitro that poses limitations for modeling age-related neurodegenerative processes. However, our results suggest that substantial mitochondrial deficits have a strong impact on neuronal survival in vitro, where metabolic constrains might limit their resilience to these insults. A similar spectrum of neurological symptoms, including severe nigrostriatal degeneration associated with multiple mtDNA deletions, can be caused by mutations in the nuclear genes POLG and C10orf2 (Fratter et al., 2010, Horvath et al., 2006). However, in these cases, POLG and C10orf2 encode for mitochondrial proteins with a key role in mtDNA replication, suggesting that impaired mtDNA maintenance is the primary cause of these diseases (Young and Copeland, 2016). Thus, it remains to be understood whether mtDNA integrity loss in OPA1-dependent parkinsonism is a primary and necessary trigger for neuronal cell loss. Nonetheless, our data indicate that OPA1-dependent dysfunctions in mitochondrial metabolism and dynamics in iPSC-derived neural cells are sufficient to elicit some neuronal cell loss without compromising mtDNA integrity.
Intriguingly, our findings indicate for the first time that necroptosis is activated on neuronal cell loss caused by mitochondrial dysfunctions both in vitro and in vivo. In particular, nigral DA neurons were significantly protected from the MPTP toxic effects with the peripheral administration of Nec-1s. Necroptotic cell death is triggered by diverse inflammatory stimuli through stimulation of the TNF family death domain receptor (Conrad et al., 2016). In fact, it was shown that in neurodegenerative diseases with an overt inflammatory component, such as MS and amyotrophic lateral sclerosis (ALS), there is strong activation of this non-apoptotic cell death pathway (Ito et al., 2016, Ofengeim et al., 2015, Re et al., 2014). Mounting evidence indicates a strong inflammatory component during PD progression, as revealed by a local increase in glial reaction and pro-inflammatory cytokine release (Deleidi and Gasser, 2013). Similarly, MPTP leads to microglial activation and local neuroinflammation both in humans and mice (Hirsch et al., 2005, Martin et al., 2016). In addition, it has been recently shown that RIPK1 is a sensor for ROS, which can stimulate RIPK1 auto-phosphorylation and activate necroptosis (Zhang et al., 2017b). Thus, both inflammation and oxidative stress might initiate the necroptotic pathway during PD disease progression. We described that PD-OPA1 iPSC-derived neural cells accumulate high levels of intracellular ROS, and presumably, this might contribute to the activation of necroptosis in our in vitro culture system.
Previous studies have convincingly elucidated the molecular mechanisms that associate MPTP-related mitochondrial dysfunctions with apoptotic neuronal cell death (Perier et al., 2007). However, different levels of protection from MPTP-induced cell death were achieved depending on which apoptotic modulator was targeted. In fact, inhibition of caspases in general or specifically of caspase 8 was not efficient in protecting DA neuronal cultures exposed to MPP+ (Hartmann et al., 2001). In contrast, Bax-mutant mice were fully protected from the MPTP intoxication (Vila et al., 2001). Thus, it is conceivable that the apoptotic pathway might have multiple interactions at different levels with other cell death processes. In fact, for instance, Bax can promote mitochondrial fission, which in turn can drive necroptosis through activation of the dynamin-1-like protein by PGAM5 (Sheridan et al., 2008, Wang et al., 2012).
Other caspase-independent cell death pathways such as parthanatos and ferroptosis have been shown to protect from toxin-induced neuronal degeneration in cells and mice (Vanden Berghe et al., 2014, Fatokun et al., 2014). Thus, future studies will be required to elucidate their interactions, redundancies, and specific inducers for these different cell death modalities. For instance, experimental evidence suggests that in many cases, despite suppression of apoptotic pathways, cells exposed to stresses eventually die by alternative mechanisms (Hartmann et al., 2001).
Therapies based on inhibiting apoptosis face several challenges because this process has many pleiotropic functions. Systemic administration of global anti-apoptotic agents can likely interfere with physiologic cell death as well as suppression of tumorigenic processes. In contrast, necroptotic cell death is exclusively triggered by selected pathological conditions, and highly selective and potent inhibitors, such as Nec-1s and others, are effective in blocking this pathway (Degterev and Linkermann, 2016), making this strategy more appealing for future translational applications.
Our study provides a strong case for using iPSC-based modeling for assessing the consequences of mitochondrial dysfunctions in neural cells and dissecting the initial mechanisms that lead to neuronal cell loss. This modeling has uncovered necroptosis as a relevant cell death modality whose inhibition might represent an interesting therapeutic option for counteracting PD-related neurodegeneration.
Experimental Procedures
Cell Cultures and Neuronal Differentiation
Primary OPA1-mutant fibroblasts derived from PD patients were isolated at the IRCCS Institute of Neurological Sciences of Bologna. Fibroblasts from NDs were obtained from the IRCCS Istituto Neurologico C. Besta. iPSC cell lines were maintained in feeder-free conditions in mTeSR1 (Stem Cell Technologies) and seeded in human embryonic stem cell (HESC)-qualified Matrigel (Corning)-coated six-well plates.
Molecular Cloning and Viral Infection
The OPA1 coding region followed by an internal ribosome entry site (IRES)-puromycin resistance cassette was cloned into a lentiviral vector downstream to the PGK promoter. Replication-incompetent, VSVg-coated lentiviral particles were packaged in 293T cells. To obtain a stable cell line with the OPA1 wild-type form, OPA1 mutant and control iPSCs were infected in mTeSR1. Sixteen to 20 hr after infection, cells were switched into fresh mTeSR media containing puromycin (1 μg/mL, Sigma-Aldrich). After 48 hr, single colonies were picked and seeded in HESC-qualified Matrigel-coated six-well plates.
Mitotracker Green and Orange
NPCs from patients and controls were incubated with 50 nM of Mitotracker Green and Mitotracker Orange (Molecular Probes) for 30 min at 37°C, washed with PBS, and acquired by confocal microscope (Leica TCS SP5, Germany). For the analysis, the samples were acquired on LSR-Fortessa (BD) flow cytometer. All data were analyzed using FCS Ex4press 6 Flow (De Novo Software) and expressed as mean fluorescence intensity.
LysoTracker Red
NPCs from patients and controls were incubated with 50 nM of LysoTracker Red (Molecular Probes) for 30 min at 37°C, washed with PBS and acquired by confocal microscope (Leica TCS SP5, Germany). The quantification of the signal was performed using ImageJ software (NIH, US).
Mitochondrial Morphology
NPCs from patients and controls were dissociated with Accutase and plated on Matrigel-coated 24-well plates (1 × 40,000 cells per well) in NPC medium. Mitochondrial morphology was assessed by TOMM20 immunostaining. Cellular fluorescence images were acquired with a Nikon Eclipse Ni microscope. Images were collected using a ×63/1.4 oil objective and analyzed using the Mito-Morphology macro in ImageJ.
Animals, Surgery, and Drug Treatment
Nine-week-old male C57BL/6J mice (Charles River Laboratories, France) underwent cannula implantation to ensure access for subsequent infusion of drugs. The cannulas (Phymep, France) were placed unilaterally at −0.5 mm anterior posterior, 1.1 mm lateral, and −2 mm ventral corresponding to the lateral ventricle. Anterior-posterior and lateral and ventral coordinates are from bregma and dura mater, respectively. Mice were sorted into three groups and subjected to distinct treatments. Two groups were intoxicated with 20 mg/kg MPTP (i.p.) injected daily for five consecutive days, whereas the third group received saline. The MPTP groups were alternately microinjected with Nec-1 (0.2 μg/μL)/Nec-1s (10 mg/kg i.p.) or vehicle (DMSO 1%, methyl-beta-cyclodextrin 4% in PBS), whereas the saline group received only Nec-1/Nec-1s. The microinjection was performed by injecting a total volume of 5 μL at 0.5 μL/min. The treatment with Nec-1/Nec-1s started three days after the first injection of MPTP and lasted three weeks.
Stereological Counting
The unbiased stereological sampling method was used to quantify dopaminergic neurons in substantia nigra pars compacta (SNc). The cell counting was performed using a Leica DM4000B motorized microscope equipped with Stereo Investigator (MBF Bioscience, Williston, VT, US). After SNc boundaries delimitation, TH-positive (TH+) cells in SNc were on-line counted at 40× magnification over five 50 μm-thick sections for each brain and collected every 200 μm, encompassing the whole SNc. The optical fractionator stereological probe was then used to estimate the total number of TH+ neurons for the entire SNc volume.
Statistics
All values are expressed as mean ± SEM. Differences between means were analyzed using the Student’s t test and one-way or two-way ANOVA depending on the number of groups and variables in each experiment. In vitro and in vivo data were then submitted to Tukey or Bonferroni post hoc test using GraphPad Prism software. The null hypothesis was rejected when p < 0.05.
Acknowledgments
We are thankful to Drs. B. Garavaglia, L. Muzio, S. Levi, D. Zacchetti, P. Santambrogio, and M. Bacigaluppi for sharing of reagents, J.L. Lanciego for human nigral tissue samples, C. Peron for technical help, and D. Bonanomi, E. Cattaneo, A. Gritti, A. Menegon, and all members of the Broccoli lab for helpful discussion. We acknowledge the anonymous reviewers for their insightful comments. We acknowledge the FRACTAL core facility for expert supervision in flow cytometry. This work was supported by the European Research Council (AdERC #340527) and Regione Lombardia (iPSLight #227333 and GenePark #149065).
Author Contributions
A.I. and S.B. performed the experiments and analyzed the data; C.C. generated and maintained iPSC cultures; L.F. carried out western blotting analysis; A.S. performed the microscale oxygraphy assays; L.M. performed the RNA-seq computational analysis; A.M. executed the mtDNA quantifications; A.R. was responsible for the flow-cytometry analysis; G.G. performed karyotype assessment; L.C. and F.T. carried out and analyzed mtDNA sequencing in iPSC lines; G.M. contributed in mouse tissue analysis; O.M. provided human fibroblasts; E.B. contributed to the MPTP experimental plan; V.C. and V.T. contributed in designing the experiments; and V.B. supervised, coordinated, and supported the project and wrote the paper with A.I. and S.B.
Declaration of Interests
The authors declare no competing interests.
Published: February 20, 2018
Footnotes
Supplemental Information includes Supplemental Experimental Procedures and nine figures and can be found with this article online at https://doi.org/10.1016/j.celrep.2018.01.089.
Data and Software Availability
The accession number for the RNA-seq datasets reported in this paper is GEO: GSE109228.
Supplemental Information
References
- Abeliovich A., Gitler A.D. Defects in trafficking bridge Parkinson’s disease pathology and genetics. Nature. 2016;539:207–216. doi: 10.1038/nature20414. [DOI] [PubMed] [Google Scholar]
- Amati-Bonneau P., Valentino M.L., Reynier P., Gallardo M.E., Bornstein B., Boissière A., Campos Y., Rivera H., de la Aleja J.G., Carroccia R. OPA1 mutations induce mitochondrial DNA instability and optic atrophy ‘plus’ phenotypes. Brain. 2008;131:338–351. doi: 10.1093/brain/awm298. [DOI] [PubMed] [Google Scholar]
- Bae E.J., Yang N.Y., Lee C., Kim S., Lee H.J., Lee S.J. Haploinsufficiency of cathepsin D leads to lysosomal dysfunction and promotes cell-to-cell transmission of α-synuclein aggregates. Cell Death Dis. 2015;6:e1901. doi: 10.1038/cddis.2015.283. [DOI] [PMC free article] [PubMed] [Google Scholar]
- Carelli V., Musumeci O., Caporali L., Zanna C., La Morgia C., Del Dotto V., Porcelli A.M., Rugolo M., Valentino M.L., Iommarini L. Syndromic parkinsonism and dementia associated with OPA1 missense mutations. Ann. Neurol. 2015;78:21–38. doi: 10.1002/ana.24410. [DOI] [PMC free article] [PubMed] [Google Scholar]
- Chevrollier A., Guillet V., Loiseau D., Gueguen N., de Crescenzo M.A., Verny C., Ferre M., Dollfus H., Odent S., Milea D. Hereditary optic neuropathies share a common mitochondrial coupling defect. Ann. Neurol. 2008;63:794–798. doi: 10.1002/ana.21385. [DOI] [PubMed] [Google Scholar]
- Cipolat S., Martins de Brito O., Dal Zilio B., Scorrano L. OPA1 requires mitofusin 1 to promote mitochondrial fusion. Proc. Natl. Acad. Sci. USA. 2004;101:15927–15932. doi: 10.1073/pnas.0407043101. [DOI] [PMC free article] [PubMed] [Google Scholar]
- Cogliati S., Frezza C., Soriano M.E., Varanita T., Quintana-Cabrera R., Corrado M., Cipolat S., Costa V., Casarin A., Gomes L.C. Mitochondrial cristae shape determines respiratory chain supercomplexes assembly and respiratory efficiency. Cell. 2013;155:160–171. doi: 10.1016/j.cell.2013.08.032. [DOI] [PMC free article] [PubMed] [Google Scholar]
- Conrad M., Angeli J.P.F., Vandenabeele P., Stockwell B.R. Regulated necrosis: disease relevance and therapeutic opportunities. Nat. Rev. Drug Discov. 2016;15:348–366. doi: 10.1038/nrd.2015.6. [DOI] [PMC free article] [PubMed] [Google Scholar]
- Degterev A., Linkermann A. Generation of small molecules to interfere with regulated necrosis. Cell. Mol. Life Sci. 2016;73:2251–2267. doi: 10.1007/s00018-016-2198-x. [DOI] [PMC free article] [PubMed] [Google Scholar]
- Degterev A., Huang Z., Boyce M., Li Y., Jagtap P., Mizushima N., Cuny G.D., Mitchison T.J., Moskowitz M.A., Yuan J. Chemical inhibitor of nonapoptotic cell death with therapeutic potential for ischemic brain injury. Nat. Chem. Biol. 2005;1:112–119. doi: 10.1038/nchembio711. [DOI] [PubMed] [Google Scholar]
- Del Dotto V., Mishra P., Vidoni S., Fogazza M., Maresca A., Caporali L., McCaffery J.M., Cappelletti M., Baruffini E., Lenaers G. OPA1 isoforms in the hierarchical organization of mitochondrial functions. Cell Rep. 2017;19:2557–2571. doi: 10.1016/j.celrep.2017.05.073. [DOI] [PubMed] [Google Scholar]
- Deleidi M., Gasser T. The role of inflammation in sporadic and familial Parkinson’s disease. Cell. Mol. Life Sci. 2013;70:4259–4273. doi: 10.1007/s00018-013-1352-y. [DOI] [PMC free article] [PubMed] [Google Scholar]
- Fatokun A.A., Dawson V.L., Dawson T.M. Parthanatos: mitochondrial-linked mechanisms and therapeutic opportunities. Br. J. Pharmacol. 2014;171:2000–2016. doi: 10.1111/bph.12416. [DOI] [PMC free article] [PubMed] [Google Scholar]
- Folmes C.D.L., Nelson T.J., Martinez-Fernandez A., Arrell D.K., Lindor J.Z., Dzeja P.P., Ikeda Y., Perez-Terzic C., Terzic A. Somatic oxidative bioenergetics transitions into pluripotency-dependent glycolysis to facilitate nuclear reprogramming. Cell Metab. 2011;14:264–271. doi: 10.1016/j.cmet.2011.06.011. [DOI] [PMC free article] [PubMed] [Google Scholar]
- Fratter C., Gorman G.S., Stewart J.D., Buddles M., Smith C., Evans J., Seller A., Poulton J., Roberts M., Hanna M.G. The clinical, histochemical, and molecular spectrum of PEO1 (Twinkle)-linked adPEO. Neurology. 2010;74:1619–1626. doi: 10.1212/WNL.0b013e3181df099f. [DOI] [PMC free article] [PubMed] [Google Scholar]
- Frezza C., Cipolat S., Martins de Brito O., Micaroni M., Beznoussenko G.V., Rudka T., Bartoli D., Polishuck R.S., Danial N.N., De Strooper B., Scorrano L. OPA1 controls apoptotic cristae remodeling independently from mitochondrial fusion. Cell. 2006;126:177–189. doi: 10.1016/j.cell.2006.06.025. [DOI] [PubMed] [Google Scholar]
- Giannoccaro M.P., La Morgia C., Rizzo G., Carelli V. Mitochondrial DNA and primary mitochondrial dysfunction in Parkinson’s disease. Mov. Disord. 2017;32:346–363. doi: 10.1002/mds.26966. [DOI] [PubMed] [Google Scholar]
- Giordano C., Iommarini L., Giordano L., Maresca A., Pisano A., Valentino M.L., Caporali L., Liguori R., Deceglie S., Roberti M. Efficient mitochondrial biogenesis drives incomplete penetrance in Leber’s hereditary optic neuropathy. Brain. 2014;137:335–353. doi: 10.1093/brain/awt343. [DOI] [PMC free article] [PubMed] [Google Scholar]
- Grootjans S., Vanden Berghe T., Vandenabeele P. Initiation and execution mechanisms of necroptosis: an overview. Cell Death Differ. 2017;24:1184–1195. doi: 10.1038/cdd.2017.65. [DOI] [PMC free article] [PubMed] [Google Scholar]
- Hardy J. Genetic analysis of pathways to Parkinson disease. Neuron. 2010;68:201–206. doi: 10.1016/j.neuron.2010.10.014. [DOI] [PMC free article] [PubMed] [Google Scholar]
- Hartmann A., Troadec J.D., Hunot S., Kikly K., Faucheux B.A., Mouatt-Prigent A., Ruberg M., Agid Y., Hirsch E.C. Caspase-8 is an effector in apoptotic death of dopaminergic neurons in Parkinson’s disease, but pathway inhibition results in neuronal necrosis. J. Neurosci. 2001;21:2247–2255. doi: 10.1523/JNEUROSCI.21-07-02247.2001. [DOI] [PMC free article] [PubMed] [Google Scholar]
- Hirsch E.C., Hunot S., Hartmann A. Neuroinflammatory processes in Parkinson’s disease. Parkinsonism Relat. Disord. 2005;11(Suppl 1):S9–S15. doi: 10.1016/j.parkreldis.2004.10.013. [DOI] [PubMed] [Google Scholar]
- Horvath R., Hudson G., Ferrari G., Fütterer N., Ahola S., Lamantea E., Prokisch H., Lochmüller H., McFarland R., Ramesh V. Phenotypic spectrum associated with mutations of the mitochondrial polymerase gamma gene. Brain. 2006;129:1674–1684. doi: 10.1093/brain/awl088. [DOI] [PubMed] [Google Scholar]
- Iommarini L., Maresca A., Caporali L., Valentino M.L., Liguori R., Giordano C., Carelli V. Revisiting the issue of mitochondrial DNA content in optic mitochondriopathies. Neurology. 2012;79:1517–1519. doi: 10.1212/WNL.0b013e31826d5f72. [DOI] [PubMed] [Google Scholar]
- Ito Y., Ofengeim D., Najafov A., Das S., Saberi S., Li Y., Hitomi J., Zhu H., Chen H., Mayo L. RIPK1 mediates axonal degeneration by promoting inflammation and necroptosis in ALS. Science. 2016;353:603–608. doi: 10.1126/science.aaf6803. [DOI] [PMC free article] [PubMed] [Google Scholar]
- Kang E., Wang X., Tippner-Hedges R., Ma H., Folmes C.D.L., Gutierrez N.M., Lee Y., Van Dyken C., Ahmed R., Li Y. Age-Related accumulation of somatic mitochondrial DNA mutations in adult-derived human iPSCs. Cell Stem Cell. 2016;18:625–636. doi: 10.1016/j.stem.2016.02.005. [DOI] [PubMed] [Google Scholar]
- Levy O.A., Malagelada C., Greene L.A. Cell death pathways in Parkinson’s disease: proximal triggers, distal effectors, and final steps. Apoptosis. 2009;14:478–500. doi: 10.1007/s10495-008-0309-3. [DOI] [PMC free article] [PubMed] [Google Scholar]
- Lorenz C., Lesimple P., Bukowiecki R., Zink A., Inak G., Mlody B., Singh M., Semtner M., Mah N., Auré K. Human iPSC-derived neural progenitors are an effective drug discovery model for neurological mtDNA disorders. Cell Stem Cell. 2017;20:659–674.e9. doi: 10.1016/j.stem.2016.12.013. [DOI] [PubMed] [Google Scholar]
- MacVicar T., Langer T. OPA1 processing in cell death and disease - the long and short of it. J. Cell Sci. 2016;129:2297–2306. doi: 10.1242/jcs.159186. [DOI] [PubMed] [Google Scholar]
- Martin H.L., Santoro M., Mustafa S., Riedel G., Forrester J.V., Teismann P. Evidence for a role of adaptive immune response in the disease pathogenesis of the MPTP mouse model of Parkinson’s disease. Glia. 2016;64:386–395. doi: 10.1002/glia.22935. [DOI] [PMC free article] [PubMed] [Google Scholar]
- Nalls M.A., Duran R., Lopez G., Kurzawa-Akanbi M., McKeith I.G., Chinnery P.F., Morris C.M., Theuns J., Crosiers D., Cras P. A multicenter study of glucocerebrosidase mutations in dementia with Lewy bodies. JAMA Neurol. 2013;70:727–735. doi: 10.1001/jamaneurol.2013.1925. [DOI] [PMC free article] [PubMed] [Google Scholar]
- Obeso J.A., Rodriguez-Oroz M.C., Goetz C.G., Marin C., Kordower J.H., Rodriguez M., Hirsch E.C., Farrer M., Schapira A.H.V., Halliday G. Missing pieces in the Parkinson’s disease puzzle. Nat. Med. 2010;16:653–661. doi: 10.1038/nm.2165. [DOI] [PubMed] [Google Scholar]
- Ofengeim D., Ito Y., Najafov A., Zhang Y., Shan B., DeWitt J.P., Ye J., Zhang X., Chang A., Vakifahmetoglu-Norberg H. Activation of necroptosis in multiple sclerosis. Cell Rep. 2015;10:1836–1849. doi: 10.1016/j.celrep.2015.02.051. [DOI] [PMC free article] [PubMed] [Google Scholar]
- Perales-Clemente E., Cook A.N., Evans J.M., Roellinger S., Secreto F., Emmanuele V., Oglesbee D., Mootha V.K., Hirano M., Schon E.A. Natural underlying mtDNA heteroplasmy as a potential source of intra-person hiPSC variability. EMBO J. 2016;35:1979–1990. doi: 10.15252/embj.201694892. [DOI] [PMC free article] [PubMed] [Google Scholar]
- Perier C., Bové J., Wu D.-C., Dehay B., Choi D.-K., Jackson-Lewis V., Rathke-Hartlieb S., Bouillet P., Strasser A., Schulz J.B. Two molecular pathways initiate mitochondria-dependent dopaminergic neurodegeneration in experimental Parkinson’s disease. Proc. Natl. Acad. Sci. USA. 2007;104:8161–8166. doi: 10.1073/pnas.0609874104. [DOI] [PMC free article] [PubMed] [Google Scholar]
- Re D.B., Le Verche V., Yu C., Amoroso M.W., Politi K.A., Phani S., Ikiz B., Hoffmann L., Koolen M., Nagata T. Necroptosis drives motor neuron death in models of both sporadic and familial ALS. Neuron. 2014;81:1001–1008. doi: 10.1016/j.neuron.2014.01.011. [DOI] [PMC free article] [PubMed] [Google Scholar]
- Sedelis M., Schwarting R.K., Huston J.P. Behavioral phenotyping of the MPTP mouse model of Parkinson’s disease. Behav. Brain Res. 2001;125:109–125. doi: 10.1016/s0166-4328(01)00309-6. [DOI] [PubMed] [Google Scholar]
- Sheridan C., Delivani P., Cullen S.P., Martin S.J. Bax- or Bak-induced mitochondrial fission can be uncoupled from cytochrome C release. Mol. Cell. 2008;31:570–585. doi: 10.1016/j.molcel.2008.08.002. [DOI] [PubMed] [Google Scholar]
- Sidransky E., Nalls M.A., Aasly J.O., Aharon-Peretz J., Annesi G., Barbosa E.R., Bar-Shira A., Berg D., Bras J., Brice A. Multicenter analysis of glucocerebrosidase mutations in Parkinson’s disease. N. Engl. J. Med. 2009;361:1651–1661. doi: 10.1056/NEJMoa0901281. [DOI] [PMC free article] [PubMed] [Google Scholar]
- Takahashi N., Duprez L., Grootjans S., Cauwels A., Nerinckx W., DuHadaway J.B., Goossens V., Roelandt R., Van Hauwermeiren F., Libert C. Necrostatin-1 analogues: critical issues on the specificity, activity and in vivo use in experimental disease models. Cell Death Dis. 2012;3:e437. doi: 10.1038/cddis.2012.176. [DOI] [PMC free article] [PubMed] [Google Scholar]
- Vanden Berghe T., Linkermann A., Jouan-Lanhouet S., Walczak H., Vandenabeele P. Regulated necrosis: the expanding network of non-apoptotic cell death pathways. Nat. Rev. Mol. Cell Biol. 2014;15:135–147. doi: 10.1038/nrm3737. [DOI] [PubMed] [Google Scholar]
- Venderova K., Park D.S. Programmed cell death in Parkinson’s disease. Cold Spring Harb. Perspect. Med. 2012;2:a009365. doi: 10.1101/cshperspect.a009365. [DOI] [PMC free article] [PubMed] [Google Scholar]
- Vila M., Przedborski S. Targeting programmed cell death in neurodegenerative diseases. Nat. Rev. Neurosci. 2003;4:365–375. doi: 10.1038/nrn1100. [DOI] [PubMed] [Google Scholar]
- Vila M., Jackson-Lewis V., Vukosavic S., Djaldetti R., Liberatore G., Offen D., Korsmeyer S.J., Przedborski S. Bax ablation prevents dopaminergic neurodegeneration in the 1-methyl- 4-phenyl-1,2,3,6-tetrahydropyridine mouse model of Parkinson’s disease. Proc. Natl. Acad. Sci. USA. 2001;98:2837–2842. doi: 10.1073/pnas.051633998. [DOI] [PMC free article] [PubMed] [Google Scholar]
- Vitner E.B., Salomon R., Farfel-Becker T., Meshcheriakova A., Ali M., Klein A.D., Platt F.M., Cox T.M., Futerman A.H. RIPK3 as a potential therapeutic target for Gaucher’s disease. Nat. Med. 2014;20:204–208. doi: 10.1038/nm.3449. [DOI] [PubMed] [Google Scholar]
- Wang Z., Jiang H., Chen S., Du F., Wang X. The mitochondrial phosphatase PGAM5 functions at the convergence point of multiple necrotic death pathways. Cell. 2012;148:228–243. doi: 10.1016/j.cell.2011.11.030. [DOI] [PubMed] [Google Scholar]
- Young M.J., Copeland W.C. Human mitochondrial DNA replication machinery and disease. Curr. Opin. Genet. Dev. 2016;38:52–62. doi: 10.1016/j.gde.2016.03.005. [DOI] [PMC free article] [PubMed] [Google Scholar]
- Yu-Wai-Man P., Griffiths P.G., Gorman G.S., Lourenco C.M., Wright A.F., Auer-Grumbach M., Toscano A., Musumeci O., Valentino M.L., Caporali L. Multi-system neurological disease is common in patients with OPA1 mutations. Brain. 2010;133:771–786. doi: 10.1093/brain/awq007. [DOI] [PMC free article] [PubMed] [Google Scholar]
- Zanna C., Ghelli A., Porcelli A.M., Karbowski M., Youle R.J., Schimpf S., Wissinger B., Pinti M., Cossarizza A., Vidoni S. OPA1 mutations associated with dominant optic atrophy impair oxidative phosphorylation and mitochondrial fusion. Brain. 2008;131:352–367. doi: 10.1093/brain/awm335. [DOI] [PubMed] [Google Scholar]
- Zhang S., Tang M.-B., Luo H.-Y., Shi C.-H., Xu Y.-M. Necroptosis in neurodegenerative diseases: a potential therapeutic target. Cell Death Dis. 2017;8:e2905. doi: 10.1038/cddis.2017.286. [DOI] [PMC free article] [PubMed] [Google Scholar]
- Zhang Y., Su S.S., Zhao S., Yang Z., Zhong C.-Q., Chen X., Cai Q., Yang Z.-H., Huang D., Wu R., Han J. RIP1 autophosphorylation is promoted by mitochondrial ROS and is essential for RIP3 recruitment into necrosome. Nat. Commun. 2017;8:14329. doi: 10.1038/ncomms14329. [DOI] [PMC free article] [PubMed] [Google Scholar]
Associated Data
This section collects any data citations, data availability statements, or supplementary materials included in this article.