

Predominant niche-based process assembly of megacity skin microbiomes results in a relatively fragile microbial network.
Abstract
Given the higher incidence of skin diseases in more urbanized populations and its association with the skin microbiome, we questioned how the skin microbiome differed depending on the degree of urbanization. Skin microbiomes of 231 healthy subjects in five large cities in China varied mainly with environment and socioeconomic status of the cities in question. The differences among microbiomes could be explained by the predominantly niche-based assembly of microbial communities, which was supported by a dominance test, β-null deviation, and edge-length abundance distribution. Networks among microbes in larger cities were more fragile, which may contribute to the higher incidence of skin diseases in more urbanized environments. These results suggest that microbial ecological theory can provide a framework for understanding crucial health-associated features of the human microbiome.
INTRODUCTION
Skin is the largest organ of the human body and functions as the first line of defense against injury and infection by providing a physical barrier and immune protection. The skin microbiome, which is composed of various bacteria, fungi, and viruses (1), also plays a critical role in host defense. The diversity, composition, and stability of skin microbiomes are influenced by individual-specific qualities (2–4) and host genetics (5, 6). Besides host intrinsic factors, environmental factors, including the residential environment (7, 8), have been conjectured to modulate the skin microbiome and to affect human health and cause diseases (9–11). Assessing the impact of residential environment (for example, living in urban versus rural areas) on skin microbes is important to addressing its association with human skin health. Thus, we focused on addressing the skin microbial community assembly process by implementing microbial ecological metacommunity theory. We questioned whether the skin microbiome was typically assembled by a repeatable niche-based process or a random process based on the current skin microbial community (assemblage) data. The microbial community assembly process can be tested on the basis of the unified neutral theory proposed by Hubbell and further developed by Sloan. This neutral model suggests that community assembly is random under the assumption that species are ecologically and trophically equivalent (12–15). In contrast, the niche-based process, which may be accepted by rejecting the neutral theory as a null model, assumes that different species occupy different niches dictated by local environmental filtering or interspecific competition (14, 16).
Here, we determined whether the residential environments of five Chinese cities (each with a population of more than a million) triggered divergent microbial community assembly processes, resulting in intercity heterogeneity among skin microbiomes. Compared to rural areas, a higher prevalence of skin diseases (for example, atopic dermatitis and allergy) has repeatedly been reported in urban areas (17–19). Using 16S ribosomal RNA (rRNA) gene amplicon sequencing, we compared the skin microbiomes of young healthy Chinese women living in three large cities, namely, Kunming (Yunnam), Xi’an (Shaanxi), and Hohhot (Neimenggu), and two megacities (defined as having a population of more than 10 million), namely, Beijing and Guangzhou (Fig. 1, A and B). By applying ecological theory, our results provide an understanding of how the skin microbiome is assembled and its possible relevance to human health.
Fig. 1. Variation among the skin microbiomes of 231 healthy young Chinese women.
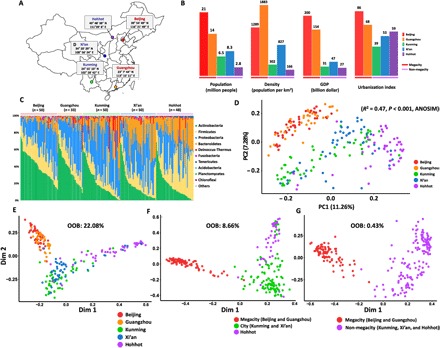
(A) Geographical locations of five large cities in China, where the subjects were recruited. These cities are at least 409 km away from each other. (B) City indices (population, density, GDP, and urbanization) of the five cities obtained from the China Statistical Yearbook 2013 showed various differences. (C) Mean relative abundance of bacterial phyla on human skin among the five cities. (D) Principal coordinates (PC1 and PC2) analysis of the skin microbiome derived from the unweighted UniFrac distance based on the 97% similar OTUs across the different cities. The percentage values indicated in parentheses denote the proportion of variation explained by each ordination axis. There was a significant difference in composition among cities [R2 = 0.47, P < 0.001, ANOSIM]. (E to G) Multidimensional plot of the proximity matrix calculated using random forest modeling of the bacterial composition data from the 231 subjects. We conducted random forest analysis for five groups (E), three groups (F), and two groups (G) and determined that it was most appropriate to divide all the samples into two groups based on the lowest OOB error rate of 0.43%.
RESULTS
The overall structure of skin microbiomes in five large cities
We designed this experiment to eliminate host-associated intrinsic variations such as sex, age, and ethnicity by recruiting only female subjects of the Han ethnic group between the ages of 25 and 35 years. We collected cutaneous microbiota from the cheeks of 231 healthy women who had resided in the same city for more than 5 years without taking prescribed medications used to treat skin diseases (table S1). The included cities were located at least 409 km away from each other, with diverse climates and differing outdoor air quality (fig. S1). For analyzing the skin microbial communities of the 231 participants, averages of 30,768 (Beijing), 32,199 (Guangzhou), 19,656 (Kunming), 15,727 (Xi’an), and 16,550 (Hohhot) merged sequences per sample were obtained and subsequently clustered using UCLUST into 51,250 distinct operational taxonomic units (OTUs) based on 97% sequence identity. Four predominant phyla—Proteobacteria (34%), Actinobacteria (26%), Firmicutes (21%), and Bacteroidetes (16%)—accounted for more than 90% of the skin microbiomes (Fig. 1C). The relative abundances of Actinobacteria and Bacteroides were inversely correlated, as were those of Proteobacteria and Firmicutes (fig. S2). Propionibacterium (18.5%) was the most dominant genus, followed by Enhydrobacter (6.9%), Chryseobacterium (6.6%), Staphylococcus (6.3%), and Sphingomonas (5.4%) (fig. S3 and table S2).
Principal coordinates analysis with both unweighted (Fig. 1D) and weighted (fig. S4) UniFrac distances confirmed the heterogeneity of skin microbiomes among the five cities [R2 = 0.47, P < 0.001 and R2 = 0.26, P < 0.001, respectively, determined by analysis of similarities (ANOSIM)]. The megacity and non-megacity groups showed a clear separation. A distance-decay relationship (linear regression R2 = 0.033) (fig. S5) was not observed, indicating little or no correlation between geographical distance and skin microbiomes’ intercity heterogeneity. A random forest analysis (20), which is a supervised machine-learning technique and a powerful classifier, confirmed that using two groups (megacities and non-megacities) exhibited the lowest misclassification error [overall out-of-bag (OOB) error rate = 0.43%] (Fig. 1, E to G) compared to that using five groups (each city was grouped separately; OOB error rate = 22.08%) or three groups (megacities, Kunming and Xi’an, and Hohhot; OOB error rate = 8.66%) (Fig. 1, E and F). The skin microbiomes were grouped into megacities (Beijing and Guangzhou) and non-megacities (other three cities). The megacities had a higher population, population density, gross domestic product (GDP), and urbanization index than the non-megacities (Fig. 1, B, C, and G). We observed the greater extent of interindividual variations within the skin microbiomes of non-megacities than those of megacities (Fig. 1D and fig. S6). Also, the higher numbers of total observed OTUs (by cities) in non-megacities than others indicated that the skin microbiomes of non-megacities are composed of a more diverse pool of regional species.
Community assembly process measurements with β-null deviation
Given the intercity heterogeneity among skin microbiomes, we applied three complementary methods to determine the differences in microbial community assembly process by cities. First, we used an abundance-based β-null deviation method for the calculation of β diversity, which compares between the observed microbial community and a randomly assembled null model community based on the neutral model suggested by Tucker et al. (21). Tucker devised five metacommunity types, from niche-structured type 1 to neutral-structured type 5, using measured β diversity of identical 25 patches and 25 species. A β diversity deviation close to zero was interpreted as an assembly of communities based on the neutral model, whereas values larger or smaller than zero suggested a niche-based community assembly (22, 23). Tucker’s simulation indicated that β-null deviation was not robust to differences in the abundance evenness distributions or sampling of communities. Thus, we randomly selected 32 microbiome samples (table S3) with the same number of OTUs (19,712) from each city in Guangzhou, which had the smallest sample set, to make the number of samples of cities equal. Next, we performed simulations with 10 β-distance matrices and confirmed that the β-null deviation pattern with an abundance-based Canberra distance was the most sensitive pattern for distinguishing between the neutral and niche-based assembly processes in our data set. The results showed that the β-null deviation pattern was higher in megacities than in the non-megacities, indicating that the community assembly of skin microbiomes in megacities was a more niche-based process than that in the non-megacities (Fig. 2, A and B) (21).
Fig. 2. Assessment of the community assembly process using abundance-based β-null deviation measures and EAD.
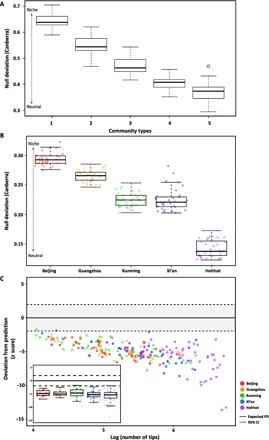
Abundance-based β-null deviations were measured for the five models of metacommunity assembly, ranging from niche-structured (type 1) to neutral (type 5) comprising 19,712 OTUs in 32 patches (microbiomes) by comparing the β diversity of the observed microbial community and the null-modeled community using the Canberra distance metric. (A) β-Null deviations measured for the five community types designed by Tucker et al. (B) Calculated deviations separated the community assembly processes into niche- or neutral-based models. (C) Standardized difference, in units of SDs (z score), between the observed and expected phylogenetic diversities (PD). The scatterplot and boxplot graph show the distribution of z scores in each region. The dashed line indicates the 95% CI. The black line and whiskers in the boxplot represent the median and range of the minimum and maximum z score among the communities, excluding outliers.
Community assembly process measurements with edge-length abundance distribution
Second, we applied the phylogenetic diversity (PD) theory to confirm microbial community assembly. PD represents the evolutionary history defined as the sum of the branch lengths in the associated phylogenetic tree (24, 25). O’Dwyer et al. (26) developed the edge-length abundance distribution (EAD) method for determining the phylogenetic structure of a metacommunity to understand the microbial community assembly process by applying the PD theory. EAD focuses on the phylogenetic tree branch length, which indicates the evolutionary distance of the given descendant tips in a clade. We investigated whether PDs of the skin microbiomes from each city were more or less than the expected PD of a randomly generated null-modeled local community from a metacommunity. For each subject’s microbiome, a PD plotted within the 95% confidence interval (CI) of the expected PD indicated that the skin microbiome was assembled by a neutral process. PD lower than the expected PD represents phylogenetic clustering as evidence of environmental filtering of features that have been phylogenetically conserved, whereas PD higher than the expected PD represents phylogenetic overdispersion, implying competitive exclusion (27). All except 2 of 231 observed PDs were lower than the expected PD, and deviations from the prediction (represented by the z score) indicated that the skin microbiomes of the five cities were affected by niche-based processes, especially environmental filtering, regardless of the city size (Fig. 2C and fig. S7).
Community assembly process measurements with dominance test
Third, we fitted the occurrence frequency and mean relative abundance of the observed bacterial taxa among the individual skin microbiomes (the so-called dominance test) into those predicted from the metacommunity by applying the Sloan neutral community model (28) without considering bacterial speciation. The Sloan neutral model evaluates whether the microbial assembly process from a metacommunity follows a neutral model or a niche-based process as a function of the metacommunity log abundance. In Fig. 3A, the outlying taxa beyond the dashed line had frequencies higher or lower than that predicted by the model, supporting the hypothesis that the community was assembled through a niche-based process rather than a neutral model. As a result, Beijing, Guangzhou, and Kunming (R2 = 0.598, 0.521, and 0.572, respectively) were better fitted to the niche-based models, as indicated by their lower R2 values in dominance analysis, compared with Xi’an and Hohhot (Fig. 3A and data file S1). In addition, Hohhot [migration rate (m) = 0.178] was under a greater influence of dispersal, which may be correlated with the assembly of microbial communities in Hohhot by the neutral process. The discord in fitting to a neutral model and the minimal influence of dispersal suggested that neutral processes play a lesser role in the skin microbiome assembly process in megacities than in non-megacities.
Fig. 3. Assessment of skin microbiome assembly process and network of skin microbes.
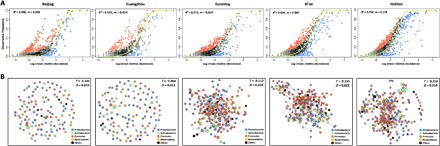
(A) Fit of Sloan’s neutral model for analysis of microbial community assembly. The solid green line represents the best-fitting neutral model. The dashed line represents the 95% CIs around the best-fitting neutral model. OTUs within the CIs (black points) follow the neutral process, and OTUs that occur more frequently than predicted by the model are shown in red, whereas those that occur less frequently than predicted are shown in blue. (B) Network analysis of bacterial OTUs of the skin microbiome. Color markings indicate the major taxa at phylum level. The T and D values shown in the box represent the transitivity (clustering coefficient) and density, which was calculated using the ratio of the number of edges. Each node represents the OTUs, and the size of each node is proportional to the relative abundance.
Characteristics of microbial networks
To examine the overall structure and connectivity of skin microbes’ network, OTUs networks were constructed by SParse InversE Covariance estimation for Ecological Association Inference (SPIEC-EASI) analysis (29–31). Network density (D) of the skin microbiome, calculated using the ratio of the number of edges, was lower in megacities (D = 0.016 and 0.012 in Beijing and Guangzhou, respectively) than in non-megacities (D = 0.019, 0.022, and 0.019 in Kunming, Xi’an, and Hohhot, respectively) (Fig. 3B). We also calculated the network transitivity (T) (that is, the probability that the close nodes of a node are connected), termed as the clustering coefficient, and found that microbial networks of non-megacities (T = 0.112, 0.155, and 0.153 in Kunming, Xi’an, and Hohhot, respectively) had more complex structures than those of megacities (T = 0.101 and 0.064 in Beijing and Guangzhou, respectively).
Factors affecting skin microbiomes
All these analyses (the three complementary analyses of skin microbiomes) suggested that the skin microbiome of megacities was formed by a more niche-based process as compared to that of non-megacities (Fig. 4A). The microbial network was more fragile in megacities, showing lower network density than in non-megacities (Fig. 4A). Our findings sufficiently support the hypothesis that skin microbiomes were affected and controlled by certain environmental factors (including climatic variables), the socioeconomic status of the city, and host-associated intrinsic factors (Fig. 4B). We calculated the mean square error (MSE) based on random forest modeling to identify the most influential factors for the microbial assembly process–associated index from the β-null deviation value, R2, migration rate (m) in the dominance test, and density and transitivity in the microbial network analysis (table S4). Higher MSE values for environmental and socioeconomic status factors indicated their higher importance in the skin microbiome assembly process rather than host-specific factors such as pH, moisture, oil, transepidermal water loss, and keratin substances (Fig. 4B and fig. S8) (20). Furthermore, on the basis of a Kyoto Encyclopedia of Genes and Genomes (KEGG) pathway analysis, genes assigned to the environmental information processing category were more prevalent in the inferred metagenomes from megacities, as obtained using the Phylogenetic Investigation of Communities by Reconstruction of Unobserved States (PICRUSt) algorithm (Fig. 4C and fig. S9) (32, 33). This finding suggested that the niche-based assembly process (which is especially influenced by environmental filtering) of the skin microbiomes of megacities required more genes and pathways to detect and respond to environmental signals.
Fig. 4. Interpretation of the skin microbiome signatures in five large cities in China.
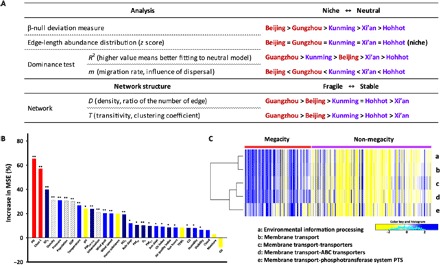
(A) Outline of the characteristics of the skin microbiome in five cities. Three complementary analyses and microbial network analysis were conducted to compare the robustness of the community assembly process and network. (B) Identification of the influencing factors that determine the characteristics of the skin microbiome for the β-null deviation values using random forest modeling. Asterisks indicate the significance level of each factor (**P < 0.001, *P < 0.05). The color or pattern of each box represents the following factors: red, value of α diversity; dark blue, atmospheric environmental factors; blue, climatic environmental factors; diagonal line pattern, city indices; and yellow, host-specific factors. (C) Heat map for the functional pathway of “environmental information processing,” which showed a significant difference between the two groups. UV index, ultraviolet index. PM, particulate matter; TEWL, transepidermal water loss; PTS, phosphotransferase system.
DISCUSSION
Influenced by the immune system, genetic diversity, host lifestyle, hygiene factors, and environmental changes, the human microbiome is associated both with many diseases and with immunity to disease (34). Thus, understanding the assembly process of microbial community is fundamental for comprehending the relationships between the human microbiome and health features. Decrease in diversity of the skin microbiome and collapse of community structure may be associated with skin diseases (35, 36). Noninfectious diseases such as atopic dermatitis, psoriasis, and acne have been associated with large-scale changes in skin microbial communities (1). Network collapse of the microbiome and decrease in the bacterial community diversity with an overabundance of specific pathogenic bacteria have also been reported in studies involving patients with atopic dermatitis (35), psoriasis (37), and dandruff/seborrheic dermatitis (36). We hypothesized that the skin microbiomes of megacities were assembled by more niche-based processes than those of non-megacities, which could be associated with the higher prevalence of certain skin diseases in megacities. This may be explained by the differences in the regional species pool within cities (that is, smaller species pool observed in megacities) (table S5). Then, given that the composition of a local (individual) microbial community is largely derived from the regional (city) species pools by environmental selection, skin microbial community assembly in megacities by niche-based processes is considered to originate selectively from regional species pools (38). As a consequence of the assembly process, compared to non-megacities, skin microbiomes of megacities showed lower richness (indicated by Chao 1) and network density. Although specific factors that could predict the network fragility of the microbiomes assembled by niche-based processes remain unidentified, the overall environmental and residential characteristics, trends in community assembly processes, and network structure stability revealed in this study provided novel insights into skin microbial community resilience. In an ecosystem, several factors determine resilience, which is the capacity of an ecosystem to recover from a perturbation or disturbance by withstanding damage and recovering quickly of the microbial community without collapsing into a different state. These results also serve as factors supporting the prediction of a microbiome’s fragility. Kong et al. (35) reported that as the level of atopic dermatitis [scoring atopic dermatitis (SCORAD) in Fig. 2A] increased (that is, the severity of the disease increased), α diversity of the skin microbiome decreased, which supports our point of view.
Application of ecological theory to understanding human microbiomes was highlighted with introduction of the basic steps required for the management of ecosystem services (38). Also, the general ecological framework would work equally well in ecosystems related to human health. Human microbiome studies could accelerate the implementation of an ecological approach to manipulate the human microbiome and eventually help in the development of medicines (that is, pharmabiotics). An improved understanding, based on ecological theory, of how microbiomes are assembled, could alter clinical practices by changing the perspective of clinicians toward treating infectious diseases and chronic inflammatory disorders. If pathogen infection in humans is hindered or modulated by particular kinds of microbial community assembly processes, this approach may also provide a solution for treating infectious diseases. The ecological theory approach for studying the skin microbiome that we have adopted in the present study can be applied as the cornerstone for the management of human ecosystem services. Thus, it is essential to know how a microbial community is assembled. An in-depth knowledge of the dominant processes of community assembly could directly change the way clinicians treat disease.
According to the World Health Organization (WHO), more than 80% of urban residents are exposed to higher levels of pollution than the WHO limits, and 98% of low- and middle-income cities do not meet the WHO air quality guidelines (39). Several studies have reported that air pollution can not only have a harmful impact on general skin health but also exacerbate skin diseases (40, 41). A study conducted in China revealed the correlation between skin problems and ambient pollution exposure. Notably, skin diseases such as urticaria, eczema, and contact dermatitis were observed to increase with higher levels of ozone (42). Improving potable water distribution to larger populations is a significant challenge in megacities, in addition to reducing wastewater and improving water quality. Owing to environmental and ecocultural variations (or city-dependent environmental differences), which are not solely determined by simple geographical differences, compared to non-megacity inhabitants, the skin health of residents in megacities is presumed to be influenced more by microbiomes that assembled through niche-based processes. Consequences of the niche-based assembly process may be represented not only in the skin, which is the organ that is most exposed to the environment, but also in other human organs hosting microbiota (for example, the gastrointestinal tract). However, urban environment and living conditions affect skin microbiome formation. High overall diversity and PD of skin microbial communities in cities with better environmental standards and higher socioeconomic status may be advantageous for human skin health. An individual’s residential environment and lifestyle have a significant impact on the formation process of skin microbiome. We also suggest that dermatological therapy and cosmetic applications might require location-specific approaches based on the differences in skin microbiota (for example, the abundance and species diversity of Staphylococcus, which is known to be important for human health and disease, is higher in megacities; fig. S10) associated with the influence of residential surroundings.
MATERIALS AND METHODS
Subject recruitment and sample collection
A total of 231 subjects without chronic skin diseases were recruited for this study, with 50 residing in Beijing (Hebei), 33 in Guangzhou (Guangdong), 50 in Hohhot (Neimenggu), 48 in Xi’an (Shaanxi), and 50 in Kunming (Yunnan). All subjects were women aged between 25 and 35 years who had lived in the sampling regions for at least 5 years and provided written consent before participation. In addition, we also conducted a simple survey on the use of cosmetics such as usage, frequency, and type and personal information such as occupation and highest level of education. For microbiological sampling, no facial cleansing or cosmetic use was permitted within 24 hours of sample collection. Samples were collected in temperature- and humidity-controlled rooms in April 2015 (Kunming, Xi’an, and Hohhot) and April 2016 (Beijing and Guangzhou). For collection, a 4-cm2 area from the cheek of each subject was swabbed with un-premoistened Catch-All sample collection swabs (QEC091H; Epicentre). Sampling regions were swabbed approximately 5230 times for at least 1 min. All swabs were stored at −80°C before being used for genomic DNA extraction. Swabbing has been reported as a suitable sampling method for microbial population analysis in the skin (8). For all cases, the collected samples were analyzed in accordance with protocols approved by the Chung-Ang University College of Medicine Institutional Review Board (P1504-034).
Skin parameter measurement
Skin hydration was measured using Corneometer CM 825 (Courage + Khazaka Electronic GmbH) and was expressed in arbitrary units (43). The sebum level was measured using Sebumeter SM 815 (Courage + Khazaka Electronic GmbH) and was expressed in arbitrary units. Skin surface pH was measured using Skin-pH-Meter PH 905 (Courage + Khazaka Electronic GmbH), and transepidermal water loss was measured with VapoMeter (Delfin Technologies).
Bacterial DNA extraction
Skin genomic DNA was extracted from swabs using the Invitrogen PureLink Genomic DNA Mini Kit (Life Technologies). Each swab head was transferred to a 1.5-ml screw-capped tube, and lysis buffer [20 mM tris (pH 8), 2 mM EDTA, and 1.2% Triton X-100] containing lysozyme (20 mg/ml; Sigma-Aldrich) was added to each tube. Next, proteinase K (20 mg/ml) was added to the lysis buffer at a ratio of 1:9. Equal volumes of the lysis binding buffer and two stainless steel beads (5 mm; Qiagen) were added to each tube. A mechanical bead beating step was performed using Mini-BeadBeater 16 (BioSpec Products) for 1 min. The tubes were chilled on ice for 10 min and subsequently incubated at 55°C for 30 min. Negative swab samples were included in the genomic DNA extraction step to confirm possible contamination. The extracted genomic DNA was obtained by elution with 30-μl PureLink Genomic Elution Buffer, quantitated using the NanoDrop 2000 spectrophotometer (Thermo Fisher Scientific), and stored at −80°C until sequencing.
Genomic DNA amplification via polymerase chain reaction and sequencing
For each sample, we amplified the v4-v5 region of 16S rRNA gene using the following barcoded fusion primers: amplicon polymerase chain reaction (PCR) by 518F-927R and index PCR by N7XX-S5XX. The forward primer (5′-TCG TCG GCA GCG TCA GAT GTG TAT AAG AGA CAG CCA GCA GCY GCG GTA AN-3′) contained the Illumina sequencing primer, and the reverse primer (5′-GTC TCG TGG GCT CGG AGA TGT GTA TAA GAG ACA GCC GTC AAT TCN TTT RAG T-3′) contained the Illumina preadapter. The thermal cycling conditions were as follows: initial denaturation at 95°C for 3 min, 25 cycles of amplification comprising denaturation at 95°C for 30 s, annealing at 55°C for 30 s, elongation at 72°C for 30 s, and a final extension at 72°C for 5 min. The amplified PCR products from each triplicate were purified using the AMPure XP beads. Index PCR was performed, and the obtained products were purified under the same conditions, except that eight cycles of amplification were used. DNA quality was measured using the PicoGreen dye (Thermo Fisher Scientific) and NanoDrop spectrophotometer. All purified products were quantified by quantitative PCR (qPCR) according to the qPCR Quantification Protocol Guide (KAPA Library Quantification Kits for Illumina sequencing platforms) and were qualified using the LabChip GX HT DNA High Sensitivity Kit (PerkinElmer). Paired-end (2 × 300 base pair) sequencing was performed by Macrogen using the MiSeq platform (Illumina).
Phylogenetic analysis
The resulting sequences were processed using the meren/illumina-utils (https://github.com/meren/illumina-utils) (44) and QIIME (Quantitative Insights into Microbial Ecology) pipeline (version 1.9.1) (45), which included alignment with PyNAST (46), taxonomic assignment with RDP (Ribosomal Database Project-II; http://rdp.cme.msu.edu), tree building with FastTree (47), subsampling to an equal sequencing depth, and diversity computations. Cyanobacteria of healthy skin are generally considered to be contaminants because of their sequence similarity to chloroplast DNA sequences, sometimes due to the use of herbal skin cosmetics (48). In our research, however, there were no reports of volunteers using these skin cosmetics. For further analysis, we removed cyanobacterium sequences from our raw data. Paired-end sequence reads were merged with quality-based filtering using default parameters (P = 0.3, Q score value = 10, and quality filtering = Q30). Sequences that did not contain the primer or an uncorrectable primer sequence were removed from the analysis. The merged sequences were clustered into OTUs according to a sequence similarity threshold of 97% by UCLUST (49). Representative sequences of OTUs were used to identify taxonomy assignment through the RDP classifier (50), which was performed with a 50% minimum support threshold. From the OTUs, α-diversity values were analyzed (chao 1 and PD whole tree) with a normalized depth of 4860 reads per sample in QIIME (alpha_rarefaction.py and alpha_diversity.py). Using QIIME script (beta_diversity.py), the unweighted UniFrac distance matrices were calculated. Principal coordinates analysis was conducted on the unweighted UniFrac distance matrices to evaluate differences in community composition among regions.
Linear discriminant analysis effect size and random forest analysis
To identify specific OTUs that showed regional variation, we performed linear discriminant analysis effect size (LEfSe) and random forest analyses for each sample. LEfSe on filtered data sets (51) was performed at the OTU level to identify features differentially represented between different city groups. LEfSe incorporates the standard tests to determine statistical significance [the Kruskal-Wallis test among classes was performed at the 0.05 significance level, and the threshold of the logarithmic linear discriminant analysis (LDA) score for discriminative features was set at 3.0]. Random forest analysis was conducted with 16S rRNA gene sequence data using the randomForest R package with 100 trees (52). Scripts, required packages, and instructions for processing data are available at https://gist.github.com/walterst/2222618976a66b3fc8dd.
Assessment of community assembly processes: β-Null deviation
Abundance-based β-null deviation indicates the deviation between the observed β diversity and null-expected β diversity of a randomly assembled pair of communities. We applied Tucker’s method for the metacommunity analysis of 25 species and 25 communities (patches) with some modifications to fit the microbial communities of our samples. Our microbial metacommunity consisted of 32 randomly selected communities and 19,712 OTUs, which were rarefied to 4860 reads per sample of each of the five cities. We applied various distance metrics such as Bray-Curtis, Euclidean, Canberra, Gower, Jaccard, Kulczynski, Manhattan, Morisita-Horn, Mountford, and Yue-Clayton for the analysis of microbial communities in our samples. Among these metrics, the Canberra distance metric was identified as the most suitable for our microbial community because it had the best resolution to separate communities into the niche- and neutral-based assembly models. Modeling was computed with a global migration rate (m) = 0.05 and competition coefficient (α) = 1/600, and the simulations began with 150 individuals of each species in the community and took 50 generations according to Tucker’s modeling conditions. To determine the null-expected β diversity, we calculated the pairwise β diversity between 999 randomly assembled pairs of samples to produce a distribution of null β diversity. We also conducted an analysis of five community types simulated by Tucker et al. (21) as a control by the same methods.
Assessment of community assembly processes: EAD
To evaluate the estimated PD of a total assembled community, we used QIIME to construct a phylogenetic tree with 16S rRNA sequences based on species-level taxonomy assignments. The tip and total PD were computed after rarefaction to 4860 sequences per sample. The total assembled phylogenetic tree contained 19,221 OTUs. The expected PD was calculated using the R package picante (26). The variance among phylogenetic trees of the exact and upper bound was also calculated using the R package picante. The SD (z score) distribution of each community was expressed as a boxplot. In the plot, the dashed lines (±1.96) represented the 95% CIs of the expected PD from the total assembled community. All cities had a negative z score, and only one sample from each Kunming and Xi’an fell within the CI.
Assessment of community assembly processes: Dominance test
To validate the potential impact of neutral processes on community assembly, we assessed our data for the suitability of the Sloan neutral model (28), which predicts relationships between the occurrence frequency of taxa in local communities and their abundance across a broad metacommunity. Because rare taxa in a metacommunity are likely to be lost from individual hosts because of ecological drift, the model generally predicts that abundant taxa will be more widespread in a metacommunity. Microbial speciation and diversification are sure to generate microbial diversity; however, because we focused on the assembly of skin microbial communities region-wise, in contrast with many other neutral models for biodiversity, we used a neutral model that does not include speciation processes. In addition, because our samples were not time-series collections, the occurrence of microbial diversification that affects diversity among communities over time was excluded from the model used here. Thus, the Sloan neutral model was fit for observing the occurrence frequency of OTUs in local communities and their abundance in a metacommunity with the migration rate (m), which was interpreted as the influence of dispersal. This analysis was performed using nonlinear least-squares fitting and the minpack.lm package in R. Calculation of 95% CIs for the model predictions was conducted using the Wilson score interval in the Hmisc package in R (53).
Ecological network construction
For the network analysis of skin microbiota, OTUs that had frequencies of at least 50% were collected. Next, OTUs that were not present in all five cities were excluded. In total, 121, 120, 222, 224, and 224 OTUs were used in the network analyses for Beijing, Guangzhou, Xi’an, Kunming, and Hohhot, respectively. We performed the statistical method SPIEC-EASI, which enables the inference of microbial ecological networks from OTU data sets. Our data sets contained hundreds to thousands of OTUs and tens to thousands of samples. Notably, there were more OTUs than samples, which was sufficient for constructing a meaningful interaction inference scheme (54). After transforming the OTU count data, we performed network analysis using the neighborhood algorithm (55) and StARS (Stability Approach to Regularization Selection) selection method (56) with a minimum λ threshold of 0.01. All steps were computed using the R package SpiecEasi (version 0.1.2) (54).
Functional predictions
Functions of skin bacteria were predicted using the PICRUSt algorithm (32) to predict the metagenome functional contents with QIIME. OTUs with a similarity of 97% were selected, and those corresponding to chloroplasts and mitochondria were removed from the normalized OTUs. Three steps, namely, “normalize by copy number,” “predict metagenome,” and “categorize by function,” were performed with PICRUSt tutorial 7 (http://picrust.github.io/picrust/) and the command predict_metagenomes.py. KEGG pathways were used to categorize the predicted metagenome functions. To analyze the PICRUSt results, we conducted the measurement of functional abundances in metagenome and performed random forest modeling to classify the samples culminating in the construction of 100 trees in R package stats. LEfSe was applied with an LDA score > 3.0. An α value of <0.05 was considered significant during LEfSe. The pathways predicted by PICRUSt were normalized as abundance over the entire pathway of each sample and represented as a heat map.
Statistical analysis
To find statistically significant causes for regional differences, we performed statistical analyses [analysis of variance (ANOVA)] for pH, moisture, oil, and transepidermal water loss data, but no significant relationship was identified. The ANOSIM method was applied to compare two or more groups depending on the distribution of location data in QIIME (compare_categories.py --method anosim). ANOVA for the distribution of skin parameter data and diversity significant tests was performed using the aov function in R-package stats. To determine the significance of α-diversity values, we performed nonparametric Mann-Whitney test for two groups and Kruskal-Wallis test for three groups using the wilcox.test function and kruskal.test functions in R, respectively. We performed a random forest analysis to identify the main factors influencing the microbial assembly process and microbial network among the following variables: environmental factors, socioeconomic status factors, and host-specific factors (tables S1 and S3). The environmental and socioeconomic status data used in the analysis were obtained from the National Bureau of Statistics of China and China Statistical Yearbook (2014 and 2015). This analysis was performed using the randomForest package for R (http://cran.r-project.org/), and the significance of the model was confirmed with 5000 permutations of the response variables (environmental and socioeconomic status factors) using the rfPermute package for R (52).
Supplementary Material
Acknowledgments
Funding: This research was supported by the AmorePacific Co. R&D Center (Applied Technology and Research Division). H.-J.K. was supported by a Basic Science Program through the National Research Foundation of Korea (NRF) funded by the Ministry of Education (NRF-2016R1A6A3A11933991, NRF-2014R1A1A2A16055779). Author contributions: S.A. and W.J.S. designed the research study. H.-J.K., H.K., T.P., E.K., J.L., and J.-y.C. performed the research. H.-J.K., J.J.K., N.R.M., T.K., and W.J.S. analyzed the data. H.-J.K. and W.J.S. wrote the paper. Competing interests: The authors declare that they have no competing interests. Data and materials availability: All data needed to evaluate the conclusions in the paper are present in the paper and/or the Supplementary Materials. Additional data related to this paper may be requested from the authors. The sequence data from this study have been archived at the National Center for Biotechnology Information Sequence Read Archive under accession number SRP076583 and BioProject accession number PRJNA324649.
SUPPLEMENTARY MATERIALS
Supplementary material for this article is available at http://advances.sciencemag.org/cgi/content/full/4/3/e1701581/DC1
fig. S1. Information of the geographical location and characteristics of each city.
fig. S2. Relative mean abundances of four predominant phyla.
fig. S3. Mean relative abundance of bacterial genera in the skin microbiome among the five cities in China.
fig. S4. Principal coordinate analysis with weighted UniFrac distances.
fig. S5. Distance decay analysis.
fig. S6. The β-diversity comparisons of the skin microbiome of the five cities.
fig. S7. Distribution of PD.
fig. S8. Analysis of MSE by random forest modeling.
fig. S9. Comparison of predicted functional metagenomic profiling using PICRUSt between the megacity and non-megacity groups.
fig. S10. The richness (observed OTUs) of the genus Staphylococcus in five cities.
table S1. Sample metadata, number of sequences, and α diversity across samples based on rarefaction of 4860 reads per sample.
table S2. Relative average abundances of the 15 most abundant genera.
table S3. Environmental factors and city indices of five cities.
table S4. Environmental factors and city indices of five cities.
table S5. The observed species pool of five cities.
data file S1. The information of OTUs in Fig. 3A.
REFERENCES AND NOTES
- 1.Grice E. A., Segre J. A., The skin microbiome. Nat. Rev. Microbiol. 9, 244–253 (2011). [DOI] [PMC free article] [PubMed] [Google Scholar]
- 2.Oh J., Byrd A. L., Deming C., Conlan S. NISC Comparative Sequencing Program, Kong H. H., Segre J. A., Biogeography and individuality shape function in the human skin metagenome. Nature 514, 59–64 (2014). [DOI] [PMC free article] [PubMed] [Google Scholar]
- 3.Oh J., Byrd A. L., Park M. NISC Comparative Sequencing Program, Kong H. H., Segre J. A., Temporal stability of the human skin microbiome. Cell 165, 854–866 (2016). [DOI] [PMC free article] [PubMed] [Google Scholar]
- 4.Flores G. E., Caporaso J. G., Henley J. B., Rideout J. R., Domogala D., Chase J., Leff J. W., Vázquez-Baeza Y., Gonzalez A., Knight R., Dunn R. R., Fierer N., Temporal variability is a personalized feature of the human microbiome. Genome Biol. 15, 531 (2014). [DOI] [PMC free article] [PubMed] [Google Scholar]
- 5.Blekhman R., Goodrich J. K., Huang K., Sun Q., Bukowski R., Bell J. T., Spector T. D., Keinan A., Ley R. E., Gevers D., Clark A. G., Host genetic variation impacts microbiome composition across human body sites. Genome Biol. 16, 191 (2015). [DOI] [PMC free article] [PubMed] [Google Scholar]
- 6.Si J., Lee S., Park J. M., Sung J., Ko G., Genetic associations and shared environmental effects on the skin microbiome of Korean twins. BMC Genomics 16, 992 (2015). [DOI] [PMC free article] [PubMed] [Google Scholar]
- 7.Ying S., Zeng D.-N., Chi L., Tan Y., Galzote C., Cardona C., Lax S., Gilbert J., Quan Z.-X., The influence of age and gender on skin-associated microbial communities in urban and rural human populations. PLOS ONE 10, e0141842 (2015). [DOI] [PMC free article] [PubMed] [Google Scholar]
- 8.Grice E. A., Kong H. H., Renaud G., Young A. C. NISC Comparative Sequencing Program, Bouffard G. G., Blakesley R. W., Wolfsberg T. G., Turner M. L., Segre J. A., A diversity profile of the human skin microbiota. Genome Res. 18, 1043–1050 (2008). [DOI] [PMC free article] [PubMed] [Google Scholar]
- 9.Rosenthal M., Goldberg D., Aiello A., Larson E., Foxman B., Skin microbiota: Microbial community structure and its potential association with health and disease. Infect. Genet. Evol. 11, 839–848 (2011). [DOI] [PMC free article] [PubMed] [Google Scholar]
- 10.Sanford J. A., Gallo R. L., Functions of the skin microbiota in health and disease. Semin. Immunol. 25, 370–377 (2013). [DOI] [PMC free article] [PubMed] [Google Scholar]
- 11.Peleg A. Y., Hogan D. A., Mylonakis E., Medically important bacterial–fungal interactions. Nat. Rev. Microbiol. 8, 340–349 (2010). [DOI] [PubMed] [Google Scholar]
- 12.S. P. Hubbell, The Unified Neutral Theory of Biodiversity and Biogeography (Mpb-32) (Princeton Univ. Press, 2001), vol. 32. [Google Scholar]
- 13.Chave J., Neutral theory and community ecology. Ecol. Lett. 7, 241–253 (2004). [Google Scholar]
- 14.Leibold M. A., McPeek M. A., Coexistence of the niche and neutral perspectives in community ecology. Ecology 87, 1399–1410 (2006). [DOI] [PubMed] [Google Scholar]
- 15.Schmidt V. T., Smith K. F., Melvin D. W., Amaral-Zettler L. A., Community assembly of a euryhaline fish microbiome during salinity acclimation. Mol. Ecol. 24, 2537–2550 (2015). [DOI] [PubMed] [Google Scholar]
- 16.Fargione J., Brown C. S., Tilman D., Community assembly and invasion: An experimental test of neutral versus niche processes. Proc. Natl. Acad. Sci. U.S.A. 100, 8916–8920 (2003). [DOI] [PMC free article] [PubMed] [Google Scholar]
- 17.Li F., Zhou Y., Li S., Jiang F., Jin X., Yan C., Tian Y., Zhang Y., Tong S., Shen X., Prevalence and risk factors of childhood allergic diseases in eight metropolitan cities in China: A multicenter study. BMC Public Health 11, 437 (2011). [DOI] [PMC free article] [PubMed] [Google Scholar]
- 18.Xu F., Yan S., Li F., Cai M., Chai W., Wu M., Fu C., Zhao Z., Kan H., Kang K., Xu J., Prevalence of childhood atopic dermatitis: An urban and rural community-based study in Shanghai, China. PLOS ONE 7, e36174 (2012). [DOI] [PMC free article] [PubMed] [Google Scholar]
- 19.Guo Y., Li P., Tang J., Han X., Zou X., Xu G., Xu Z., Wei F., Liu Q., Wang M., Xiao F., Zong W., Shen C., Li J., Liu J., Luo Y., Chang J., Sheng N., Dong C., Zhang D., Dai X., Zhou J., Meng C., Niu H., Shi X., Zhang X., Xiang J., Xu H., Ran Q., Zhou Y., Li M., Zhang H., Cheng R., Gao X., Wang H., Gu H., Ma L., Yao Z., Prevalence of atopic dermatitis in chinese children aged 1–7 ys. Sci. Rep. 6, 29751 (2016). [DOI] [PMC free article] [PubMed] [Google Scholar]
- 20.Breiman L., Random forests. Mach. Learn. 45, 5–32 (2001). [Google Scholar]
- 21.Tucker C. M., Shoemaker L. G., Davies K. F., Nemergut D. R., Melbourne B. A., Differentiating between niche and neutral assembly in metacommunities using null models of β-diversity. Oikos 125, 778–789 (2016). [Google Scholar]
- 22.Ferrenberg S., O’Neill S. P., Knelman J. E., Todd B., Duggan S., Bradley D., Robinson T., Schmidt S. K., Townsend A. R., Williams M. W., Cleveland C. C., Melbourne B. A., Jiang L., Nemergut D. R., Changes in assembly processes in soil bacterial communities following a wildfire disturbance. ISME J. 7, 1102–1111 (2013). [DOI] [PMC free article] [PubMed] [Google Scholar]
- 23.Püttker T., de Arruda Bueno A., Prado P. I., Pardini R., Ecological filtering or random extinction? Beta-diversity patterns and the importance of niche-based and neutral processes following habitat loss. Oikos 124, 206–215 (2015). [Google Scholar]
- 24.Faith D. P., Conservation evaluation and phylogenetic diversity. Biol. Conserv. 61, 1–10 (1992). [Google Scholar]
- 25.Faith D. P., Systematics and conservation: On predicting the feature diversity of subsets of taxa. Cladistics 8, 361–373 (1992). [DOI] [PubMed] [Google Scholar]
- 26.O’Dwyer J. P., Kembel S. W., Green J. L., Phylogenetic diversity theory sheds light on the structure of microbial communities. PLOS Comput. Biol. 8, e1002832 (2012). [DOI] [PMC free article] [PubMed] [Google Scholar]
- 27.Mouquet N., Devictor V., Meynard C. N., Munoz F., Bersier L.-F., Chave J., Couteron P., Dalecky A., Fontaine C., Gravel D., Hardy O. J., Jabot F., Lavergne S., Leibold M., Mouillot D., Münkemüller T., Pavoine S., Prinzing A., Rodrigues A. S. L., Rohr R. P., Thébault E., Thuiller W., Ecophylogenetics: Advances and perspectives. Biol. Rev. Camb. Philos. Soc. 87, 769–785 (2012). [DOI] [PubMed] [Google Scholar]
- 28.Sloan W. T., Lunn M., Woodcock S., Head I. M., Nee S., Curtis T. P., Quantifying the roles of immigration and chance in shaping prokaryote community structure. Environ. Microbiol. 8, 732–740 (2006). [DOI] [PubMed] [Google Scholar]
- 29.Ruan Q., Dutta D., Schwalbach M. S., Steele J. A., Fuhrman J. A., Sun F., Local similarity analysis reveals unique associations among marine bacterioplankton species and environmental factors. Bioinformatics 22, 2532–2538 (2006). [DOI] [PubMed] [Google Scholar]
- 30.Fuhrman J. A., Steele J. A., Community structure of marine bacterioplankton: Patterns, networks, and relationships to function. Aquat. Microb. Ecol. 53, 69–81 (2008). [Google Scholar]
- 31.Faust K., Sathirapongsasuti J. F., Izard J., Segata N., Gevers D., Raes J., Huttenhower C., Microbial co-occurrence relationships in the human microbiome. PLOS Comput. Biol. 8, e1002606 (2012). [DOI] [PMC free article] [PubMed] [Google Scholar]
- 32.Langille M. G. I., Zaneveld J., Caporaso J. G., McDonald D., Knights D., Reyes J. A., Clemente J. C., Burkepile D. E., Vega Thurber R. L., Knight R., Beiko R. G., Huttenhower C., Predictive functional profiling of microbial communities using 16S rRNA marker gene sequences. Nat. Biotechnol. 31, 814–821 (2013). [DOI] [PMC free article] [PubMed] [Google Scholar]
- 33.Morgan X. C., Tickle T. L., Sokol H., Gevers D., Devaney K. L., Ward D. V., Reyes J. A., Shah S. A., LeLeiko N., Snapper S. B., Bousvaros A., Korzenik J., Sands B. E., Xavier R. J., Huttenhower C., Dysfunction of the intestinal microbiome in inflammatory bowel disease and treatment. Genome Biol. 13, R79 (2012). [DOI] [PMC free article] [PubMed] [Google Scholar]
- 34.Findley K., Grice E. A., The skin microbiome: A focus on pathogens and their association with skin disease. PLOS Pathog. 10, e1004436 (2014). [DOI] [PMC free article] [PubMed] [Google Scholar]
- 35.Kong H. H., Oh J., Deming C., Conlan S., Grice E. A., Beatson M. A., Nomicos E., Polley E. C., Komarow H. D. NISC Comparative Sequence Program, Murray P. R., Turner M. L., Segre J. A., Temporal shifts in the skin microbiome associated with disease flares and treatment in children with atopic dermatitis. Genome Res. 22, 850–859 (2012). [DOI] [PMC free article] [PubMed] [Google Scholar]
- 36.Park T., Kim H.-J., Myeong N. R., Lee H. G., Kwack I., Lee J., Kim B. J., Sul W. J., An S., Collapse of human scalp microbiome network in dandruff and seborrheic dermatitis. Exp. Dermatol. 26, 835–838 (2017). [DOI] [PubMed] [Google Scholar]
- 37.Statnikov A., Alekseyenko A. V., Li Z., Henaff M., Perez-Perez G. I., Blaser M. J., Aliferis C. F., Microbiomic signatures of psoriasis: Feasibility and methodology comparison. Sci. Rep. 3, 2620 (2013). [DOI] [PMC free article] [PubMed] [Google Scholar]
- 38.Costello E. K., Stagaman K., Dethlefsen L., Bohannan B. J. M., Relman D. A., The application of ecological theory toward an understanding of the human microbiome. Science 336, 1255–1262 (2012). [DOI] [PMC free article] [PubMed] [Google Scholar]
- 39.World Health Organization, WHO Global urban ambient air pollution database (World Health Organization, 2016); www.who.int/phe/health_topics/outdoorair/databases/cities/en/. [Google Scholar]
- 40.Kim K. E., Cho D., Park H. J., Air pollution and skin diseases: Adverse effects of airborne particulate matter on various skin diseases. Life Sci. 152, 126–134 (2016). [DOI] [PubMed] [Google Scholar]
- 41.Puri P., Nandar S. K., Kathuria S., Ramesh V., Effects of air pollution on the skin: A review. Indian J. Dermatol. Venereol. Leprol. 83, 415–423 (2017). [DOI] [PubMed] [Google Scholar]
- 42.Krutmann J., Liu W., Li L., Pan X., Crawford M., Sore G., Seite S., Pollution and skin: From epidemiological and mechanistic studies to clinical implications. J. Dermatol. Sci. 76, 163–168 (2014). [DOI] [PubMed] [Google Scholar]
- 43.Berardesca E., Distante F., Vignoli G. P., Oresajo C., Green B., Alpha hydroxyacids modulate stratum corneum barrier function. Br. J. Dermatol. 137, 934–938 (1997). [PubMed] [Google Scholar]
- 44.Eren A. M., Vineis J. H., Morrison H. G., Sogin M. L., A filtering method to generate high quality short reads using illumina paired-end technology. PLOS ONE 8, e66643 (2013). [DOI] [PMC free article] [PubMed] [Google Scholar]
- 45.Caporaso J. G., Kuczynski J., Stombaugh J., Bittinger K., Bushman F. D., Costello E. K., Fierer N., Peña A. G., Goodrich J. K., Gordon J. I., Huttley G. A., Kelley S. T., Knights D., Koenig J. E., Ley R. E., Lozupone C. A., McDonald D., Muegge B. D., Pirrung M., Reeder J., Sevinsky J. R., Turnbaugh P. J., Walters W. A., Widmann J., Yatsunenko T., Zaneveld J., Knight R., QIIME allows analysis of high-throughput community sequencing data. Nat. Methods 7, 335–336 (2010). [DOI] [PMC free article] [PubMed] [Google Scholar]
- 46.Caporaso J. G., Bittinger K., Bushman F. D., DeSantis T. Z., Andersen G. L., Knight R., PyNAST: A flexible tool for aligning sequences to a template alignment. Bioinformatics 26, 266–267 (2010). [DOI] [PMC free article] [PubMed] [Google Scholar]
- 47.Price M. N., Dehal P. S., Arkin A. P., FastTree: Computing large minimum evolution trees with profiles instead of a distance matrix. Mol. Biol. Evol. 26, 1641–1650 (2009). [DOI] [PMC free article] [PubMed] [Google Scholar]
- 48.Bouslimani A., Porto C., Rath C. M., Wang M., Guo Y., Gonzalez A., Berg-Lyon D., Ackermann G., Moeller Christensen G. J., Nakatsuji T., Zhang L., Borkowski A. W., Meehan M. J., Dorrestein K., Gallo R. L., Bandeira N., Knight R., Alexandrov T., Dorrestein P. C., Molecular cartography of the human skin surface in 3D. Proc. Natl. Acad. Sci. U.S.A. 112, E2120–E2129 (2015). [DOI] [PMC free article] [PubMed] [Google Scholar]
- 49.Edgar R. C., Search and clustering orders of magnitude faster than BLAST. Bioinformatics 26, 2460–2461 (2010). [DOI] [PubMed] [Google Scholar]
- 50.Wang Q., Garrity G. M., Tiedje J. M., Cole J. R., Naïve Bayesian classifier for rapid assignment of rRNA sequences into the new bacterial taxonomy. Appl. Environ. Microbiol. 73, 5261–5267 (2007). [DOI] [PMC free article] [PubMed] [Google Scholar]
- 51.Segata N., Izard J., Waldron L., Gevers D., Miropolsky L., Garrett W. S., Huttenhower C., Metagenomic biomarker discovery and explanation. Genome Biol. 12, R60 (2011). [DOI] [PMC free article] [PubMed] [Google Scholar]
- 52.Liaw A., Wiener M., Classification and regression by randomForest. R News 2, 18–22 (2002). [Google Scholar]
- 53.Brown L. D., Cai T. T., DasGupta A., Interval estimation for a binomial proportion. Stat. Sci., 101–117 (2001). [Google Scholar]
- 54.Kurtz Z. D., Müller C. L., Miraldi E. R., Littman D. R., Blaser M. J., Bonneau R. A., Sparse and compositionally robust inference of microbial ecological networks. PLOS Comput. Biol. 11, e1004226 (2015). [DOI] [PMC free article] [PubMed] [Google Scholar]
- 55.Meinshausen N., Bühlmann P., High-dimensional graphs and variable selection with the lasso. Ann. Stat. 34, 1436–1462 (2006). [Google Scholar]
- 56.Liu H., Roeder K., Wasserman L., Stability Approach to Regularization Selection (StARS) for High Dimensional Graphical Models. Adv. Neural Inf. Process. Syst. 24, 1432–1440 (2010). [PMC free article] [PubMed] [Google Scholar]
Associated Data
This section collects any data citations, data availability statements, or supplementary materials included in this article.
Supplementary Materials
Supplementary material for this article is available at http://advances.sciencemag.org/cgi/content/full/4/3/e1701581/DC1
fig. S1. Information of the geographical location and characteristics of each city.
fig. S2. Relative mean abundances of four predominant phyla.
fig. S3. Mean relative abundance of bacterial genera in the skin microbiome among the five cities in China.
fig. S4. Principal coordinate analysis with weighted UniFrac distances.
fig. S5. Distance decay analysis.
fig. S6. The β-diversity comparisons of the skin microbiome of the five cities.
fig. S7. Distribution of PD.
fig. S8. Analysis of MSE by random forest modeling.
fig. S9. Comparison of predicted functional metagenomic profiling using PICRUSt between the megacity and non-megacity groups.
fig. S10. The richness (observed OTUs) of the genus Staphylococcus in five cities.
table S1. Sample metadata, number of sequences, and α diversity across samples based on rarefaction of 4860 reads per sample.
table S2. Relative average abundances of the 15 most abundant genera.
table S3. Environmental factors and city indices of five cities.
table S4. Environmental factors and city indices of five cities.
table S5. The observed species pool of five cities.
data file S1. The information of OTUs in Fig. 3A.