

Summary
Vascular endothelial growth factor (VEGF) is an important regulator of physiological and pathological angiogenesis. Besides malignant and stromal cells, local immune cells shape VEGF signalling in the tumour microenvironment. Aminobisphosphonates such as zoledronic acid (Zol) are drugs known to inhibit osteoclast activity and bone resorption, but also have immunomodulatory and anti‐tumour effects. These properties have been linked previously to the down‐regulation of VEGF and interference with tumour neo‐angiogenesis. It was therefore surprising to find that treatment with Zol in combination with low‐dose interleukin (IL)‐2 increased serum VEGF levels in cancer patients. In this study we aimed to characterize the effect of Zol and IL‐2 on VEGF signalling of blood‐derived immune cells in vitro. Upon stimulation with IL‐2, T cells and natural killer (NK) cells increase production of VEGF consecutively to the release of proinflammatory interferon (IFN)‐γ, and Zol accelerates this response specifically in γδ T cells. VEGF can, in turn, be antagonized by soluble VEGF receptor (sVEGFR)‐1, which is released depending on stimulatory conditions and the presence of monocytes. Additionally, malignant cells represented by leukaemia and lymphoma cell lines produce VEGF and some release sVEGFR‐1 simultaneously. Our findings indicate a mechanism by which the VEGF and the sVEGFR‐1 production by immune cells regulates local VEGF signalling. Therefore, immunotherapeutic interventions may enable both pro‐ as well as anti‐tumour effects via immune cell‐mediated alterations of VEGF homeostasis.
Keywords: γδ, interleukin‐2, monocyte, soluble VEGF receptor, VEGF
Introduction
Immune cells impact cancer growth via direct interaction with malignant cells and also indirectly by modulation of the tumour microenvironment 1. It has been established that the density and composition of tissue infiltrating cells, for example enrichment with T cells or macrophages, are correlated to clinical outcome in many types of cancer 2. Owing to the heterogeneity and complexity of immunological responses towards malignancies, the underlying local mechanisms are not understood completely.
Immune cells can be a double‐edged sword in the context of cancer, as they are able to promote as well as counteract tumour growth 1. In this regard it has been demonstrated that even though γδ T cell infiltration in the tumour tissue represents a positive prognostic marker in most types of cancer 2, specific subpopulations of γδ T cells have pro‐tumour functions, such as the stimulation of tumour angiogenesis 3, 4. This is relevant, as the utilization of tumour‐targeting γδ T cells is a promising concept in the field of cancer immunotherapy 5, 6, 7: γδ T cells exhibit strong cytotoxic activity against a variety of cancer cell types 8, 9 and can be activated safely in vivo using amino‐bisphosphonates or synthetic phosphoantigens and low‐dose interleukin (IL)‐2 9. Bisphosphonates, such as zoledronic acid (Zol), have additional effects in cancer patients 10 and results reported by Santini et al. indicated a connection to the down‐regulation of angiogenic growth factors such as vascular endothelial growth factor (VEGF) 11, 12, 13.
The VEGF family comprises several multi‐functional signal molecules, of which VEGF‐A is the best‐characterized member. VEGF‐A (referred to henceforth as VEGF) is involved in many physiological and pathophysiological processes 14: it is essential for embryonic development 15, stimulates angiogenesis, increases vascular permeability and enables tumour neovascularization 16. Current clinically approved anti‐VEGF therapies target pathological neo‐angiogenesis and are now used frequently in cancer 17. However, compared to the high expectations that emerged from experiments with mice, the current anti‐VEGF drugs show only modest activity against human malignancies 14, 17. The reason for this discrepancy is unclear, but several reports indicate that human VEGF signalling in the context of cancer and inflammation is complex 18, 19 and may be more heterogeneous than thought previously. For example, a retrospective analysis documented recently that in renal cell cancer only a subgroup of patients with certain inflammation patterns of tumour‐infiltrating myeloid and T cell benefited from additional treatment with bevacizumab 20.
A possible linkage between the activity of T cells and VEGF signalling in cancer prompted us to assess the changes in VEGF serum levels during a recent clinical study that involved the use of Zol as an immunostimulatory drug. This study was designed primarily to evaluate the safety and anti‐tumour efficacy of γδ T cells in adults with advanced solid and haematological malignancies 21. Surprisingly, we found a substantial and fast increase in VEGF serum levels following treatment with Zol plus low‐dose IL‐2 in several patients 21, although we would have expected the contrary.
There are only few publications addressing VEGF production in human lymphocytes 22, 23, 24, 25 or specifically in γδ T cells 26, 27. Due to the importance of VEGF signalling in human physiology and disease we therefore aimed to examine the VEGF production from primary immune cells as well as different leukaemia and lymphoma cell lines following treatment with Zol and IL‐2.
Material and methods
Cell isolation and culture
All procedures were conducted in accordance with the 1975 Declaration of Helsinki. Peripheral blood mononuclear cells (PBMCs) from healthy male and female volunteers, aged between 20 and 60 years and with normal peripheral blood counts, were isolated by density gradient centrifugation with Biocoll (Biochrom, Darmstadt, Germany); 2 × 10⁵ PBMCs were cultured in 96‐well microtitre plates using standard medium consisting of RPMI‐1640 supplemented with 10% fetal bovine serum, 2 mM L‐glutamine and 1% penicillin + streptomycin (all from Biochrom). RPMI was ‘low endotoxin’ grade and fetal bovine serum contained less than 3 EU/ml endotoxin. One hundred U/ml IL‐2 with or without 1 µM Zol (both Novartis, Nuremberg, Germany) were added on day 0 as indicated (+ IL‐2 or Zol + IL‐2). Cells were reseeded at 2 × 10⁵ PBMCs per well on days 7 and 9. Additional IL‐2 (100 U/ml) was added on days 7 and 9 to the previously Zol + IL‐2‐ and IL‐2‐stimulated cultures. The leukaemia and lymphoma cell lines KG‐1, THP‐1, K562, HL‐60, Daudi, U266 and Reh were obtained from the German collection of microorganisms and cell culture (DSMZ, Braunschweig, Germany) and cultured in standard medium. Cell counts and cell viability were established using a haemocytometer and the trypan blue exclusion method. Cell viability rate was > 92% in all experiments.
Quantification of soluble factors and interference
VEGF, soluble VEGF receptors 1 and 2 (sVEGFR‐1 and sVEGFR‐2) and interferon (IFN)‐γ concentrations in the cell culture supernatants were determined using a Tecan Sunrise plate reader and enzyme‐linked immunosorbent assay (ELISA) kits (R&D Systems, Minneapolis, MN, USA), according to the manufacturer's instructions. The release rates in the indicated interval were normalized to 106 cells per 24 h in order to enhance comparability and to compensate for differences in cell proliferation as well as culture duration. Therefore, the concentration of the soluble factors were measured in the supernatants at the end of the respective period and related to the mean cell count, established by cell counting. For evaluation of cell culture supernatants, interference with VEGF detection, the supernatants and the calibrator diluent were each spiked with 400 pg/ml recombinant human VEGF (rhVEGF) (R&D Systems) and incubated for 30 min at room temperature before determination of VEGF concentration by ELISA. The level of interference is expressed as a percentage, based on the values measured in the calibrator diluent (VEGF concentration sample/VEGF concentration in calibrator diluent × 100).
Immunomagnetic selection
γδ T cells were enriched from Zol + IL‐2‐stimulated PBMCs on day 7 by positive immunomagnetic selection using the γδ T cell selection kit (Miltenyi Biotec, Bergisch Gladbach, Germany). Monocytes were enriched or depleted from PBMCs on day 0 using the CD14 monocyte kit (Miltenyi Biotec). All selections or depletions were performed using the MidiMACS system (Miltenyi Biotec), according to the manufacturer's instructions. The enrichment resulted in a purity of > 99% for enriched γδ T cells, > 92% CD14+ cells in the monocyte‐enriched and < 0·1% CD14+ cells in the monocyte‐depleted cell fraction, as confirmed by flow cytometry.
Flow cytometry
A FC500 flow cytometer and CXP software (both Beckman Coulter, Brea, CA, USA) were used for multi‐colour immunofluorescence and for intracellular staining analysis. Intracellular staining was performed using the Inside Stain kit (Miltenyi Biotec) with fluorochrome‐conjugated monoclonal antibodies: phycoerythrin (PE)‐conjugated anti‐VEGF (R&D Systems), anti‐IFN‐γ (Miltenyi Biotec) and isotype control antibody immunoglobulin (Ig)G1 (Miltenyi Biotec). Specific staining was expressed as delta mean fluorescence intensity (MFI) calculated by ΔMFI = MFI(target) – MFI(control). For identification of PBMC subpopulations cells were stained with combinations of anti‐T cell receptor αβ‐fluorescein isothiocyanate (FITC) (Miltenyi Biotec), CD14‐FITC, anti‐T cell receptor γδ‐FITC, anti‐CD3‐extracellular domain (ECD) and anti‐CD56‐PE‐cyanin 5.1 (PC5) monoclonal antibodies (all Beckman Coulter). PBMCs and cell lines were stained for expression of vascular endothelial growth factor receptors (VEGFR)‐1, −2 and −3 using the PE‐conjugated monoclonal antibodies: anti‐VEGFR‐1, −2 and −3 and isotype control antibody IgG1 (all from R&D Systems). The expression of VEGF receptors on cell lines was classified according to the MFIs quotient [MFI(VEGFRx)/MFI(isotype control)]: ≤ 2: −, > 2–3: (+), ≥ 3–10: +, > 10: ++.
Fluorescence microscopy
Washed cells were spun down on slides and fixed with 4% paraformaldehyde (Santa Cruz Biotechnology, Heidelberg, Germany). Cytospin specimens were rinsed with Tris‐buffered saline (TBS) before being overlaid with blocking buffer (5% donkey serum diluted in TBS + 0·1% 1TritonX100) for 20 min at room temperature. Incubation with primary antibodies [mouse anti‐VEGF‐PE, clone 23410 (R&D Systems), human anti‐VEGF, bevacizumab (Roche, Basel, Switzerland)] or respective isotype antibodies (human IgG1, kappa purified myeloma protein (Sigma, Munich, Germany) and mouse IgG2A‐PE, clone 20102 (R&D Systems), all diluted 1 : 10, was performed in a humid chamber overnight at 4°C. Slides were rinsed with TBS and incubated with donkey anti‐mouse Alexa‐488 or donkey anti‐mouse‐Cy3 (both from Jackson ImmunoResearch, West Grove, PA, USA) coupled secondary antibodies (diluted 1 : 200 in blocking buffer) for 1 h at room temperature. Cell nuclei were counterstained using 4′,6′‐diamidino‐2‐phenylindole (DAPI) from Roche, diluted 1 : 100. Labelled cells were washed several times with TBS before mounting with fluoromount (Southern Biotech, Birmingham, AL, USA). The images were taken adopting a DMi8 confocal laser scanning microscope (Leica, Wetzlar, Germany).
Statistical analysis
Data were depicted as mean ± standard deviation (s.d.). Levels of significance are calculated by Kruskal–Wallis test and Dunn's test. Correlation is expressed with Spearman's rank correlation coefficient. P < 0.05 was considered statistically significant.
Results
VEGF release by PBMCs
First we evaluated the VEGF release kinetics of human PBMCs of healthy donors during unstimulated in‐vitro culture and compared it to treatment with IL‐2. In addition, Zol + IL‐2 was used for specific activation of γδ T cells (Fig. 1a). VEGF release was decreased between days 0 and 2 in the Zol + IL‐2‐stimulated cultures and the release of VEGF until day 7 was low in any of the different types of stimulation. Zol + IL‐2‐treated PBMCs then depicted a significant increase in VEGF release compared to the unstimulated and IL‐2‐stimulated cells between days 7 and 9. Following day 9, both IL‐2‐ and Zol + IL‐2‐stimulated cells produced more VEGF than unstimulated controls. Due to their sensitivity towards stimulation with Zol + IL‐2, γδ T cells might secrete higher amounts of VEGF compared to other PBMCs. To test this hypothesis, we enriched γδ T cells from Zol + IL‐2‐treated PBMCs after 7 days. Results indicate that VEGF release from γδ T cells is similar to unselected PBMCs treated with Zol + IL‐2. Secretion of VEGF was lower than the release of the classical proinflammatory cytokine IFN‐γ, which peaks around day 2 when PBMCs are stimulated with Zol + IL‐2 (Fig. 1b).
Figure 1.
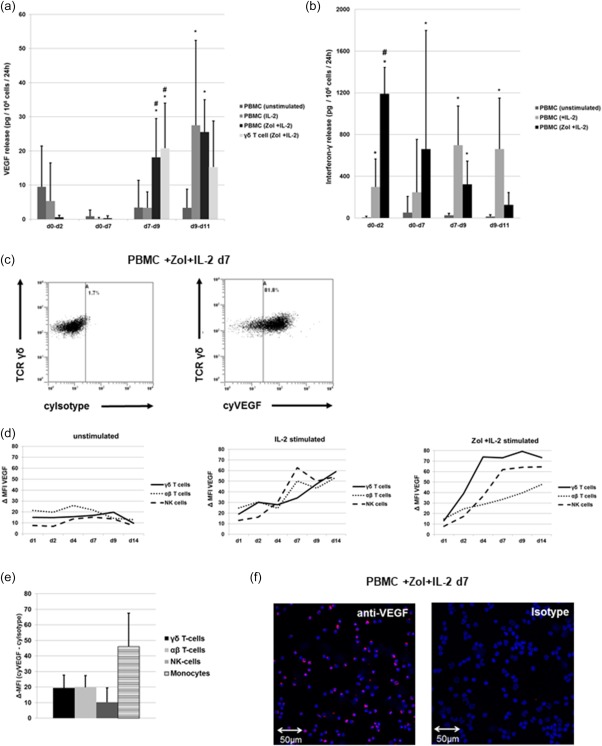
Vascular endothelial growth factor (VEGF) and interferon (IFN)‐γ production by peripheral blood mononuclear cells (PBMCs). (a) VEGF release/106 PBMCs or γδ T cells/24 h in the indicated intervals. Concentrations of VEGF were measured in the supernatants at the end of the respective interval using enzyme‐linked immunosorbent assay (ELISA) and were normalized with regard to cell count and culture time. Shown are the results from four different treatment regimens: (1) unstimulated, (2) interleukin (IL)‐2 (100 U/ml IL‐2 added on days 0, 7 and 9), (3) zoledronic acid (Zol) + IL‐2 (1 µM Zol added on day 0 and IL‐2 100 U/ml added on days 0, 7 and 9) and (4) Zol + IL‐2‐stimulated γδ T cells (immune‐magnetically selected on day 7 from previously Zol + IL‐2 stimulated PBMCs with addition of IL‐2 100 U/ml at days 7 and 9). (b) IFN‐γ release/106 PBMCs/24 h in the indicated interval. Concentrations of IFN‐γ were measured in the supernatants at the end of the respective period and normalized with regard to cell count and culture time. Shown are the results from three different treatment regimens: (1) unstimulated, (2) IL‐2 (100 U/ml IL‐2 added on days 0, 7 and 9, (3) Zol + IL‐2 (1 µM Zol added on day 0 and IL‐2 100 U/ml added on days 0, 7 and 9). (c) Flow cytometry analysis of either intracytoplasmic isotype or VEGF staining results from Zol + IL‐2‐stimulated PBMC measured on day 7 and gated on γδ T cells. T cell receptor (TCR)‐δ, cytoplasmic Isotype (cyIsotype), cytoplasmic VEGF (cyVEGF). (d) Kinetic of intracytoplasmic VEGF content for three different treatment regimens (from left to right: unstimulated, IL‐2 stimulated and Zol + IL‐2‐stimulated PBMCs), depicted as mean Δ‐mean fluorescence intensity (MFI) [MFI(VEGF) – MFI(isotype control] in the respective populations (γδ T cells, αβ T cells and natural killer (NK) cells) between days 1 and 14 (d1 – d14). (e) Flow cytometry analysis showing Δ‐MFI of intracytoplasmic VEGF content of freshly isolated PBMCs. Δ‐MFI = MFI(VEGF) – MFI(isotype control). (f) Immunofluorescence analysis of the VEGF content in Zol + IL‐2‐stimulated PBMC on day 7 with anti‐VEGF or isotype primary antibody and cyanin 3 (Cy3)‐coupled secondary antibody. All data are presented either as a representative example of at least three independent experiments or depicted as mean ± standard deviation (s.d.) of at least three independent experiments. *P < 0·05 compared to unstimulated control, # P < 0·05 compared to stimulation with IL‐2. [Colour figure can be viewed at wileyonlinelibrary.com]
Intracytoplasmic VEGF in PBMCs
To analyse the production of VEGF by lymphocytes in detail, intracytoplasmic VEGF content of PBMCs subpopulations were compared between days 1 and 14 using identical treatment regimens (Fig. 1c,d). We found that IL‐2 alone induces VEGF production after day 4 similarly in NK, αβ and γδ T cells. Additional stimulation with Zol leads to a more rapid and more pronounced VEGF production, predominantly in γδ T cells. Directly after isolation and before stimulation, monocytes depict the highest cytoplasmic VEGF signal of all PBMCs (Fig. 1e), but the amount of monocytes decreases very quickly during culture (data no shown).
However, VEGF release of PBMCs until day 7 was unexpectedly low when compared to their cytoplasmic VEGF content, depicted by flow cytometry and validated by fluorescence microscopy (Fig. 1f). Taken together, our results show that IL‐2 stimulates VEGF release from PBMCs consecutively to the classical proinflammatory cytokine IFN‐γ. Additional Zol accelerates this production of VEGF selectively in γδ T cells. However, the kinetic of VEGF release measured in the supernatant did not match the results of the intracytoplasmic VEGF measurement.
Expression of VEGF receptors by PBMCs
Due to the discrepancy between intracytoplasmic VEGF content and VEGF release, we screened for VEGFRs which may bind VEGF and thereby interfere with its detection in the supernatant. CD14+ monocytes depicted VEGFR‐1 and VEGFR‐3 but no VEGFR‐2 expression, whereas NK, αβ and γδ T cells had no detectable VEGFRs on their cell surface following isolation (Fig. 2a). This was unaltered by culture and stimulation with IL‐2 or Zol + IL‐2 until day 14 (data not shown). Correspondingly, rhVEGF added to the cultures did not alter the proliferation (Fig. 2b) or composition of lymphocyte populations (Fig. 2c), even at very high concentrations.
Figure 2.
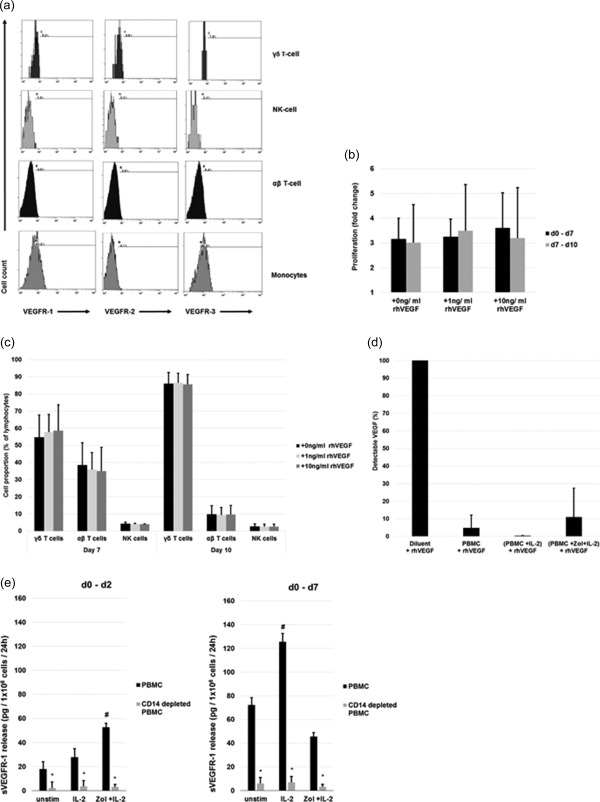
Expression, function and interference of vascular endothelial growth factor receptors (VEGFRs) on peripheral blood mononuclear cells (PBMCs). (a) Flow cytometry analysis of VEGFR‐1, −2 and −3 expression on freshly isolated, unstimulated PBMCs gated on different subpopulations. Positivity is defined according to the isotype antibody control staining. (b,c) Effect of recombinant human VEGF (rhVEGF) on proliferation of stimulated PBMCs. Different concentrations of rhVEGF were added to a culture of zoledronic acid (Zol) + interleukin (IL)‐2 stimulated PBMCs on days 0 or 7. (b) Proliferation of cells between days 0–7 (rhVEGF added on day 0) and days 7–10 (rhVEGF added on day 7) as fold change from initial cell count. (c) γδ T cell, αβ T cells and natural killer (NK) cells as a fraction of the gated lymphocytes after 7 days (rhVEGF added on day 0) and 10 days (rhVEGF added on day 7) of culture. (d) Soluble factors interfere with detection of VEGF. Detectable free VEGF by enzyme‐linked immunosorbent assay (ELISA) after spiking of 400 pg/ml rhVEGF into the supernatants of differently stimulated PBMCs compared to spiking the same amount into calibrator diluent. (e) Quantification of sVEGFR‐1 in cell culture supernatants of differently stimulated PBMCs, with or without prior depletion of CD14+ cells. Soluble VEGFR (sVEGFR)‐1 release/106 cells/24 h between days 0–2 and 0–7 was measured at the end of the respective interval in the supernatants by ELISA and normalized with regard to cell count and culture time. Shown are the results from three different treatment regimens: (1) unstimulated, (2) IL‐2 (IL‐2 100 U/ml added on day 0), (3) Zol + IL‐2 (1 µM Zol and IL‐2 100 U/ml added on day 0). All data are either presented as a representative example of at least three independent experiments (Fig. 2a) or depicted as mean ± standard deviation (s.d.) of at least three independent experiments. *P < 0·05 compared to undepleted PBMCs, # P < 0·05 compared to unstimulated control.
Release of soluble VEGFR‐1 by PBMCs
Even though the low expression of cell membrane‐anchored VEGFRs on monocytes may contribute to the mismatch between intracytoplasmic VEGF and free VEGF in the supernatant, we suspected the additional release of a soluble factor that interferes with the detection of VEGF. To test this concept we added 400 pg/ml rhVEGF on cell culture supernatants of PBMCs harvested on day 7 and found an interference of 95·1% for unstimulated, an interference of 100% for IL‐2‐stimulated and an interference of 89·0% for Zol + IL‐2‐stimulated conditions (Fig. 2d).
Monocytes are a potential source of sVEGFR‐1 which could be responsible for the observed interference. Therefore, we compared the release of sVEGFR‐1 from CD14‐depleted and non‐depleted PBMCs cultured under unstimulated, IL‐2‐ and Zol + IL‐2‐stimulated conditions (Fig. 2e). We found that monocytes are essential for the production of sVEGFR‐1 under any of the tested conditions, as CD14 depletion strongly reduces sVEGFR‐1 release. In summary, we found monocytes or monocyte‐derived cells to be capable of (1) producing VEGF directly (Fig. 1e), but also (2) inhibiting its effects by facilitating the production of antagonistic sVEGFR‐1 (Fig. 2e) under certain stimulatory conditions. These findings are complementary to earlier reports on the functions of monocytes using a different experimental set‐up and stimulations 28, 29. In line with this, we found a significantly increased release of VEGF by CD14‐depleted compared to undepleted PBMCs between days 0 and 7 (Fig. 3a). Additionally, conditioned medium harvested from IL‐2‐stimulated, monocyte‐depleted PBMCs on day 7 supported sVEGFR‐1 production dose‐dependently by isolated monocytes (Fig. 3b).
Figure 3.
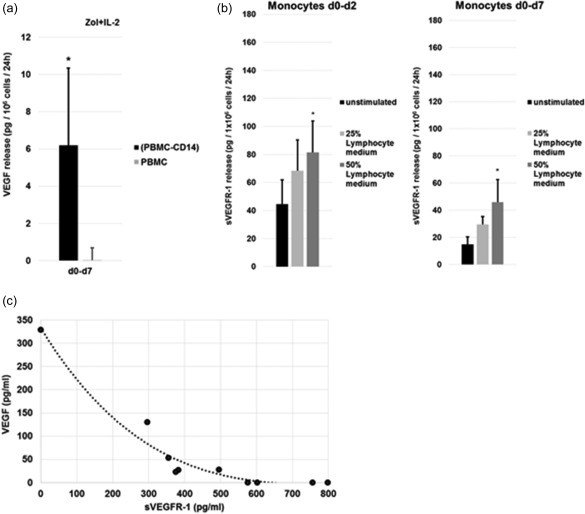
Monocytes and lymphocytes influence vascular endothelial growth factor (VEGF) signalling. (a) Both CD14‐depleted peripheral blood mononuclear cells (PBMCs) and undepleted PBMCs were stimulated with 1 µM zoledronic acid (Zol) and 100 U/ml interleukin (IL)‐2 on day 0 and the concentrations of VEGF were measured in the supernatants on day 7. Release rates were normalized to 1 × 10⁶cells/24 h. Data from three independent experiments are depicted as mean ± standard deviation (s.d.); *P < 0.05 compared to undepleted control. (b) Effect of lymphocyte conditioned medium on the release of Soluble VEGFR (sVEGFR)‐1 by enriched monocytes. Monocytes were enriched from blood PBMCs by immunomagnetic selection for CD14 on day 0 and cultured at 1 × 10⁶ cells/ml. Shown are the results from three different treatment regimens: (1) unstimulated monocytes, (2) monocytes stimulated with 25% lymphocyte conditioned medium (addition of 25% cell‐free medium which was harvested on day 7 of IL‐2‐stimulated, monocyte‐depleted PBMC culture and (3) monocytes stimulated with 50% lymphocyte‐conditioned medium (addition of 50% cell‐free medium which was harvested on day 7 of IL‐2‐stimulated, monocyte‐depleted PBMC culture). Concentrations of VEGF were measured in the supernatants at the end of the respective period, the concentration of soluble VEGFR (sVEGFR)‐1 in the added medium was subtracted from this value and results normalized with regard to cell count and culture time. Data from three independent experiments are depicted as mean ± standard deviation (s.d.). *P < 0·05 compared to unstimulated control. (c) Correlation between the sVEGFR‐1 concentration in supernatants of differently stimulated (unstimulated, IL‐2 and Zol + IL‐2) PBMCs after 7 days and the detectable free VEGF concentration by enzyme‐linked immunosorbent assay (ELISA) after spiking of 400 pg/ml recombinant human VEGF (rhVEGF) into these supernatants. The reference point at 0 pg/ml sVEGFR1 is assigned to the VEGF concentration measured in the calibrator diluent of the assay. Each point represents an individual experiment. Spearman's rank correlation coefficient is r = −0·89 and P < 0·05.
Finally, we found that sVEGFR‐1 in the supernatants of stimulated (IL‐2, Zol + IL‐2) and unstimulated PBMCs correlated positively with the ability to mask detection of spiked rhVEGF in these supernatants (Fig. 3c), supporting our interpretation that sVEGFR‐1 is indeed responsible for the observed interference with VEGF. sVEGFR‐2 could not be detected in the supernatants of stimulated or unstimulated PBMCs (data not shown). Together, our results show that sVEGFR‐1 release from PBMCs is monocyte‐dependent and stimulated by IL‐2. As well as sVEGFR‐1, membrane standing VEGFR‐1 on monocytes might impact VEGF homeostasis by binding VEGF.
VEGF release by leukaemia and lymphoma cell lines
As VEGF is a signal molecule for monocytes and cells of the haematopoietic system, we asked whether secretion of VEGF and/or release of an antagonistic sVEGFR‐1 is a more common characteristic, applicable to other haematopoietic cell types. Therefore, we evaluated the VEGF release of different leukaemia and lymphoma cell lines under the same culture conditions as PBMCs.
Six of seven tested cell lines released VEGF which was unaffected by treatment with IL‐2 or Zol + IL‐2 (Fig. 4a). However, measurement of intracytoplasmic VEGF depicted a strong discrepancy between intracytoplasmic VEGF content and VEGF release in one of the cell lines: the myeloid leukaemia cell line KG‐1 released no detectable VEGF, but high amounts of VEGF were found in its cytoplasm using flow cytometry (Fig. 4b) and fluorescence microscopy (Fig. 4c). Similar results were obtained with a different primary VEGF antibody and retention of free VEGF inside the cells is unlikely, as cell lysate comprised virtually no detectable free VEGF (data not shown).
Figure 4.
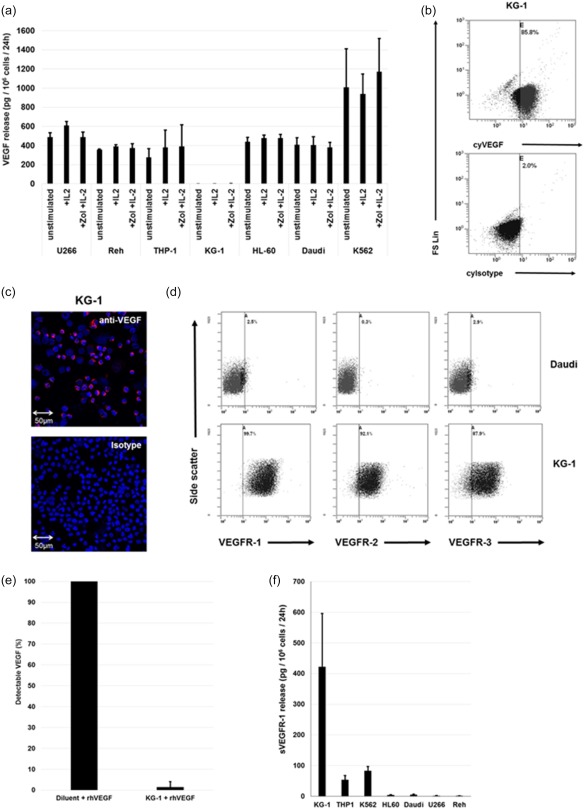
Vascular endothelial growth factor (VEGF) production and VEGF receptor (VEGFR) expression by leukaemia and lymphoma cell lines. (a) VEGF release/106 unstimulated leukaemia or lymphoma cells/24 h and effect of interleukin (IL)‐2 and zoledronic acid (Zol) + IL‐2 treatment. Shown are the results from three different treatment regimens: (1) unstimulated, (2). IL‐2 (100 U/ml IL‐2), (3) Zol + IL‐2 (1 µM Zol and IL‐2 100 U/ml). Concentrations of VEGF were measured in the supernatants using enzyme‐linked immunosorbent assay (ELISA) and normalized with regard to cell count and culture time. Differences in VEGF production comparing treatments were not statistically significant (b) Measurement of VEGF content in the KG‐1 cell line by flow cytometry. Cytoplasmic Isotype (cyIsotype), cytoplasmic VEGF (cyVEGF), forward‐scatter linear (FS Lin). (c) Immunofluorescence analysis of the VEGF content in KG‐1 cell line with anti‐VEGF or isotype primary antibody and cyanin 3 (Cy3)‐coupled secondary antibody. (d) Flow cytometry analysis of VEGFR‐1, −2 and −3 expression of two of seven cell lines: Daudi and KG‐1. (e) Soluble factors interfere with detection of VEGF. Detectable free VEGF by ELISA after spiking of 400 pg/ml recombinant human VEGF (rhVEGF) into supernatants of KG‐1 compared to spiking the same amount into calibrator diluent. (f) Soluble VEGF (sVEGFR)‐1 release/106 leukaemia or lymphoma cells/24 h. Concentrations of sVEGFR‐1 were measured in the supernatants by ELISA and normalized with regard to cell count. All data are either presented as a representative example of at least three independent experiments or depicted as mean ± standard deviation (s.d.) from at least three independent experiments. [Colour figure can be viewed at wileyonlinelibrary.com]
Expression of VEGF receptors by leukaemia and lymphoma cell lines
We next measured expression of VEGF‐receptors on leukaemia and lymphoma cell lines: as well as Daudi cells, all tested cell lines expressed at least VEGFR‐3 and some additionally expressed VEGFR‐1 or VEGFR‐2. KG‐1 expressed all three VEGFRs and had the highest VEGFR‐1 expression of all cell lines (Fig. 4d and Table 1). In summary, the examined cell lines are diverse regarding their expression of VEGF and VEGF receptors. KG‐1 is of special interest, as it produces VEGF, expresses high amounts of different VEGFRs and releases soluble VEGF binding molecules.
Table 1.
Vascular endothelial growth factor (VEGF) receptor expression on leukaemia and lymphoma cell lines
| Cell line | VEGF R1 | VEGF R2 | VEGF R3 |
|---|---|---|---|
| KG‐1 | ++ | + | + |
| K562 | + | − | + |
| HL‐60 | (+) | − | + |
| THP‐1 | − | − | + |
| U266 | − | − | (+) |
| Reh | − | − | (+) |
| Daudi | − | − | − |
The expression of VEGF receptors is classified according to the respective mean fluorescence intensities (MFIs) quotient [MFI(VEGFRx)/MFI(isotype control)]: ≤ 2: −, > 2–3: (+), ≥ 3–10: +, > 10: ++.
Interference of culture supernatants with the detection of VEGF
Similarly to the results obtained with PBMCs, we suspected the release of sVEGFR‐1 to interfere with the detection of VEGF. Therefore, we added 400 pg/ml rhVEGF to KG‐1 supernatants, which were harvested after 48 h of culture, and we found a 98·5% interference with the detection of the added VEGF (Fig. 4e).
Release of soluble VEGFR‐1 by leukaemia and lymphoma cell lines
Three of seven tested leukaemia and lymphoma cell lines released amounts of sVEGFR‐1 comparable to PBMCs or higher (Fig. 4f). The highest quantities were produced by KG‐1, which is in line with the observation that VEGF is detectable in the cytoplasm but masked completely in the cell culture supernatant. K562 also depicts a substantial production of sVEGFR‐1, together with high amounts of free VEGF in its culture supernatant (Fig. 4a) and a high intracytoplasmic VEGF content (data not shown). sVEGFR‐2 could not be detected in the supernatants of any of the leukaemia and lymphoma cell lines (data not shown).
Discussion
VEGF released by immune cells
It has been demonstrated previously that bisphosphonate monotherapy decreases VEGF levels in cancer patients 10, 11, 12 but, surprisingly, we found later that Zol combined with low‐dose IL‐2 can also induce a rapid increase in VEGF serum levels of such patients 21. Due to the temporal sequence, our hypothesis was that substantial amounts of VEGF are released by IL‐2‐ and Zol + IL‐2‐stimulated immune cells. To test this concept we assessed VEGF release kinetics by human PBMCs following different stimulations in vitro as a model for in‐vivo immunotherapeutic treatment. We found that IL‐2 and Zol + IL‐2 treatment stimulates VEGF release by immune cells consecutively, but not immediately, to the classical proinflammatory cytokine IFN‐γ. Zol + IL‐2 stimulation compared to IL‐2 alone accelerates but does not increase peak VEGF release rate. We next analysed the intracytoplasmic VEGF production kinetic for individual types of blood immune cells. Our results are in line with former reports showing that unstimulated monocytes produce VEGF 29, 30. Additionally, γδ, αβ T cells and NK cells have a low baseline VEGF content, but all up‐regulate VEGF production when stimulated with IL‐2, enabling these cells to play an opposing role upon activation. The combination of IL‐2 with Zol, known to elicit a proinflammatory response from γδ T cells, also accelerates selectively the production of VEGF in these γδ T cells. As VEGF expression follows the proinflammatory cytokine release it suggests a distinct, probably more downstream role in the course of immune reactions. However, the low VEGF release into the culture supernatant of immune cells until day 7 and the increase thereafter did not match the results of the intracytoplasmic VEGF measurement.
It is already known that monocytes and macrophages from patients with rheumatoid arthritis can release high amounts of VEGF 31 and Freeman et al. described VEGF release by lymphocytes as early as 1995 32. Since then, others have also addressed VEGF production by lymphocytes, although the use of mouse models and the measurement of relative cytokine alterations but without absolute numbers limit direct comparability 27, 33, 34. In addition, a commercial VEGF ELISA kit, which has been used in most studies, does not take into account the level of interfering factors such as sVEGFR‐1 35. Moreover, serum VEGF levels are linked to thrombocyte counts, probably because platelets release VEGF during blood coagulation 36. Without consideration of these factors, measurement of VEGF might not reflect the actual situation. We analysed our earlier clinical data and did not find a correlation between the changes in serum VEGF levels and changes in platelet count (data not shown). This would have been expected if an increased platelet count was indeed the cause for an increase in serum VEGF levels during immunotherapy.
VEGFRs on immune cells
VEGF can be released by various cell types, and its signals are mediated through the tyrosine kinase receptors, VEGFR‐1 (or Flt‐1) and VEGFR‐2 (or KDR), which are expressed by endothelial cells, monocytes and many malignant tumours 17. Furthermore, VEGF is a signal molecule for monocytes and haematopoietic progenitor cells 37. Analysis of VEGFRs on PBMCs showed that monocytes expressed detectable but low amounts of VEGFR‐1 and VEGFR‐3 and no VEGFR‐2. This is consistent with previous reports demonstrating a functional role for VEGF‐signalling via VEGFR‐1 in the attraction and activation of monocytes 15, 37, 38. In contrast to monocytes, αβ, γδ T and NK cells were negative for VEGFRs, and neither stimulation with IL‐2 nor Zol + IL‐2 induced expression of VEGFRs in any of these populations. The lack of detectable receptors makes it unlikely that VEGF acts directly on these cells or that they are capable of interfering with detection of VEGF via sequestration of VEGF by membrane‐bound receptors. Accordingly, we could not find any change in proliferation of stimulated PBMCs when rhVEGF was added to PBMCs cultures. However, we did not examine subpopulations, and there are indeed reports describing expression and functional implications for either VEGFR‐2, VEGFR‐1 or both receptors on certain T cell subpopulations, such as an impact on cell proliferation, cytotoxicity and IFN‐γ production 22, 23, 24, 25. The heterogeneous results may also be due to differences in the methodology or studied species 33, 39, 40. In line with previous publications, we suspect that while VEGFR‐2 is very important for endothelial cell functions, it is probably not for most immune cells 24, 25, 39, 41.
VEGF signalling in leukaemia and lymphoma cell lines
Testing of leukaemia and lymphoma cell lines regarding their VEGF release in vitro showed that VEGF production varies widely between different haematological cell types. VEGF release was observed in similar quantities in promyeloblast/pro‐myelocytic leukaemia (HL‐60), THP‐1 (monocytic cell/acute monocytic leukaemia), U266 (B‐lymphocyte/multiple myeloma), lymphoblast/non‐T, non‐B acute lymphocytic leukaemia (Reh) and B‐lymphoblast/Burkitt lymphoma (Daudi). Particularly high amounts of VEGF were released by K562 (erythroleukaemia/CML). Cells from KG‐1 (macrophage/acute myeloid leukaemia) did not release detectable VEGF. The VEGF release rate was not altered significantly in any of the cell lines by treatment with IL + 2 or Zol + IL‐2. This argues against the interpretation that Zol or IL‐2 had interfered directly with the VEGF release of leukaemia and lymphoma cells and caused the changes in VEGF serum levels observed in our earlier clinical study 21.
Similarly to PBMCs, it was interesting to find a marked discrepancy between VEGF release into the culture supernatant and the semiquantitative results of the intracytoplasmic VEGF measurement in the KG‐1 cell line. We therefore analysed expression of leukaemia cells VEGFRs under the assumption that the differences between intracytoplasmic VEGF levels and detectable VEGF in culture supernatants are caused by sequestration of free VEGF. The strong expression of VEGFRs found on KG‐1 underlies this hypothesis, at least for that cell line.
We did not investigate the functional relevance of VEGFRs on leukaemia or lymphoma cell lines ourselves, but there is evidence that VEGFRs located on or inside VEGF‐producing cells are part of an autocrine or intracrine VEGF‐feedback loop that impacts cell growth and survival in cancer cells 42, 43.
sVEGFR‐1
Binding by membrane resident VEGFRs was not the only reason for the discrepancies between the amount of intracytoplasmic VEGF and those detectable in the culture medium, as the cell‐free supernatants of KG‐1 and PBMCs cultures effectively interfered with the detection of added rhVEGF.
In this regard, it has been demonstrated previously that VEGFR‐1 has a physiological relevant splice variant, encoding sVEGFR‐1. This soluble receptor is expressed by endothelial cells 44 and also by cells of the monocyte lineage 45, and is capable of interfering with the detection and functioning of VEGF 46. We therefore assumed that this molecule contributes to the observed discrepancy in our experiments. In line with a possible interference we found high amounts of sVEGFR‐1 in the supernatants of the leukaemia cell lines KG‐1, K562 and THP‐1, as well as in the supernatants of PBMC cultures. By contrast, sVEGFR‐2 was not detectable in any of the cell culture supernatants and is most probably not a physiologically relevant antagonist of VEGF 35, 47. It was interesting to find that certain cell lines and PBMCs concomitantly produce contradictory VEGF signals, and VEGF production can either exceed or fall below the binding capacity of produced sVEGFR‐1. The release of sVEGFR‐1 from PBMCs was highly variable, depending on the applied stimulus. When PBMCs were depleted of CD14+ monocytes, the sVEGFR‐1 production rate decreased substantially and the detectable free VEGF between days 2 and 7 increased. Even though the VEGF output was still low when compared to cell lines (Fig. 4a) or macrophage colony‐stimulatory factor (M‐CSF) stimulated monocytes 29, this indicates that monocytes are essential for the release of sVEGFR‐1 and may have an important role as regulators of VEGF signalling in collaboration with lymphocytes.
Pro‐ and anti‐tumour roles of VEGF
VEGF has multiple biological effects, but in the context of malignancies it is recognized primarily as a pro‐tumour factor that facilitates neo‐angiogenesis and thereby cancer progression. Less focused upon are the immunomodulatory effects of VEGF; for example, the promotion of leucocyte trafficking into tissues 22, 48. In addition, predominantly immunosuppressive functions have been attributed to VEGF, such as the inhibition of dendritic cell maturation 49, induction of an immunosuppressive microenvironment and activation of regulatory T cells 40, 50. In the context of cancer immunotherapy it is interesting that high pretherapeutic blood levels of VEGF are an independent predictor of a lack in clinical response and a decreased overall survival of patients treated with high‐doses of IL‐2 51. However, this observation cannot be generalized or transferred to all types of cancer or other treatment modalities.
Pro‐ and anti‐tumour roles of tumour‐associated immune cells
In contrast to the observations that suggest that γδ T cell infiltration into the tumour is a positive prognostic marker 2, studies have shown that the amount of macrophages in tumour tissues is often correlated with a poor prognosis in numerous types of cancer and treatment modalities 52. This is especially recognized for the immunosuppressive M2‐like macrophages, which are capable of producing VEGF 53. In this regard, it has been proposed that Zol decreases VEGF levels in tumour patients by reducing the amount of tumour‐infiltrating macrophages 54. However, under certain circumstances macrophage infiltration is also associated with an improved prognosis 55, 56, suggesting a variable role of immune cells in the course of malignant diseases. There is evidence that proinflammatory signals such as IFN‐γ‐ or Fc‐receptor‐γ‐I‐dependent activation of monocytes and macrophages promote anti‐angiogenic functions of immune cells by inhibiting VEGF 57, 58. It has been demonstrated earlier that sVEGFR‐1 is a potent anti‐angiogenic molecule which blocks cellular proliferation and migration induced by VEGF 46. Monocyte‐derived dendritic cells stimulated with tumour necrosis factor (TNF)‐α or soluble CD40 ligand plus IFN‐γ can produce very high amounts of sVEGFR‐1 and can have an anti‐angiogenic effect in vivo 59. However, not only proinflammatory but also anti‐inflammatory cytokines such as IL‐4 or IL‐10 can inhibit VEGF signalling 60. It seems plausible that some of these apparently contradictory findings are the result of the time‐dependent regulation of immune responses and the diversity of macrophage phenotypes 61.
Depending on the type of stimulation with either M‐CSF or granulocyte–macrophage colony‐stimulating factor (GM‐CSF), monocytes themselves produce high amounts of VEGF (response to M‐CSF) or antagonistic sVEGFR‐1 (response to GM‐CSF) 28, 29. This observation adds to the plasticity of monocytes functioning as pro‐ or anti‐tumour factors and further connects them to T cell functions and the effects of IL‐2 treatment. In this regard, it has also been demonstrated in a melanoma mouse model that IL‐2 can have both pro‐ and anti‐tumour effects and changes the infiltration of tumour tissue and lymph nodes by T and NK cells, depending on the applied dose 62. We know that upon stimulation with IL‐2, both unstimulated and pre‐activated T cells as well as NK cells are able to produce GM‐CSF 63, 64. Furthermore, an interesting gene expression study in melanoma patients demonstrated that high doses of IL‐2 change the expression patterns of lymphocyte and monocyte cytokines, including GM‐CSF and VEGF, within a few hours in vitro, in the blood and in the tumour microenvironment 65. However, the physiological role for GM‐CSF in vivo remains unclear, because very high concentrations were needed to induce the release of anti‐angiogenic sVEGFR‐1 in vitro 28. A model for lymphocyte–monocyte interaction in control of VEGF signalling and tumour angiogenesis is given in Fig. 5.
Figure 5.
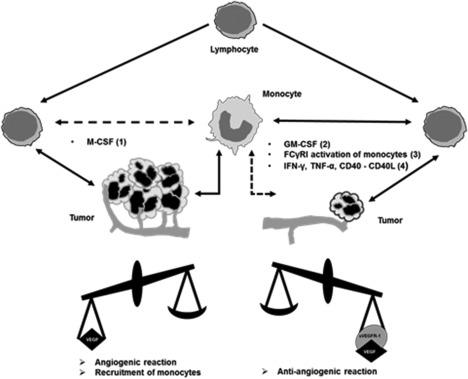
Model of lymphocytes and monocytes effects on vascular endothelial growth factor (VEGF) signalling. The figure is developed from the models by Eubank et al. 28 and incorporates results from (1, 2) Eubank et al. 28, 29 (3) Justiniano et al. 58, (4) Kishuku et al. 59 and our own observations. M‐CSF = macrophage colony‐stimulating factor; GM‐CSF = granulocyte–macrophage colony‐stimulating factor; FcγRI = Fcγ‐receptor I; TNF‐α = tumour necrosis factor α; IFN‐γ = interferon‐γ.
Our results suggest that lymphocytes are a potential source of VEGF, which may act as a chemoattractant for monocytes initially and helps to establish lymphocyte–monocyte co‐operation in vivo. We suggest that the local interaction of immune cells will result in pro‐ or anti‐tumour reactions depending on the milieu, cell composition and priming. γδ T cells might have predominant anti‐tumour functions when activated in the tumour environment, but in the following course of immune reactions they could also develop pro‐tumour characteristics.
Conclusions
In this study we characterize VEGF production by blood‐derived human immune cells, as well as leukaemia and lymphoma cell lines, and identify sVEGFR‐1 as a potent regulatory factor in VEGF signalling. We provide evidence that IL‐2 induces VEGF production and also the release of sVEGFR‐1 by immune cells, which may sequester free VEGF and inhibit angiogenesis. Depending on the process of lymphocyte–monocyte interaction, VEGF signalling is influenced predominantly in either way. It is plausible that these immune cells regulate VEGF homeostasis locally in a time‐dependent manner, influenced by the type and strength of primary stimuli and co‐stimulation (Fig. 5).
When changes in VEGF signalling in vivo are assessed by measuring blood levels it should be considered that this may not reflect local VEGF signalling, which is compartmentalized. Various cells produce VEGF and blood levels are influenced by breakdown, the abundance of VEGF binding proteins and by local differences in tissue permeability 66, 67. Our current study shows that manipulation of immune cell functions with IL‐2 and Zol can change VEGF signalling and therefore impact tumour angiogenesis, the local vascular permeability and may induce secondary immunomodulatory effects via VEGF and antagonistic sVEGFR‐1. In our opinion, the modest and variable clinical response to anti‐VEGF therapies in cancer demands additional effort in the detailed analysis of VEGF signalling in the tumour microenvironment and the contribution of different immune cells. Future research should apply more elaborate models for the time‐dependent study of cell interactions and cytokine patterns which regulate VEGF signalling. This may lead to more effective immunotherapeutic approaches with less negative effects.
Disclosure
The authors declare no competing financial interests.
Author contributions
T. H. designed the experiments, performed research, analysed and interpreted the data and wrote the paper; M. W. contributed to conception and design, analysed and interpreted the data and edited the paper; M. S. contributed to conception and design, analysed and interpreted the data; E. H. analysed the data and performed research; G. S. analysed the data, performed research and edited the paper; and J. B. contributed to conception and design, supervised research and edited the paper.
Acknowledgements
This study was supported by Verein Hilfe für Krebskranke e.V. and a scholarship for Timm Hoeres from W. Lutz Stiftung.
References
- 1. Grivennikov SI, Greten FR, Karin M. Immunity, inflammation, and cancer. Cell 2010; 140:883–99. [DOI] [PMC free article] [PubMed] [Google Scholar]
- 2. Gentles AJ, Newman AM, Liu CL et al The prognostic landscape of genes and infiltrating immune cells across human cancers. Nat Med 2015; 21:938–45. [DOI] [PMC free article] [PubMed] [Google Scholar]
- 3. Wakita D, Sumida K, Iwakura Y et al Tumor‐infiltrating IL‐17‐producing gammadelta T cells support the progression of tumor by promoting angiogenesis. Eur J Immunol 2010; 40:1927–37. [DOI] [PubMed] [Google Scholar]
- 4. Rei M, Pennington DJ, Silva‐Santos B. The emerging protumor role of gammadelta T lymphocytes: implications for cancer immunotherapy. Cancer Res 2015; 75:798–802. [DOI] [PubMed] [Google Scholar]
- 5. Kunzmann V, Bauer E, Feurle J, Weissinger F, Tony HP, Wilhelm M. Stimulation of gammadelta T cells by aminobisphosphonates and induction of antiplasma cell activity in multiple myeloma. Blood 2000; 96:384–92. [PubMed] [Google Scholar]
- 6. Viey E, Fromont G, Escudier B et al Phosphostim‐activated gamma delta T cells kill autologous metastatic renal cell carcinoma. J Immunol 2005; 174:1338–47. [DOI] [PubMed] [Google Scholar]
- 7. Kabelitz D, Wesch D, Pitters E, Zoller M. Characterization of tumor reactivity of human V gamma 9V delta 2 gamma delta T cells in vitro and in SCID mice in vivo . J Immunol 2004; 173:6767–76. [DOI] [PubMed] [Google Scholar]
- 8. Wilhelm M, Kunzmann V, Eckstein S et al Gammadelta T cells for immune therapy of patients with lymphoid malignancies. Blood 2003; 102:200–6. [DOI] [PubMed] [Google Scholar]
- 9. Fisher JP, Heuijerjans J, Yan M, Gustafsson K, Anderson J. Gammadelta T cells for cancer immunotherapy: a systematic review of clinical trials. Oncoimmunology 2014; 3:e27572. [DOI] [PMC free article] [PubMed] [Google Scholar]
- 10. Van Acker HH, Anguille S, Willemen Y, Smits EL, Van Tendeloo VF. Bisphosphonates for cancer treatment: mechanisms of action and lessons from clinical trials. Pharmacol Ther 2016; 158:24–40. [DOI] [PubMed] [Google Scholar]
- 11. Santini D, Vincenzi B, Avvisati G et al Pamidronate induces modifications of circulating angiogenetic factors in cancer patients. Clin Cancer Res 2002; 8:1080–4. [PubMed] [Google Scholar]
- 12. Santini D, Vincenzi B, Dicuonzo G et al Zoledronic acid induces significant and long‐lasting modifications of circulating angiogenic factors in cancer patients. Clin Cancer Res 2003; 9:2893–7. [PubMed] [Google Scholar]
- 13. Santini D, Vincenzi B, Galluzzo S et al Repeated intermittent low‐dose therapy with zoledronic acid induces an early, sustained, and long‐lasting decrease of peripheral vascular endothelial growth factor levels in cancer patients. Clin Cancer Res 2007; 13:4482–6. [DOI] [PubMed] [Google Scholar]
- 14. Goel HL, Mercurio AM. VEGF targets the tumour cell. Nat Rev Cancer 2013; 13:871–82. [DOI] [PMC free article] [PubMed] [Google Scholar]
- 15. Neufeld G, Cohen T, Gengrinovitch S, Poltorak Z. Vascular endothelial growth factor (VEGF) and its receptors. FASEB J 1999; 13:9–22. [PubMed] [Google Scholar]
- 16. Lee S, Chen TT, Barber CL et al Autocrine VEGF signalling is required for vascular homeostasis. Cell 2007; 130:691–703. [DOI] [PMC free article] [PubMed] [Google Scholar]
- 17. Ferrara N, Adamis AP. Ten years of anti‐vascular endothelial growth factor therapy. Nat Rev Drug Discov 2016; 15:385–403. [DOI] [PubMed] [Google Scholar]
- 18. Li YL, Zhao H, Ren XB. Relationship of VEGF/VEGFR with immune and cancer cells: staggering or forward? Cancer Biol Med 2016; 13:206–14. [DOI] [PMC free article] [PubMed] [Google Scholar]
- 19. Finley SD, Chu LH, Popel AS. Computational systems biology approaches to anti‐angiogenic cancer therapeutics. Drug Discov Today 2015; 20:187–97. [DOI] [PMC free article] [PubMed] [Google Scholar]
- 20. Atkins MB, McDermott DF, Powles T et al IMmotion150: a phase II trial in untreated metastatic renal cell carcinoma (mRCC) patients (pts) of atezolizumab (atezo) and bevacizumab (bev) vs and following atezo or sunitinib (sun). J Clin Oncol 2017; 35:4505. [Google Scholar]
- 21. Kunzmann V, Smetak M, Kimmel B et al Tumor‐promoting versus tumor‐antagonizing roles of gammadelta T cells in cancer immunotherapy: results from a prospective phase I/II trial. J Immunother 2012; 35:205–13. [DOI] [PubMed] [Google Scholar]
- 22. Edelbauer M, Datta D, Vos IH et al Effect of vascular endothelial growth factor and its receptor KDR on the transendothelial migration and local trafficking of human T cells in vitro and in vivo . Blood 2010; 116:1980–9. [DOI] [PMC free article] [PubMed] [Google Scholar]
- 23. Gavalas NG, Tsiatas M, Tsitsilonis O et al VEGF directly suppresses activation of T cells from ascites secondary to ovarian cancer via VEGF receptor type 2. Br J Cancer 2012; 107:1869–75. [DOI] [PMC free article] [PubMed] [Google Scholar]
- 24. Zhang J, Silva T, Yarovinsky T et al VEGF blockade inhibits lymphocyte recruitment and ameliorates immune‐mediated vascular remodeling. Circ Res 2010; 107:408–17. [DOI] [PMC free article] [PubMed] [Google Scholar]
- 25. Basu A, Hoerning A, Datta D et al Cutting edge: vascular endothelial growth factor‐mediated signalling in human CD45RO+ CD4+ T cells promotes Akt and ERK activation and costimulates IFN‐gamma production. J Immunol 2010; 184:545–9. [DOI] [PMC free article] [PubMed] [Google Scholar]
- 26. Laggner U, Di Meglio P, Perera GK et al Identification of a novel proinflammatory human skin‐homing Vgamma9Vdelta2 T cell subset with a potential role in psoriasis. J Immunol 2011; 187:2783–93. [DOI] [PMC free article] [PubMed] [Google Scholar]
- 27. Schilbach K, Frommer K, Meier S, Handgretinger R, Eyrich M. Immune response of human propagated gammadelta‐T cells to neuroblastoma recommend the Vdelta1+ subset for gammadelta‐T cell‐based immunotherapy. J Immunother 2008; 31:896–905. [DOI] [PubMed] [Google Scholar]
- 28. Eubank TD, Roberts R, Galloway M, Wang Y, Cohn DE, Marsh CB. GM‐CSF induces expression of soluble VEGF receptor‐1 from human monocytes and inhibits angiogenesis in mice. Immunity 2004; 21:831–42. [DOI] [PMC free article] [PubMed] [Google Scholar]
- 29. Eubank TD, Galloway M, Montague CM, Waldman WJ, Marsh CB. M‐CSF induces vascular endothelial growth factor production and angiogenic activity from human monocytes. J Immunol 2003; 171:2637–43. [DOI] [PMC free article] [PubMed] [Google Scholar]
- 30. Bottomley MJ, Webb NJ, Watson CJ, Holt PJ, Freemont AJ, Brenchley PE. Peripheral blood mononuclear cells from patients with rheumatoid arthritis spontaneously secrete vascular endothelial growth factor (VEGF): specific up‐regulation by tumour necrosis factor‐alpha (TNF‐alpha) in synovial fluid. Clin Exp Immunol 1999; 117:171–6. [DOI] [PMC free article] [PubMed] [Google Scholar]
- 31. Fava RA, Olsen NJ, Spencer GG et al Vascular permeability factor/endothelial growth factor (VPF/VEGF): accumulation and expression in human synovial fluids and rheumatoid synovial tissue. J Exp Med 1994; 180:341–6. [DOI] [PMC free article] [PubMed] [Google Scholar]
- 32. Freeman MR, Schneck FX, Gagnon ML et al Peripheral blood T lymphocytes and lymphocytes infiltrating human cancers express vascular endothelial growth factor: a potential role for T cells in angiogenesis. Cancer Res 1995; 55:4140–5. [PubMed] [Google Scholar]
- 33. Mor F, Quintana FJ, Cohen IR. Angiogenesis–inflammation cross‐talk: vascular endothelial growth factor is secreted by activated T cells and induces Th1 polarization. J Immunol 2004; 172:4618–23. [DOI] [PubMed] [Google Scholar]
- 34. Matsuyama W, Kubota R, Hashiguchi T et al Purified protein derivative of tuberculin upregulates the expression of vascular endothelial growth factor in T lymphocytes in vitro . Immunology 2002; 106:96–101. [DOI] [PMC free article] [PubMed] [Google Scholar]
- 35. R&D Systems Inc . Quantikine ELISA human VEGF handbook. 2015.
- 36. Gunsilius E, Petzer A, Stockhammer G et al Thrombocytes are the major source for soluble vascular endothelial growth factor in peripheral blood. Oncology 2000; 58:169–74. [DOI] [PubMed] [Google Scholar]
- 37. Barleon B, Sozzani S, Zhou D, Weich HA, Mantovani A, Marmé D. Migration of human monocytes in response to vascular endothelial growth factor (VEGF) is mediated via the VEGF receptor flt‐1. Blood 1996; 87:3336–43. [PubMed] [Google Scholar]
- 38. Clauss M, Weich H, Breier G et al The vascular endothelial growth factor receptor Flt‐1 mediates biological activities. Implications for a functional role of placenta growth factor in monocyte activation and chemotaxis. J Biol Chem 1996; 271:17629–34. [DOI] [PubMed] [Google Scholar]
- 39. Shin JY, Yoon IH, Kim JS, Kim B, Park CG. Vascular endothelial growth factor‐induced chemotaxis and IL‐10 from T cells. Cell Immunol 2009; 256:72–8. [DOI] [PubMed] [Google Scholar]
- 40. Voron T, Colussi O, Marcheteau E et al VEGF‐A modulates expression of inhibitory checkpoints on CD8+ T cells in tumors. J Exp Med 2015; 212:139–48. [DOI] [PMC free article] [PubMed] [Google Scholar]
- 41. Olsson AK, Dimberg A, Kreuger J, Claesson‐Welsh L. VEGF receptor signaling – in control of vascular function. Nat Rev Mol Cell Biol 2006; 7:359–71. [DOI] [PubMed] [Google Scholar]
- 42. Santos SC, Dias S. Internal and external autocrine VEGF/KDR loops regulate survival of subsets of acute leukemia through distinct signalling pathways. Blood 2004; 103:3883–9. [DOI] [PubMed] [Google Scholar]
- 43. Kerbel RS. Tumor angiogenesis. N Engl J Med 2008; 358:2039–49. [DOI] [PMC free article] [PubMed] [Google Scholar]
- 44. Kendall RL, Wang G, Thomas KA. Identification of a natural soluble form of the vascular endothelial growth factor receptor, FLT‐1, and its heterodimerization with KDR. Biochem Biophys Res Commun 1996; 226:324–8. [DOI] [PubMed] [Google Scholar]
- 45. Barleon B, Reusch P, Totzke F et al Soluble VEGFR‐1 secreted by endothelial cells and monocytes is present in human serum and plasma from healthy donors. Angiogenesis 2001; 4:143–54. [DOI] [PubMed] [Google Scholar]
- 46. Roeckl W, Hecht D, Sztajer H, Waltenberger J, Yayon A, Weich HA. Differential binding characteristics and cellular inhibition by soluble VEGF receptors 1 and 2. Exp Cell Res 1998; 241:161–70. [DOI] [PubMed] [Google Scholar]
- 47. Pavlakovic H, Becker J, Albuquerque R, Wilting J, Ambati J. Soluble VEGFR‐2: an anti‐lymphangiogenic variant of VEGF receptors. Ann NY Acad Sci 2010; 1207:E7–15. [DOI] [PMC free article] [PubMed] [Google Scholar]
- 48. Reinders ME, Sho M, Izawa A et al Proinflammatory functions of vascular endothelial growth factor in alloimmunity. J Clin Invest 2003; 112:1655–65. [DOI] [PMC free article] [PubMed] [Google Scholar]
- 49. Gabrilovich DI, Chen HL, Girgis KR et al Production of vascular endothelial growth factor by human tumors inhibits the functional maturation of dendritic cells. Nat Med 1996; 2:1096–103. [DOI] [PubMed] [Google Scholar]
- 50. Terme M, Tartour E, Taieb J. VEGFA/VEGFR2‐targeted therapies prevent the VEGFA‐induced proliferation of regulatory T cells in cancer. Oncoimmunology 2013; 2:e25156. [DOI] [PMC free article] [PubMed] [Google Scholar]
- 51. Sabatino M, Kim‐Schulze S, Panelli MC et al Serum vascular endothelial growth factor and fibronectin predict clinical response to high‐dose interleukin‐2 therapy. J Clin Oncol 2009; 27:2645–52. [DOI] [PMC free article] [PubMed] [Google Scholar]
- 52. Bingle L, Brown NJ, Lewis CE. The role of tumour‐associated macrophages in tumour progression: implications for new anticancer therapies. J Pathol 2002; 196:254–65. [DOI] [PubMed] [Google Scholar]
- 53. Murray PJ, Wynn TA. Protective and pathogenic functions of macrophage subsets. Nat Rev Immunol 2011; 11:723–37. [DOI] [PMC free article] [PubMed] [Google Scholar]
- 54. Insalaco L, Di Gaudio F, Terrasi M et al Analysis of molecular mechanisms and anti‐tumoural effects of zoledronic acid in breast cancer cells. J Cell Mol Med 2012; 16:2186–95. [DOI] [PMC free article] [PubMed] [Google Scholar]
- 55. Steidl C, Lee T, Shah SP et al Tumor‐associated macrophages and survival in classic Hodgkin's lymphoma. N Engl J Med 2010; 362:875–85. [DOI] [PMC free article] [PubMed] [Google Scholar]
- 56. Kridel R, Steidl C, Gascoyne RD. Tumor‐associated macrophages in diffuse large B‐cell lymphoma. Haematologica 2015; 100:143–5. [DOI] [PMC free article] [PubMed] [Google Scholar]
- 57. Wu WK, Llewellyn OP, Bates DO, Nicholson LB, Dick AD. IL‐10 regulation of macrophage VEGF production is dependent on macrophage polarisation and hypoxia. Immunobiology 2010; 215:796–803. [DOI] [PubMed] [Google Scholar]
- 58. Justiniano SE, Elavazhagan S, Fatehchand K et al Fcgamma receptor‐induced soluble vascular endothelial growth factor receptor‐1 (VEGFR‐1) production inhibits angiogenesis and enhances efficacy of anti‐tumor antibodies. J Biol Chem 2013; 288:26800–9. [DOI] [PMC free article] [PubMed] [Google Scholar]
- 59. Kishuku M, Nishioka Y, Abe S et al Expression of soluble vascular endothelial growth factor receptor‐1 in human monocyte‐derived mature dendritic cells contributes to their antiangiogenic property. J Immunol 2009; 183:8176–85. [DOI] [PubMed] [Google Scholar]
- 60. Wu WK, Georgiadis A, Copland DA et al IL‐4 regulates specific Arg‐1(+) macrophage sFlt‐1‐mediated inhibition of angiogenesis. Am J Pathol 2015; 185:2324–35. [DOI] [PubMed] [Google Scholar]
- 61. Melton DW, McManus LM, Gelfond JA, Shireman PK. Temporal phenotypic features distinguish polarized macrophages in vitro . Autoimmunity 2015; 48:161–76. [DOI] [PMC free article] [PubMed] [Google Scholar]
- 62. Zloza A, Dharmadhikari ND, Huelsmann EJ, Broucek JR, Hughes T, Kohlhapp FJ, Kaufman HL. Low‐dose interleukin‐2 impairs host anti‐tumor immunity and inhibits therapeutic responses in a mouse model of melanoma. Cancer Immunol Immunother 2016; 66:9–16. [DOI] [PMC free article] [PubMed] [Google Scholar]
- 63. Burdach S, Zessack N, Dilloo D, Shatsky M, Thompson D, Levitt L. Differential regulation of lymphokine production by distinct subunits of the T cell interleukin 2 receptor. J Clin Invest 1991; 87:2114–21. [DOI] [PMC free article] [PubMed] [Google Scholar]
- 64. Levitt LJ, Nagler A, Lee F, Abrams J, Shatsky M, Thompson D. Production of granulocyte/macrophage‐colony‐stimulating factor by human natural killer cells. Modulation by the p75 subunit of the interleukin 2 receptor and by the CD2 receptor. J Clin Invest 1991; 88:67–75. [DOI] [PMC free article] [PubMed] [Google Scholar]
- 65. Panelli MC, Wang E, Phan G et al Gene‐expression profiling of the response of peripheral blood mononuclear cells and melanoma metastases to systemic IL‐2 administration. Genome Biol 2002; 3:RESEARCH0035. [DOI] [PMC free article] [PubMed] [Google Scholar]
- 66. Wu FTH, Stefanini MO, Mac Gabhann F, Popel AS, Lucia A. A compartment model of VEGF distribution in humans in the presence of soluble VEGF receptor‐1 acting as a ligand trap. PLOS ONE 2009; 4:e5108. [DOI] [PMC free article] [PubMed] [Google Scholar]
- 67. Stefanini MO, Wu FT, Mac Gabhann F, Popel AS. A compartment model of VEGF distribution in blood, healthy and diseased tissues. BMC Syst Biol 2008; 2:77. [DOI] [PMC free article] [PubMed] [Google Scholar]