

Summary
The TAM receptor tyrosine kinases (TAM RTK) are a subfamily of receptor tyrosine kinases, the role of which in autoimmune diseases such as systemic lupus erythematosus has been well explored, while their functions in rheumatoid arthritis (RA) remain largely unknown. In this study, we investigated the role of soluble TAM receptor tyrosine kinases (sAxl/sMer/sTyro3) in patients with RA. A total of 306 RA patients, 100 osteoarthritis (OA) patients and 120 healthy controls (HCs) were enrolled into this study. The serum concentrations of sAxl/sMer/sTyro3 were measured by enzyme‐linked immunosorbent assay (ELISA), then the associations between sAxl/sMer/sTyro3 levels and clinical features of RA patients were analysed. We also investigated whether sTyro3 could promote osteoclast differentiation in vitro in RA patients. The results showed that compared with healthy controls (HCs), sTyro3 levels in the serum of RA patients were elevated remarkably and sMer levels were decreased significantly, whereas there was no difference between HCs and RA patients on sAxl levels. The sTyro3 levels were correlated weakly but positively with white blood cells (WBC), immunoglobulin (Ig)M, rheumatoid factor (RF), swollen joint counts, tender joint counts, total sharp scores and joint erosion scores. Conversely, there were no significant correlations between sMer levels and the above indices. Moreover, RA patients with high disease activity also showed higher sTyro3 levels. In‐vitro osteoclast differentiation assay showed further that tartrate‐resistant acid phosphatase (TRAP)+ osteoclasts were increased significantly in the presence of sTyro3. Collectively, our study indicated that serum sTyro3 levels were elevated in RA patients and correlated positively with disease activity and bone destruction, which may serve as an important participant in RA pathogenesis.
Keywords: bone destruction, disease activity, rheumatoid arthritis, TAM receptor tyrosine kinases
Introduction
The TAM receptor tyrosine kinases (TAM RTK) are a subfamily of receptor tyrosine kinases, which are composed of two immunoglobulin‐like domains and fibronectin type III repeats in the extracellular domains, a hydrophobic transmembrane domain and a tyrosine kinase domain 1. The TAM RTK subfamily has three members including Tyro3, Axl and Mer 2, and are expressed on macrophages, monocytes, dendritic cells and other cell types 3, 4, 5, 6. It has been well demonstrated that with binding to their common ligands, growth arrest‐specific 6 (Gas6) and protein S, TAM receptors play important roles on apoptosis, inflammation, haemostasis and cancer development 7, such as the restriction function on the immune responses and inflammatory cytokine production by inducing the transcription of suppressor of cytokine signaling 1 (SOCS1) and SOCS3 and inhibiting Toll‐like receptor (TLR) signalling pathways 8.
Some studies have demonstrated that the soluble form of TAM receptors can also be induced by proteolytic cleavage of their ectodomain in murine cells, and the metalloproteinase A disintegrin and metalloproteinase protein (ADAM)10 and ADAM17 are mainly responsible for cleavage of TAM receptors 9, 10, 11. Moreover, the associations between soluble Axl/Mer (sAxl/sMer) levels and ADAM17/ADAM10 levels were also found in systemic lupus erythematosus or multiple sclerosis lesion patients' serum 12, 13. Furthermore, the soluble form may lead to the inactivation of the TAM receptors with reducing membrane‐bound receptors and neutralization of the TAM ligands as a decoy receptor 14. Recently, the different roles of soluble TAM receptors have been implicated in the autoimmune disease, which may even act as a potential biomarker 1, 15. Both the other studies and our previous study revealed that the sMer and sAxl levels in plasma were correlated positively with disease activity and nephritis in systemic lupus erythematosus (SLE) patients 6, 12, 16, 17. Some research showed that the plasma levels of sMer were also elevated in primary Sjögren's syndrome (pSS) patients, which were associated with disease activity 18.
Rheumatoid arthritis (RA) is a common autoimmune disease characterized by chronic and consistent inflammation, hyperactivation of T cells and B cells, hyperplasia of synoviocytes and joint destruction, leading to severe disability and death 19. Although the aetiology of RA remains unclear, the involvement of inflammatory cytokines and osteoclasts in RA pathogenesis has been well demonstrated 20. Recently, the Tyro3/Gas6 signal pathway was described to have a novel function of stimulating the bone‐resorbing activity of osteoclasts 21, 22, 23. However, the functions of soluble TAM receptors in RA remain largely unknown. In particular, their roles in RA inflammation and bone destruction need to be studied.
In the present study, we compared the serum concentrations of soluble TAM (sTAM) in RA patients with those of osteoarthritis (OA) patients and healthy controls and analysed the relationships between sTAM and serological characteristics, joint damage and disease activity in RA patients. Our results revealed that the serum levels of soluble Tyro3 (sTyro3) were increased significantly in RA patients compared with OA patients and healthy controls, while soluble Mer (sMer) concentrations were decreased significantly. However, only elevated sTyro3 levels showed association with joint damage and disease activity in RA patients. Moreover, in‐vitro osteoclast differentiation assay showed that tartrate‐resistant acid phosphatase (TRAP)+ osteoclasts were increased significantly in the presence of sTyro3, which might further suggest the pathogenic role of sTyro3 in RA disease progression.
Materials and methods
Patients and healthy controls
Patients with RA (n = 306) (235 females, 71 males, mean age: 58·4 ± 12·5) fulfilling the 1987 American College of Rheumatology revised criteria 24 were recruited at the Department of Rheumatology and Immunology, Peking University People's Hospital, China. OA patients (n = 100, 79 females, 21 males, mean age: 58·7 ± 8·5) meeting the 1995 American College of Rheumatology criteria 25 were enrolled as a disease control. Sera were also collected from healthy controls (n = 120, 92 females, 28 males, mean age: 37·1 ± 10·5) without autoimmune diseases in the physical examination centre of our hospital. The present study was approved by Institutional Medical Ethics Review Board of Peking University People's Hospital (2016PHB163‐01). All patients and healthy controls provided written informed consent for participation in this study.
Clinical and laboratory parameters of RA patients
The following data of RA patients were recorded: gender, age, disease course, clinical features, medicines and laboratory indices, including white blood cells (WBC), red blood cells (RBC), haemoglobin (Hb), platelets (PLT), immunoglobulin (Ig)G, IgA, IgM, erythrocyte sedimentation rate (ESR), C‐reactive protein (CRP), rheumatoid factor (RF) and anti‐cyclic citrullinated peptide antibody (anti‐CCP antibody).
Disease activity scores in RA patients were calculated using the 28‐joint Disease Activity Score‐erythrocyte sedimentation rate (DAS28‐ESR) with three variables based on assessment of 28 joints and ESR. We classified the disease activity scores according to the recommendations from the European League Against Rheumatism, and DAS28‐ESR > 5·1 was considered high disease activity.
Radiographs were scored on the basis of the van der Heijde modification of the Sharp score method, including joint erosion scores, joint space narrowing scores and total Sharp scores (TSS) assessed by two experienced radiologists who were blinded to the patients' data.
Detection of serum sAxl, sMer and sTyro3 levels by enzyme‐linked immunosorbent assay (ELISA)
Serum sAxl (catalogue no.: DY154), sMer (catalogue no.: DY6488) and sTyro3 (catalogue no.: DY859) concentrations were detected independently using the DuoSet sandwich ELISA kits purchased from R&D Systems (Minneapolis, MN, USA). Ninety‐six‐well microplates (Corning, New York, NY, USA) were coated with 100 μl monoclonal antibody dilutions against human Axl/Mer/Tyro3 RTK overnight at room temperature. Next, the plates were washed three times with 300 μl 0·05% Tween 20 in phosphate‐buffered saline (PBS) (137 mM Nacl, 2·7 nM KCl, 8·1 mM Na2HPO4, 1·5 mM KH2PO4, PH 7·2–7·4, 0·2 µm filtered). Then, the plates were blocked with 300 μl 1% bovine serum albumin (BSA) in PBS for 1·5 h. The plates were washed as above. A seven‐point standard curve using twofold serial dilutions in blocking buffer was established. The serum samples were diluted with blocking buffer (sAxl: 100 times, sMer/sTyro3: 10 times); 100 μl/well‐prepared samples or standards were added and incubated for 2 h at room temperature. The plates were washed as above and 100 μl biotinylated goat anti‐human Axl/Mer/Tyro3 antibody dilutions were added and also incubated for 2 h at room temperature. The plates then were washed as above and 100 μl/well streptavidin‐conjugated horseradish peroxidase was added and incubated for 20 min. The plates were washed as above and 100 μl/well tetramethylbenzidine (Neobioscience, Shanghai, China) was added as the substrate solution, then the colour reaction was stopped with 50 μl/well 50 μM 2 N H2SO4. The absorbance was detected immediately with a microplate reader (BioTek, Winooski, VT, USA) at 450 nm with a correction wavelength of 570 nm. The concentration was calculated by all‐in‐one microplate reader software.
Osteoclast differentiation assay in RA patients
Osteoclast differentiation was performed as described previously 26. Briefly, RA patient peripheral blood mononuclear cells (PBMCs) were isolated from fresh heparinized venous blood samples using Ficoll density‐gradient centrifugation, and were then plated in α‐minimum essential medium (MEM) (Life Technologies, Grand Island, NY, USA) supplemented with 10% fetal bovine serum (FBS) (Life Technologies) at 5 × 10⁴ cells per 200 μl per well in 96‐well plates. After adhering for 4 h in the incubator, non‐adherent cells were removed and the adherent osteoclast precursors (> 90% CD14+) were cultured further under the stimulation of 30 ng/ml recombinant macrophage–colony‐stimulating factor (rhM‐CSF) (Peprotech GmbH, Rocky Hill, CT, USA) and 50 ng/ml recombinant human receptor activator of nuclear factor kappa‐Β ligand (rhRANKL) (R&D Systems, Minneapolis, MN, USA) with or without 500 ng/ml rhTyro3 Fc chimera (R&D Systems). The medium was changed every 3 days. On day 17, the cells were harvested for TRAP staining with the leucocyte acid phosphatase kit (Sigma‐Aldrich, St Louis, MO, USA) and TRAP‐positive multinucleated cells (three or more nuclei) were counted under an inverted fluorescence microscope (Olympus IX71–141, Tokyo, Japan).
Statistical analysis
All analyses were performed on spss version 19.0 for Windows (SPSS Inc., Chicago, IL, USA). The data were shown as frequency for categorical variables, and mean ± standard deviation (s.d.), median and interquartile range (IQR) for continuous variables. Continuous variables were analysed by covariance analysis (Dunnett's T3 test for post‐hoc test), the Mann–Whitney U test or Wilcoxon's matched‐pairs signed‐rank test. Spearman's correlation coefficient was applied to assess the correlations between two variables. P < 0·05 was considered significant.
Results
Characteristics of RA patients
A total of 306 RA patients were enrolled into this study. The ratio of male to female was approximately 1 : 3·3 (71 males, 235 females), with a mean age of 58·4 ± 12·5 (20–88) years and a median disease duration of 8 (IQR = 3–15) years. The mean DAS28‐ESR score of the RA patients was 5·3 ± 1·8 (0·68–8·67), in which 160 patients (53·27%) had high disease activity with DAS28‐ESR greater than 5·1. Among these patients, 171 patients (55·88%) were receiving treatment with multiple drugs, including non‐steroidal anti‐inflammatory drugs, methotrexate, leflunomide, sulphasalazine, total glucosides of paeony, hydroxychloroquine, Tripterygium wilfordii polyglycoside and anti‐tumour necrosis factor (TNF)‐α inhibitor. However, they were still active and had a high disease activity (DAS28‐ESR score: 5·4 ± 1·9). In this study, 300 patients were enrolled for serum samples for ELISA assay and six patients were enrolled for osteoclast differentiation assay. Clinical and demographic characteristics of RA patients are presented in Table 1.
Table 1.
Demographic and clinical characteristics of rheumatoid arthritis (RA) patients
| Characteristics | RA patients (n = 306) |
|---|---|
| Age, years | 58·4 ± 12·5 |
| Female (n, %) | 235, 76·8 |
| Male (n, %) | 71, 23·2 |
| Duration of RA (years) | 8 (IQR: 3–15) |
| SJC (0–28) | 5 (IQR: 1–14) |
| TJC (0–28) | 6 (IQR: 1–20) |
| RF (IU/ml) | 147 (IQR: 30·7–425·5) |
| Anti‐CCP antibody (IU/ml) | 181·3 (IQR: 76·7–200) |
| ESR (mm/h) | 51·5 (IQR: 27–87) |
| CRP (mg/l) | 20·1 (IQR: 8·1 −50·9) |
| DAS28‐ESR | 5·3 ± 1·8 |
| Under treatment (n, %) | 171, 55·88 |
| NSAIDs | 35/171, 20·47 |
| MTX | 54/171, 31·58 |
| LEF | 90/171, 52·63 |
| Pred | 49/171, 28·65 |
| SASP | 26/171, 15·2 |
| TGP | 26/171,15·2 |
| HCQ | 21/171, 12·28 |
| TWP | 18/171, 10·53 |
| Anti‐TNF‐α inhibitor | 9/171, 5·26 |
CRP = C‐reactive protein; DAS = disease activity score; ESR = erythrocyte sedimentation rate; HCQ = hydroxychloroquine; LEF = leflunomide; MTX = methotrexate; NSAIDs = non‐steroidal anti‐inflammatory drugs; Pred = prednisolone; RA = rheumatoid arthritis; RF = rheumatoid factor; SASP = sulphasalazine; SJC = swollen joint counts; TGP = total glucosides of paeony; TJC = tender joint counts; TWP = Tripterygium wilfordii polyglycoside.
The serum levels of sTyro3, sMer and sAxl in RA patients
The levels of sMer in the sera of RA patients (7·2 ng/ml, IQR = 4·9–10·4 ng/ml) and OA patients (4·4 ng/ml, IQR = 2·4–5·9 ng/ml) were decreased powerfully in comparison to healthy controls (11·3 ng/ml, IQR = 8·2–13·9 ng/ml) [F = 62·53, P < 0·001; RA versus healthy controls (HC) = P < 0·001; OA versus HC, P < 0·001; RA versus OA, P < 0·001] (Fig. 1a). However, sTyro3 concentrations were clearly elevated in RA patients (2·7 ng/ml, IQR = 2·0–3·6 ng/ml) compared with OA patients (1·9 ng/ml, IQR = 1·5–2·2 ng/ml) and healthy controls (2·4 ng/ml, IQR = 1·9–3·0 ng/ml) (F = 25·759, P < 0·001; RA versus HC, P < 0·01; OA versus HC, P < 0·05; RA versus OA, P < 0·001) (Fig. 1b). The concentrations of sAxl in the sera of RA patients (40·6 ± 13·4 ng/ml) had no significant distinction from those in OA patients (40·8 ± 10·1ng/ml) and healthy controls (38·6 ± 10·8 ng/ml) (F = 0·047, P = 0·954) (Fig. 1c).
Figure 1.
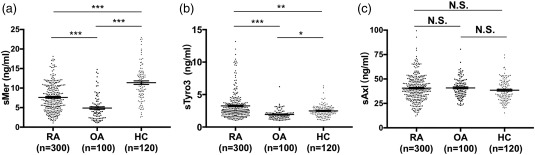
Soluble Mer (sMer) (a), soluble Tyro3 (sTyro3) (b) and soluble Axl (sAxl) (c) levels in sera of rheumatoid arthritis (RA) patients, osteoarthritis (OA) patients and healthy controls (HC). (a) The concentrations of sMer were decreased in RA patients and OA patients compared with healthy controls. (b) sTyro3 levels were significantly increased relative to OA patients and healthy controls. (c) sAxl levels had no difference among RA patients, OA patients and healthy controls. The analyses were performed by covariance analysis (Dunnett's T3 test for post‐hoc test), *P < 0·05; **P < 0·01; ***P < 0·001; N.S. = not significant.
The relationship between sMer, sTyro3 levels and parameters of RA patients
In RA patients, the concentrations of sTyro3 were found to be correlated weakly but significantly with WBC number, IgM level and RF (r = 0·192, P = 0·001; r = 0·163, P = 0·007; r = 0·133, P = 0·026, respectively), but there was no correlation between the levels of sTyro3 and age, RBC, Hb, PLT, IgA, IgG, ESR, CRP or anti‐CCP antibody. The levels of sTyro3 also had a significantly positive correlation with swollen joint counts (SJC) and tender joint counts (TJC) (SJC = r = 0·159, P = 0·008; TJC = r = 0.226, P = 0·001). However, the concentrations of sMer showed no correlation with the above‐mentioned parameters (Table 2). There was no difference between female and male patients and treated and untreated patients on both sTyro3 (Fig. 2a,b) and sMer levels (data not shown).
Table 2.
The correlations between the levels of sMer/sTyro3 and clinical features in rheumatoid arthritis (RA) patients
| sMer | sTyro3 | |||
|---|---|---|---|---|
| Features | r | P‐value | r | P‐value |
| Age (years) | 0·094 | 0·118 | 0·044 | 0·466 |
| WBC | 0·027 | 0·653 | 0·192 | 0·001 |
| RBC | −0·091 | 0·183 | 0·023 | 0·726 |
| Hb | −0·114 | 0·095 | 0·008 | 0·899 |
| PLT | 0·121 | 0·078 | 0·063 | 0·340 |
| IgA | 0·029 | 0·634 | 0·066 | 0·276 |
| IgM | 0·063 | 0·299 | 0·163 | 0·007 |
| IgG | 0·003 | 0·963 | 0·080 | 0·186 |
| ESR | 0·093 | 0·125 | −0·007 | 0·912 |
| CRP | 0·125 | 0·064 | 0·028 | 0·639 |
| RF | 0·041 | 0·494 | 0·133 | 0·026 |
| Anti‐CCP antibody | −0·076 | 0·230 | 0·018 | 0·781 |
| SJC | 0·092 | 0·127 | 0·159 | 0·008 |
| TJC | 0·081 | 0·181 | 0·226 | 0·001 |
Anti‐CCP antibody = anti‐cyclic citrullinated peptide antibody; CRP = C‐reactive protein; ESR = erythrocyte sedimentation rate; Hb = haemoglobin; Ig = immunoglobulin; PLT = platelet; RBC = red blood cell; RF = rheumatoid factor; SJC = swollen joint counts; sMer = soluble Mer; sTyro3 = soluble Tyro3; TJC = tender joint counts; WBC = white blood cell. Bold fonts highlights the significant correlation between clinical parameters and sTyro3 levels.
Figure 2.
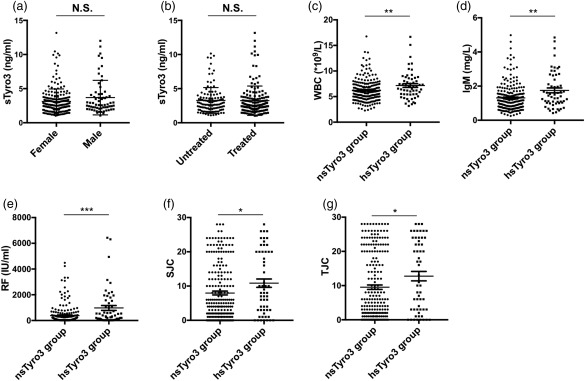
Associations between soluble Tyro3 (sTyro3) levels and clinical features of rheumatoid arthritis (RA) patients. Patients were divided by 90% confidence interval (1·0–4·0 ng/ml) from healthy controls for sTyro3 levels calculated by spss version 19.0: patients with sTyro3 levels greater than 4·0 ng/ml were grouped into the high sTyro3 (hsTyro3) group; sTyro3 levels of all other patients were between 1·0 and 4·0 ng/ml and these patients were grouped into the normal sTyro3 (nsTyro3) group. No difference was found between female and male patients (a), treated and untreated patients (b) on sTyro3 levels. White blood cells (WBC) (c), immunoglobulin (Ig)M (d), rheumatoid factor (RF) (e), swollen joint counts (SJC) (f) and tender joint counts (TJC) (g) were increased significantly in the hsTyro3 group. The analyses were performed by Mann–Whitney U test, *P < 0·05; **P < 0·01, ***P < 0·001.
Next, the RA patients were divided into two groups by 90% confidence interval (CI) (mean ± 1·645 s.d. value) for sMer (3·8–19·0 ng/ml) or sTyro3 (1·0–4·0 ng/ml) levels in HCs. The RA patients with sTyro3 levels greater than 4·0 ng/ml were defined as the high sTyro3 (hsTyro3) group; others with sTyro3 levels between 1·0 and 4·0 ng/ml were defined as the normal sTyro3 (nsTyro3) group. Similarly, patients with sMer levels below 3·8 ng/ml were grouped into the low sMer (lsMer) group and others were grouped into the normal sMer (nsMer) group. Furthermore, detailed analyses showed that the values of WBC, IgM and RF were elevated significantly in the hsTyro3 group compared to the nsTyro3 group (WBC = –2·792, P = 0·005; IgM Z = –2·908, P = 0·004; RF Z = –3·41, P = 0·001) (Fig. 2c–e), but there was no difference between the two groups in the levels of RBC, Hb, PLT, IgA, IgG, ESR, CRP and anti‐CCP antibody. In addition, the results also showed that compared with the nsTyro3 group, the hsTyro3 group had significantly higher SJC and TJC (SJC Z = –2·055, P = 0·040; TJC Z = –2·189, P = 0·029) (Fig. 2f,g), while in contrast to sTyro3 there was no difference between the nsMer and lsMer groups in the above‐mentioned parameters of RA patients (data not shown).
sTyro3 levels were correlated with RA disease activity
The DAS28 score based on ESR was calculated according to the recommendations from the European League Against Rheumatism (EULAR) for patients. The serum levels of sTyro3 were correlated weakly but positively with DAS28‐ESR (r = 0·185, P = 0·002), whereas the levels of sMer showed no correlation (Fig. 3a,b). We then grouped patients further into high disease activity (DAS28‐ESR > 5·1) and medium/low disease activity groups (DAS28‐ESR scores ≤ 5·1). The results showed that the concentrations of sTyro3 in the high disease activity group (3·0 ng/ml, IQR = 2·1–3·9) were significantly higher than those of the medium/low disease activity group (2·5 ng/ml, IQR = 1·9–3·3) (Z = –2·719, P = 0·007) (Fig. 3c). However, there was no difference between the high and medium/low disease activity groups on sMer levels (Fig. 3d).
Figure 3.
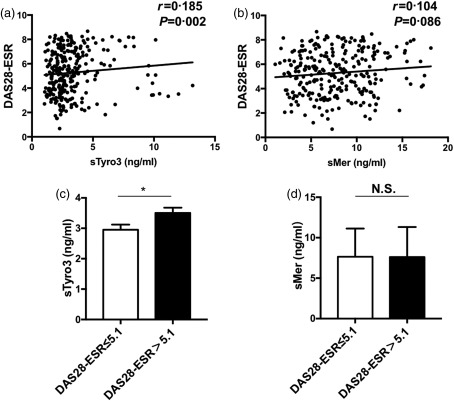
Associations between soluble Mer and Tyro3 levels and rheumatoid arthritis (RA) patient disease activity score based on erythrocyte sedimentation rate (ESR) [28‐joint disease activity score (DAS28)‐ESR]. The correlation analyses between soluble Mer (sMer) / soluble Tyro3 (sTyro3) levels and DAS28‐ESR were performed by Spearman's correlation coefficient (a, b). sTyro3 levels in patients with DAS28‐ESR > 5·1 were higher than those of patients with DAS28‐ESR scores ≤ 5·1 (c), while no difference was indicated between two groups on sMer levels (d). The analyses were performed by Mann–Whitney U‐test, *P < 0·05; N.S. = not significant.
Correlation between sTyro3 levels and joint damage in RA patients
Moreover, some studies reported that the Tyro3/Gas6 signal pathway may have a novel function of stimulating the bone‐resorbing activity of osteoclasts. Therefore, we also further evaluated 180 RA patient joint erosion scores, joint space narrowing scores and total Sharp scores, which were the most commonly used methods to assess joint damage on X‐rays in RA.
The results showed that the median joint erosion scores, joint space narrowing scores and total Sharp scores were 28 (IQR = 10–62), 43 (IQR = 20–64) and 69 (IQR = 36–120), respectively. We found that the concentrations of sTyro3 were correlated weakly but positively with total Sharp scores (r = 0.156, P = 0.045) (Fig. 4a) and joint erosion scores (r = 0·159, P = 0·041) (Fig. 4b), while no correlation was found between sTyro3 levels and joint space narrowing scores (r = 0·135, P = 0·084) (Fig. 4c). Moreover, the total Sharp scores and joint erosion scores were increased dramatically in the hsTyro3 group compared with the nsTyro3 group (Z = –2·078, P = 0·038; Z = –2·344, P = 0·019), while there was no difference between two groups on joint space narrowing scores (Fig. 4d–f). Conversely, there was no correlation between sMer levels and the above‐mentioned parameters of RA patients in this study (data not shown).
Figure 4.
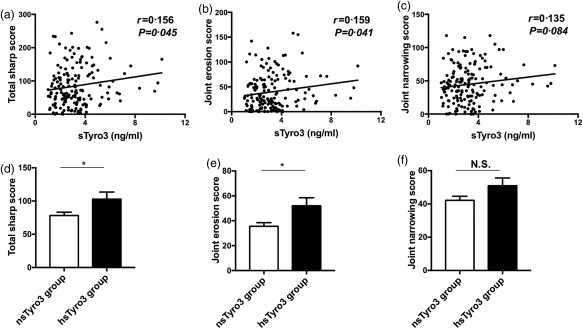
Correlations between soluble Tyro3 (sTyro3) levels and rheumatoid arthritis (RA) patient total Sharp scores, joint space narrowing scores and erosion scores. Positive correlations between sTyro3 levels and total Sharp scores (a), joint erosion scores (b) were found, but no correlation was found between sTyro3 levels and joint space narrowing scores (c). Next, we also grouped these patients as mentioned in Fig. 2; significant difference was shown between the high (hsTyro3) and normal sTyro3 (nsTyro3) groups with total Sharp scores (d) and joint erosion scores (e), but not joint space narrowing scores (f). The analyses were performed by Spearman's correlation coefficient and Mann–Whitney U test, *P < 0·05, N.S. = not significant.
Osteoclast‐priming effects of sTyro3 in RA patients
Considering the correlation between sTyro3 and total Sharp scores and joint erosion scores, we investigated further the potential role of soluble Tyro3 in RA patients using osteoclast differentiation assay in vitro. 5 × 10⁴ freshly isolated peripheral blood mononuclear cells (PBMCs) were plated for adhering for 4 h in the incubator; the adherent osteoclast precursors were cultured further with or without rhTyro3 Fc under the stimulation of rhM‐CSF and rhRANKL, and cells were then harvested for TRAP staining. The results showed that TRAP+ osteoclasts were increased significantly in the presence of rhTyro3 Fc (Z = –2·207, P = 0·027) (Fig. 5a,b). Collectively, these results proved further that soluble Tyro3 might play a pathogenic role in RA with osteoclast‐priming effects, which confirmed further the correlation analysis results.
Figure 5.
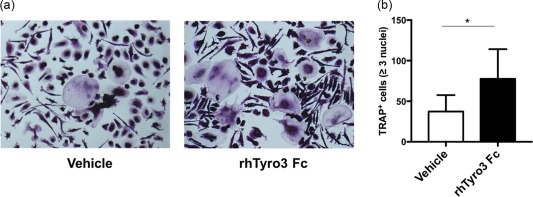
Soluble Tyro3 (sTyro3) promoted osteoclast differentiation in rheumatoid arthritis (RA) patients. Freshly isolated peripheral blood mononuclear cells (PBMCs) were cultured with or without rhTyro3 Fc (500 ng/ml) under the stimulation of recombinant human macrophage colony‐stimulating factor (rhM‐CSF) (30 ng/ml) and recombinant human receptor activator of nuclear factor kappa‐Β ligand (rhRANKL) (50 ng/ml). Medium was changed every 3 days. Then, cells were subjected to tartrate‐resistant acid phosphatase (TRAP) staining on day 17. One representative experiment of six (a) and the statistical results were shown (b). The analysis was performed by Wilcoxon's matched‐pairs signed‐rank test, *P < 0·05. [Colour figure can be viewed at wileyonlinelibrary.com]
Discussion
In addition to the roles of TAM RTKs in tumours, nervous system disorders and other diseases 27, 28, 29, more studies in recent years have focused upon their role in autoimmune disease 6, 30. In this study, continuing from our previous work on the increased levels of soluble TAM receptor tyrosine kinases in patients with SLE 6, 12, we measured the serum levels of sAxl, sMer and sTyro3 in RA patients and found that elevated sTyro3 levels in RA patients were associated significantly with clinical features, disease activity and bone destruction. However, diminished sMer levels showed no significant correlation with those parameters and no difference on sAxl levels was observed between RA patients and healthy controls.
The first finding of this study was that, compared with healthy controls, RA patients exhibited higher serum sTyro3 levels and lower sMer levels, which indicated the dysregulated level of soluble TAM receptor tyrosine kinases in RA. Interestingly, changes in the sTAM levels are not completely consistent among autoimmune diseases. Our previous study and other groups' findings demonstrated that sAxl and sMer levels were elevated in the plasma of SLE patients 6, 12, 31. However, Qin et al. 18 found only elevated plasma levels of sMer in pSS patients; i.e. there was no significant difference in sAxl or sTyro3 levels between pSS patients and healthy controls. Moreover, Iman et al. and Wu et al. measured the plasma levels of sAxl and sMer/sTyro3 in RA patients, respectively. Iman et al. tested plasma from 77 RA patients and found that the plasma concentrations of sAxl were decreased compared to healthy controls 32. In addition, results from Wu et al. 16. showed increased levels of sMer and sTyro3 in patients with early RA. There are several possible explanations for these discrepancies: (i) ADAM are well known to cleave the extracellular domain of TAM receptors and release them from the cell surface into the blood, which are markedly higher in serum of RA patients 33. This may be the partial reason for the increased level of sTAM. (ii) Being members of the TAM receptor tyrosine kinase family, Axl, Mer and Tyro3 receptor tyrosine kinases must be regulated carefully in a dynamic balance to restrain excessive immunoreaction and preserve homeostasis in disease states, which may lead to the different change tendency among them. (iii) The three TAM receptor tyrosine kinases were found to have paradoxical roles in tumours 34, which indicated that the three members of TAM RTKs may play different roles on the same disease. (iv) The difference from other groups may have occurred because we measured the levels of sTAM in the sera of RA patients, not the plasma.
It was reported that TAM RTK‐deficient mice showed enlargement of the spleen and lymph nodes as well as hyperproliferation of activated B cells and T cells, which could give rise to a broad spectrum of autoimmune diseases, such as SLE and RA 35. Although the correlations between sTAM levels and clinical parameters in SLE patients have been well demonstrated by many research groups, the associations between abnormal levels of sTAM and clinical features in RA have not yet been elucidated fully. A recent study by Wu and colleagues also revealed higher plasma levels of sTyro3 in early RA patients, while no obvious correlation was found between sTyro3 concentrations and RA clinical features 16. In contrast, our study showed that elevated sTyro3 levels in RA patient sera were correlated positively with WBC, IgM, RF, swollen joint counts, tender joint counts and the DAS28‐ESR disease activity score. Furthermore, we found that in patients with high disease activity (DAS28‐ESR > 5·1), the concentrations of sTyro3 were markedly higher than in patients with the DAS28‐ESR score ≤ 5·1. However, diminished sMer had no correlation with these indices.
The progressive destruction of bone and cartilage is a typical pathological feature in RA 20. In 1998, expression of Tyro3 receptor tyrosine kinases in the multi‐nucleated osteoclasts was found by Yuka and colleagues 21. Recently, studies demonstrated further that activation of Tyro3 receptor tyrosine kinases by Gas6 contributed to the stimulation of synovial hyperplasia and osteoclastic bone resorption, which was confirmed in Tyro3–/– mice with increased bone mass and attenuated arthritis 22, 23. Therefore, in this study we assessed the correlation between sTAM levels and indices of bone destruction. As expected, the results showed that sTyro3 levels were correlated positively with total Sharp scores and joint erosion scores, whereas sMer showed no relevance to the above parameters. Furthermore, sTyro3 showed the osteoclast‐priming effects in the in‐vitro osteoclast differentiation assay. These results indicated strongly that Tyro3 receptor tyrosine kinase might play an important role in RA pathogenesis, particularly bone destruction, which needs to be studied further.
In summary, in the present study we measured systematically for the first time, to our knowledge, the soluble serum levels of the three members of TAM receptor tyrosine kinase subfamily in RA patients, and at the same time revealed their correlation with RA clinical features, and also found the osteoclast‐priming effects of soluble Tyro3 receptor tyrosine kinase in RA patients. Further functional studies need to be performed to elucidate the participation of TAM RTKs in RA development.
Disclosure
The authors declare no financial conflicts of interest.
Acknowledgements
This study was supported by grants from the National Natural Science Foundation of China (81172844, 81471600 and 81671609 to Y. S., 81671604 and 81302554 to F. H.). L. X. and F. H. carried out most of the experiments and manuscript preparation. Y. S. conceived the study, participated in the design and interpretation of results, reviewed and edited the manuscript. X. L. and Y. L. helped to collect samples and clinical data. H. Z., L. S. and H. Z. participated in the experiments and data analysis.
References
- 1. Rothlin CV, Carrera‐Silva EA, Bosurgi L, Ghosh S. TAM receptor signaling in immune homeostasis. Annu Rev Immunol 2015; 33:355–91. [DOI] [PMC free article] [PubMed] [Google Scholar]
- 2. Lemke G, Rothlin CV. Immunobiology of the TAM receptors. Nat Rev Immunol 2008; 8:327–36. [DOI] [PMC free article] [PubMed] [Google Scholar]
- 3. Seitz HM, Camenisch TD, Lemke G, Earp HS, Matsushima GK. Macrophages and dendritic cells use different Axl/Mertk/Tyro3 receptors in clearance of apoptotic cells. J Immunol 2007; 178:5635–42. [DOI] [PubMed] [Google Scholar]
- 4. Scutera S, Fraone T, Musso T et al Survival and migration of human dendritic cells are regulated by an IFN‐alpha‐inducible Axl/Gas6 pathway. J Immunol 2009; 183:3004–13. [DOI] [PubMed] [Google Scholar]
- 5. Hilliard BA, Zizzo G, Ulas M, Linan MK, Schreiter J, Cohen PL. Increased expression of Mer tyrosine kinase in circulating dendritic cells and monocytes of lupus patients: correlations with plasma interferon activity and steroid therapy. Arthritis Res Ther 2014; 16:R76. [DOI] [PMC free article] [PubMed] [Google Scholar]
- 6. Zhu H, Sun X, Zhu L et al Different expression patterns and clinical significance of mAxl and sAxl in systemic lupus erythematosus. Lupus 2014; 23:624–34. [DOI] [PubMed] [Google Scholar]
- 7. Nguyen KQ, Tsou WI, Kotenko S, Birge RB. TAM receptors in apoptotic cell clearance, autoimmunity, and cancer. Autoimmunity 2013; 46:294–7. [DOI] [PubMed] [Google Scholar]
- 8. Rothlin CV, Ghosh S, Zuniga EI, Oldstone MB, Lemke G. TAM receptors are pleiotropic inhibitors of the innate immune response. Cell 2007; 131:1124–36. [DOI] [PubMed] [Google Scholar]
- 9. Thorp E, Vaisar T, Subramanian M, Mautner L, Blobel C, Tabas I. Shedding of the Mer tyrosine kinase receptor is mediated by ADAM17 protein through a pathway involving reactive oxygen species, protein kinase Cδ, and p38 mitogen‐activated protein kinase (MAPK). J Biol Chem 2011; 286:33335–44. [DOI] [PMC free article] [PubMed] [Google Scholar]
- 10. Orme JJ, Du Y, Vanarsa K et al Heightened cleavage of Axl receptor tyrosine kinase by ADAM metalloproteases may contribute to disease pathogenesis in SLE. Clin Immunol 2016; 169:58–68. [DOI] [PMC free article] [PubMed] [Google Scholar]
- 11. Miller MA, Oudin MJ, Sullivan RJ et al Reduced proteolytic shedding of receptor tyrosine kinases is a post‐translational mechanism of kinase inhibitor resistance. Cancer Discov 2016; 6:382–99. [DOI] [PMC free article] [PubMed] [Google Scholar]
- 12. Zhu H, Sun X, Zhu L et al The expression and clinical significance of different forms of Mer receptor tyrosine kinase in systemic lupus erythematosus. J Immunol Res 2014; 2014:431896. [DOI] [PMC free article] [PubMed] [Google Scholar]
- 13. Weinger JG, Omari KM, Marsden K, Raine CS, Shafit‐Zagardo B. Up‐regulation of soluble Axl and Mer receptor tyrosine kinases negatively correlates with Gas6 in established multiple sclerosis lesions. Am J Pathol 2009; 175:283–93. [DOI] [PMC free article] [PubMed] [Google Scholar]
- 14. Sather S, Kenyon KD, Lefkowitz JB et al A soluble form of the Mer receptor tyrosine kinase inhibits macrophage clearance of apoptotic cells and platelet aggregation. Blood 2007; 109:1026–33. [DOI] [PMC free article] [PubMed] [Google Scholar]
- 15. Mok CC, Ding HH, Kharboutli M, Mohan C. Axl, ferritin, insulin‐like growth factor binding protein 2, and tumor necrosis factor receptor type ii as biomarkers in systemic lupus erythematosus. Arthritis Care Res (Hoboken) 2016; 68:1303–9. [DOI] [PMC free article] [PubMed] [Google Scholar]
- 16. Wu J, Ekman C, Jonsen A et al Increased plasma levels of the soluble Mer tyrosine kinase receptor in systemic lupus erythematosus relate to disease activity and nephritis. Arthritis Res Ther 2011; 13:R62. [DOI] [PMC free article] [PubMed] [Google Scholar]
- 17. Zizzo G, Guerrieri J, Dittman LM, Merrill JT, Cohen PL. Circulating levels of soluble MER in lupus reflect M2c activation of monocytes/macrophages, autoantibody specificities and disease activity. Arthritis Res Ther 2013; 15:R212. [DOI] [PMC free article] [PubMed] [Google Scholar]
- 18. Qin B, Wang J, Ma N et al The association of Tyro3/Axl/Mer signaling with inflammatory response, disease activity in patients with primary Sjogren's syndrome. Joint Bone Spine 2015; 82:258–63. [DOI] [PubMed] [Google Scholar]
- 19. Smolen JS, Aletaha D, McInnes IB. Rheumatoid arthritis. Lancet 2016; 388:2023–38. [DOI] [PubMed] [Google Scholar]
- 20. Catrina AI, Svensson CI, Malmstrom V, Schett G, Klareskog L. Mechanisms leading from systemic autoimmunity to joint‐specific disease in rheumatoid arthritis. Nat Rev Rheumatol 2016; 13:79–86. [DOI] [PubMed] [Google Scholar]
- 21. Nakamura YS, Hakeda Y, Takakura N et al Tyro3 receptor tyrosine kinase and its ligand, Gas6, stimulate the function of osteoclasts. Stem Cells 1998; 16:229–38. [DOI] [PubMed] [Google Scholar]
- 22. Katagiri M, Hakeda Y, Chikazu D et al Mechanism of stimulation of osteoclastic bone resorption through Gas6/Tyro3, a receptor tyrosine kinase signaling, in mouse osteoclasts. J Biol Chem 2001; 276:7376–82. [DOI] [PubMed] [Google Scholar]
- 23. Ruiz‐Heiland G, Zhao Y, Derer A et al Deletion of the receptor tyrosine kinase Tyro3 inhibits synovial hyperplasia and bone damage in arthritis. Ann Rheum Dis 2014; 73:771–9. [DOI] [PubMed] [Google Scholar]
- 24. Arnett FC, Edworthy SM, Bloch DA et al The American Rheumatism Association 1987 revised criteria for the classification of rheumatoid arthritis. Arthritis Rheum 1988; 31:315–24. [DOI] [PubMed] [Google Scholar]
- 25. Altman R, Asch E, Bloch D et al Development of criteria for the classification and reporting of osteoarthritis: classification of osteoarthritis of the knee. Arthritis Rheum 1986; 29:1039–49. [DOI] [PubMed] [Google Scholar]
- 26. Hu F, Liu H, Liu X et al Pathogenic conversion of regulatory B10 cells into osteoclast‐priming cells in rheumatoid arthritis. J Autoimmun 2017; 76:53–62. [DOI] [PubMed] [Google Scholar]
- 27. Paolino M, Penninger JM. The role of TAM family receptors in immune cell function: implications for cancer therapy. Cancers (Basel) 2016; 8:E97. [DOI] [PMC free article] [PubMed] [Google Scholar]
- 28. Pierce AM, Keating AK. TAM receptor tyrosine kinases: expression, disease and oncogenesis in the central nervous system. Brain Res 2014; 1542:206–20. [DOI] [PMC free article] [PubMed] [Google Scholar]
- 29. Deng T, Chen Q, Han D. The roles of TAM receptor tyrosine kinases in the mammalian testis and immunoprivileged sites. Front Biosci (Landmark Ed) 2016; 21:316–27. [DOI] [PubMed] [Google Scholar]
- 30. Rothlin CV, Lemke G. TAM receptor signaling and autoimmune disease. Curr Opin Immunol 2010; 22:740–6. [DOI] [PMC free article] [PubMed] [Google Scholar]
- 31. Ekman C, Jonsen A, Sturfelt G, Bengtsson AA, Dahlback B. Plasma concentrations of Gas6 and sAxl correlate with disease activity in systemic lupus erythematosus. Rheumatology (Oxford) 2011; 50:1064–9. [DOI] [PMC free article] [PubMed] [Google Scholar]
- 32. Bassyouni IH, El‐Wakd MM, Azab NA, Bassyouni RH. Diminished soluble levels of growth arrest specific protein 6 and tyrosine kinase receptor Axl in patients with rheumatoid arthritis. Int J Rheum Dis 2017; 20:53. [DOI] [PubMed] [Google Scholar]
- 33. Umemura M, Isozaki T, Ishii S et al Reduction of serum ADAM17 level accompanied with decreased cytokines after abatacept therapy in patients with rheumatoid arthritis. Int J Biomed Sci 2014; 10:229–35. [PMC free article] [PubMed] [Google Scholar]
- 34. Bosurgi L, Bernink JH, Delgado Cuevas V et al Paradoxical role of the proto‐oncogene Axl and Mer receptor tyrosine kinases in colon cancer. Proc Natl Acad Sci USA 2013; 110:13091–6. [DOI] [PMC free article] [PubMed] [Google Scholar]
- 35. Lu Q, Lemke G. Homeostatic regulation of the immune system by receptor tyrosine kinases of the Tyro3 family. Science 2001; 293:306–11. [DOI] [PubMed] [Google Scholar]