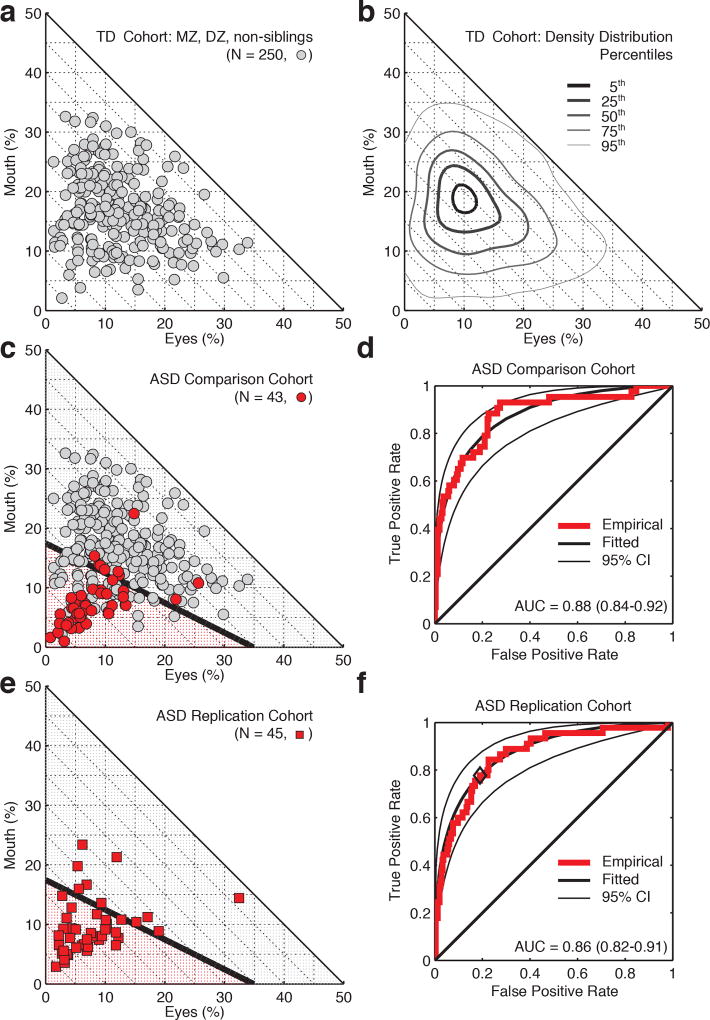
Figure 4. Comparison of social visual engagement in epidemiologically-ascertained toddlers from the general population relative to two cohorts of toddlers diagnosed with autism spectrum disorder (ASD).
a, Raw data marking individual levels of eye- and mouth-looking in 250 epidemiologically-ascertained toddlers watching video scenes of peer interaction. b, Population density contours for the data in (a). c, Comparison with data from 43 toddlers diagnosed with ASD. Black line marks classification boundary from linear discriminant analysis. d, Classification based on individual levels of social visual engagement. Threshold for the receiver operating characteristic (ROC) curve varied by extent of eye- and mouth-looking. e, Data from replication cohort of 45 toddlers with ASD. Classification boundary from (c). f, Classification based on individual levels of social visual engagement. As in (e), threshold for the ROC curve varied by extent of eye- and mouth-looking. Black diamond on red empirical ROC marks true positive and false positive rates observed in replication cohort using the optimal threshold identified in (c) and (d).

