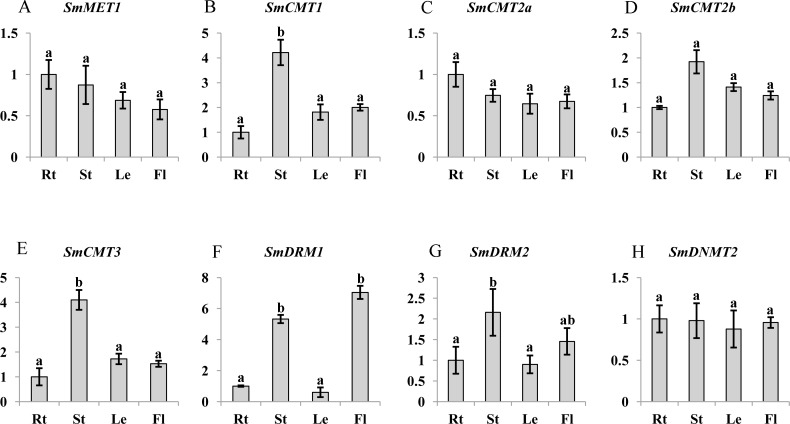
Figure 5. Transcript abundance of SmMET1 (A), SmCMT1 (B), SmCMT2a (C), SmCMT2b (D), SmCMT3 (E), SmDRM1 (F), SmDRM2 (G), and SmDNMT2 (H) in roots (Rt), Stems (St), leaves (Le) and flowers (Fl) of S. miltiorrhiza.
Transcript level was analyzed using quantitative real time RT-PCR. SmUBQ10 was used as a reference. qRT-PCR was performed in triplicates for each independent biological replicate. Transcript levels in roots were arbitrarily set to 1 and the levels in other tissues were given relative to this. One-way ANOVA was performed using IBM SPSS 20 software. P < 0.05 was considered statistically significant and represented by different letters. Error bars indicate the standard deviations for three biological replicates.

