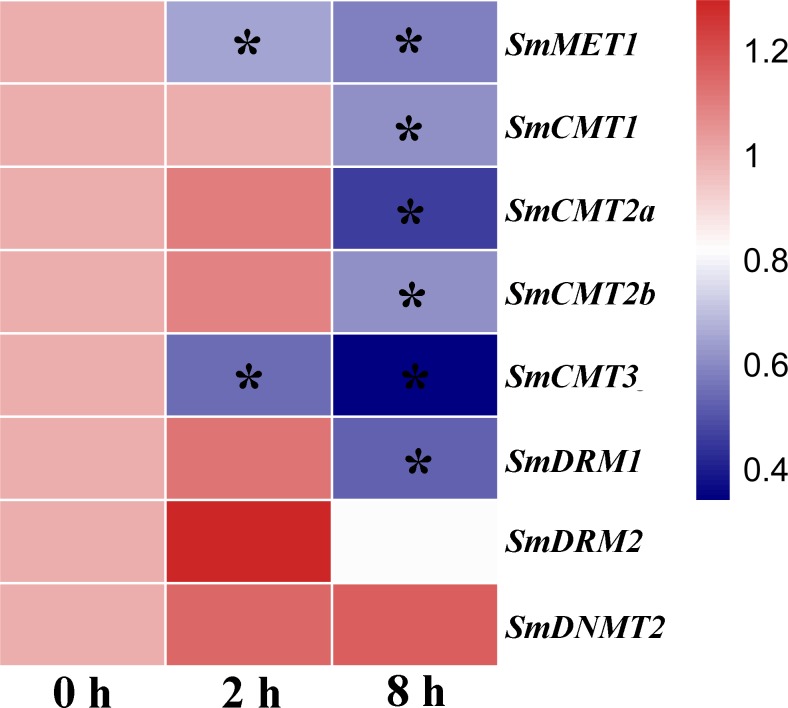
Figure 8. Responses of SmC5-MTase genes to SA treatment in S. miltiorrhiza cell cultures.
Transcript levels were detected at 0, 2 and 8 h of SA treatment. Differential analysis was performed using cufflinks software. P < 0.05 was considered statistically significant. ∗presents significant differential transcript abundance compared with 0 h.

