

Abstract
We report the in vitro assessment of pharmacotoxicity for the high-affinity GHB receptor ligand, NCS-382, using neuronal stem cells derived from mice with a targeted deletion of the aldehyde dehydrogenase 5a1 gene (succinic semialdehyde dehydrogenase(SSADH)-deficient mice). These animals represent a phenocopy of the human disorder of GABA metabolism, SSADH deficiency, that metabolically features accumulation of both GABA and the GABA-analog γ-hydroxybutyric acid in conjunction with a nonspecific neurological phenotype. We demonstrate for the first time using MDCK cells that NCS-382 is actively transported and capable of inhibiting GHB transport... Following these in vitro assays with in vivo studies in aldh5a1−/− mice, we found the ratio of brain/liver GHB to be unaffected by chronic NCS-382 administration (300 mg/kg; 7 consecutive days). Employing a variety of cellular parameters (reactive oxygen and superoxide species, ATP production and decay, mitochondrial and lysosomal number, cellular viability and necrosis), we demonstrate that up to 1 mM NCS-382 shows minimal evidence of pharmacotoxicity. As well, studies at the molecular level indicate that the effects of NCS-382 at 0.5 mM are minimally toxic as evaluated using gene expression assay. The cumulative data provides increasing confidence that NCS-382 could eventually be considered in the therapeutic armament for heritable SSADH deficiency.
Keywords: Succinic semialdehyde dehydrogenase (SSADH), SSADH deficiency (SSADHD), GABA metabolism, γ-hydroxybutyric acid (GHB), NCS-382, neuronal stem cells
Graphical Abstract
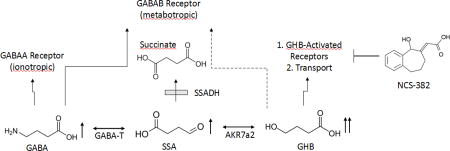
The pathway of GABA metabolism and potential receptor/transport interactions. The site of the defect in patients with succinic semiadehyde dehydrogenase (SSADH) deficiency is indicated by the shaded box. In response to the genetic block, patients accumulate GABA (gamma-aminobutyric acid), SSA (succinic semialdehyde) and GHB (gamma-hydroxybutyric acid), among other intermediates (indicated by upward-pointing arrows). NCS-382 is a high-affinity ligand that binds receptors activated by GHB, and has shown efficacy in mice with deletion of the SSADH gene. However, NCS-382 has not been piloted in human, and thus its toxicological profile must be established. Abbreviations, GABA-T, GABA transaminase; AKR7a2, aldo-keto reductase a2.
Introduction
Succinic semialdehyde dehydrogenase (SSADH; aldehyde dehydrogenase 5a1, ALDH5A1) deficiency (SSADHD) is an autosomal recessively inherited disorder of GABA metabolism. It is the most prevalent, yet very rare, heritable disorder on the GABA metabolic pathway (Fig. 1; Malaspina et al 2016) with ~200 identified patients; conversely, patients with GABA-transaminase deficiency (GABA-T) number less than 15 (Fig. 1; Koenig et al, 2017). Although numerous metabolic permutations are observed in SSADHD, the accumulation of two neuropharmacologically active species is notable. These include GABA (4-aminobutyric acid) and the GABA-derivative, γ-hydroxybutyric acid (GHB) (Vogel et al 2017). The former is the major central inhibitory neurotransmitter that leads to neuronal hyperpolarization through activation of receptors that are ligand-gated chloride channels (Kilb 2012). GHB is present in the central nervous system at a fraction of parent GABA (~ 1%), and has a varied pharmacological profile that includes cholinergic, dopaminergic and serotoninergic effects that remain incompletely defined (Maitre et al 2016a; Carai et al 2002; Gobaille et al 2002; Nava et al 2001; Poggioli et al 1999). GHB is used as an euphoric agent, a drug to perpetrate sexual assault, and as a clinically-approved therapeutic for narcolepsy. It is also under clinical investigation in other pathologies (Maitre et al 2016b; Fig.1). Beyond its approved FDA indication for narcolepsy, GHB is a Schedule I controlled substance.
Figure 1. Metabolic alterations in succinic semialdehyde dehydrogenase (SSADH) deficiency.

Deficiency of SSADH results in accumulation of GABA and GHB and concomitant decreases in succinate levels. Supranormal levels of GABA and GHB likely contribute to seizures in both patients and the aldh5a1−/− murine model via interactions with both GABA and GHB receptors. NCS-382 represents a high-affinity ligand of receptor(s) binding GHB, and a possible substrate inhibitor for GHB transport.. Under conditions of increased GABA, the mammalian target of rapamycin (mTOR) is activated, leading to inhibition of autophagy and mitophagy. The latter induces oxidative stress associated with increased mitochondrial numbers. XL-765 and Torin 2 represent potent inhibitors of mTOR. Upward arrows indicate an increase and downward arrows denote a decrease. Abbreviations: GHB, gamma-hydroxybutyric acid; SSADHD, succinic semialdehyde dehydrogenase deficiency; GABA, gamma-aminobutyric acid; GAD, glutamic acid decarboxylase; GABA-T, GABA-transaminase; SSA, succinic semialdehyde; #, number. For other abbreviations, see text.
The neurological phenotype of SSADHD includes developmental delay, neuropsychiatric morbidity, the absence of developed speech, hypotonia and variable seizures (Malaspina et al 2016). Targeted therapeutics are lacking, and most agents are used symptomatically. We have employed the corresponding knockout mouse model (aldh5a1−/− mice; aldh5a1=aldehyde dehydrogenase 5a1=succinic semialdehyde dehydrogenase) to develop a pipeline of potentially effective preclinical therapeutics that may hold therapeutic promise for SSADHD. Along those lines, the effectiveness of an early phosphinic acid GABAB receptor (GABABR) antagonist, CGP 35348 (Hogema et al 2001) in aldh5a1−/− mice led to an ongoing clinical trial (www.clinicaltrials.gov; NCT02019667) of the later-generation GABABR antagonist, SGS-742, an agent initially explored in patients with minimal cognitive impairment (Froestl et al 2004; Pearl et al 2009). Preclinical studies centered on therapeutics targeting GABAA receptor (GABAAR) function are underway, but have yet to progress to clinical intervention. GHB acts via both low- and high-affinity GHB receptors (although the molecular identity of these receptors remains undefined), as well as acting on subtypes of GABABR and GABAARs (Bay et al 2014; Absalom et al 2012; Klein et al 2016; Kaupmann et al 2003). In earlier studies, we demonstrated that the high-affinity GHB receptor ligand, NCS-382, rescued aldh5a1−/− mice from premature lethality, but corresponding functional studies associated with this effect were not performed (Gupta et al 2002). NCS-382, in the case of SSADHD therapeutics, appears antagonistic to GHB, but in other pharmacological settings this is not necessarily the case. Accordingly, more information must be garnered on the molecular nature of the GHB receptor before NCS-382 can be uniformly characterized as an antagonist ligand (Vogel et al 2017; Ainslie et al 2016).
Although the aldh5a1−/− mouse model represents a valuable tool in the identification of targeted therapeutics for SSADHD, the model is fragile with a significantly attenuated lifespan (less than 25 days), which represents a significant deterrent to performing preclinical drug-screening. Accordingly, we have turned attention to in vitro models for initial safety evaluations of potential therapeutics for SSADHD. We have previously reported on the safety/metabolic transformations of NCS-382 in vitro using hepatic cells (Vogel et al 2017). However, those studies did not examine the mechanisms by which NCS-382 enters the central nervous system (CNS) and the ensuing metabolic/molecular changes elicited following brain penetration. To begin to address the latter, we employed neuronal stem cells (NSCs) which represent an attractive alternative to immortalized hepatic cell lines, especially for a neurodevelopmental disorder such as SSADHD for which brain penetration of drug is mandatory.
NCS-382 may be transported into the brain on the monocarboxylate transporter (MCT-1), the same system utilized by GHB for brain penetration (Molnar et al 2008; Dave and Morris 2015; Vijay et al 2015). This transport has also been directly demonstrated for the GHB analog, HOCPCA (Thiesen et al 2015). This transport mechanism is relevant to the potential utility of NCS-382 in SSADHD since this agent could simultaneously block GHB binding in brain while competing with GHB entry into the brain from the peripheral circulation. Accordingly, we addressed this potential feature of NCS-382 therapeutics for SSADHD in two ways: 1) evaluation of NCS-382 transport kinetics in MDCK cells; and 2) quantitation of GHB in brain and liver as a function of chronic NCS-382 treatment in aldh5a1−/− mice. Our rationale for combined in vitro and in vivo system analyses was that the two systems provided parallel opportunities to examine the potential effects of NCS-382 on the transport characteristics of GHB for kidney and brain. Accordingly, here we present initial evaluations of safety/toxicity characteristics of NCS-382 using aldh5a1−/− NSCs, as well as the effects of NCS-382 on GHB transport in kidney epithelial cells and aldh5a1−/− mice. These studies represent furthersteps in the ongoing therapeutic consideration of NCS-382 in SSADHD.
Materials and Methods
Chemicals
NCS-382 (6,7,8,9-tetrahydro-5-hydroxy-5H-benzo-cyclohept-6-ylideneacetic acid) was obtained from the National Institutes of Health (NIDA). XL-765 and Torin 2 were purchased from Cayman Chemical (Ann Arbor, Michigan). Dimethyl Sulfoxide (DMSO), sulfosalicylic acid and acetonitrile were purchased from Sigma-Aldrich (St. Louis, MO). Fluorescent probes, NucBlue®, Mitotracker® Green, LysoTracker® Red, CellROX® Deep Red, MitoSOX™ Red dye, were purchased from Thermo Fisher (Waltham, MA). The Mitochondrial ToxGlo™ assay was obtained from Promega (Madison, WI). A complete description of reagents, concentrations, and target parameters employed for in vitro evaluation of cellular toxicity in NSCs is provided in Vogel et al (2017)
MDCK cell culture and transport studies with NCS-382 and GHB
To investigate NCS-382 cell permeability and the potential role of MCT-1 (a transport protein expressed in both the kidney and brain), Madin-Darby Canine Kidney (MDCK) cells were employed as test platform. MDCK cells were purchased from the American Type Culture Collection (ATCC) and expanded in DMEM supplemented with 10% fetal bovine serum (FBS) and 1% penicillin/streptomycin (Thermo Fischer) in 75 cm3 flasks. For permeability studies, cells were removed via the addition of trypsin, counted, reconstituted with supplemented DMEM and seeded onto 24-well transwell plates (3 μm pore size and 1.6 × 10⁶ per cm) to a density of 0.5 × 10⁵ cells/well. Cells were cultured in supplemented DMEM for 72 hours. Cells were subsequently exposed to hyperosmotic supplemented DMEM (500 mOsmo, adjusted with NaCl) for an additional 48 h to facilitate optimal MCT-1 transport activity (Nielsen et al 2016). Our working hypothesis was that MCT-1 would be responsible for NCS-382 transport, and thus our assay conditions were designed such that MCT-1 activation was optimal.
Initial experiments with NCS-382 and GHB were performed to determine the linear uptake kinetics with respect to concentration and time. Cells were first rinsed with three volumes of prewarmed (37°C) Hank’s Balanced Salt Solution (HBSS, 750 μl). Receiver (basolateral compartment; B) wells were loaded with 750 μl of pre-warmed HBSS. Compound treatments were prepared from methanol stocks and diluted in warm HBSS (% organic solvent < 0.2%). For apical to basolateral (A→B; uptake) experiments, 250 μl of the treatment solution was added to the donor (apical; A) side of the transwell plate. Linearity as a function of time was first evaluated for NCS-382 (100 μM) and GHB (485 μM) at 5–40 minutes. Our rationale for the dose selection was based upon the ~ 50 μg/g (or ~ 50 μg/ml assuming tissue density comparable to that of water) GHB tissue levels previously measured in aldh5a1−/− mouse brain (Ainslie et al 2016; Vogel et al 2017; Fig. 2). Thus, our choice of concentrations reflected levels relevant to the disease state. We had intended to optimize the GHB transporter kinetics by testing lower doses (e.g., 4.8 and 48 μM), but analytical sensitivity was insufficient.
Figure 2. Time- and interaction-dependent permeability evaluation of NCS-382 and GHB in MDCK cells.

Uptake/transport of NCS-382 (A) and GHB (B) in MDCK cells is shown as a function of time in cells cultured in transwell plates. Frames (C) and (D) show the uptake of NCS-382 (C) and GHB (D), both individually (white) and together (cross-hatched box). Time dependent determinations were conducted with 100 μM NCS-382 and 485 μM GHB. Uptake studies were conducted using 25 μM NCS-382 and/or 48 μM GHB. Each data point reflects the mean ± SD of three independent assays (each replicate determined in duplicate).
Linearity for NCS-382 concentration was determined following a 10-minute incubation, with treatments of 10, 25, 50 and 100 μM. For all permeability experiments, 150 μl aliquots of both the apical and basolateral medium were collected and diluted in 50 μl of water containing 0.1% formic acid, carbutamide (400 ng/ml internal standard) and 2H6-GHB (1 μg/ml internal standard) in 96-well plates. Plates were vortexed (0.5–2 minutes) then subjected to LC-MS/MS analysis. The integrity of the cell monolayer was verified prior to experiments using transepithelial electrical resistance (TEER, >150 Ω cm2), and subsequently after the completion of experiments by incubating with the low permeability fluorescent probe lucifer yellow (100 μM, 1h, <1.0 × 10⁻⁶ cm/s) (Oltra-Noguera et al 2015).
Uptake of NCS-382 and GHB was determined in MDCK cells. For these experiments, cells were seeded onto 6 well plates and cultured as described above. Prior to treatment, plates were washed with pre-warmed HBSS (3 x; 2 ml), then NCS-382 (25 μM), GHB (48 μM), or both were added and incubated for 10 minutes (37°C, 5% CO2). The medium was quickly removed and cells were rinsed with ice-cold HBSS (3 x; 2 ml) then lysed with 1 M cesium chloride (aq., 400 μl) and vigorous pipetting. The total lysate was transferred to a 1.5 ml microcentrifuge tube and centrifuged at 14,000 × g for 5 minutes. The supernatant (200 μl) was removed and diluted with 100 μl of the internal standard solution (as described above), vortexed and subjected to LC-MS/MS analysis.
Quantification of NCS-382 was conducted using a previously published method (Ainslie et al 2016) with modifications. To account for the difference in matrices, an Atlantis T3 (2.1 × 50, 3 μm particle size) analytical column was employed and injection volumes were increased to 10 μl before being detected on an AB Sciex 4000 triple quadrupole mass spectrometer operated in multiple reaction monitoring (MRM) mode and negative polarity. The MRM conditions for NCS-382 were 216.9→173.1 m/z and 270.0→171.0 m/z for the internal standard, carbutamide. GHB was quantified using positive polarity and 104.1→87 m/z and 111→93 m/z for GHB and 2H6-GHB (Internal standard), respectively. Calibration standards were prepared in warm HBSS and diluted identically to samples with the internal standard solution. Peak integration and data analysis was conducted using Analyst software (v1.2.1).
Quantification of GHB in aldh5a1+/+ and aldh5a1−/− mice following 7-day of NCS-382 dosing
All animal procedures were conducted in accordance to protocol 4232 and 4276, approved by the Washington State University Institutional Animal Care and Use Committee (IACUC). Mice were genotyped following tail biopsy and 3-primer PCR performed at day of life (DOL) 10 and were administered NCS-382 daily (i.p., 300 mg/kg body weight in 0.1% sodium bicarbonate) or vehicle, beginning at DOL15. Groups were comprised of 5–7 animals each and were sacrificed on DOL22 (~24 h following the last dose). Tissues were snap frozen in liquid nitrogen. Sera was collected; nonetheless, volumes were too low in samples derived from aldh5a1−/− mice for GHB quantification. In lieu of this, liver was used as a surrogate for systemic exposure. Measurement of GHB levels in the brain and liver derived from NCS-382 treated aldh5a1−/− mice followed previously published methods employing isotope dilution assessment (Gibson et al 1990). Levels of GHB as a function of NCS-382 treatment were corrected for wet tissue weight (Fig. 3).
Figure 3. Tissue levels of GHB in NCS-treated aldh5a1−/− mice.
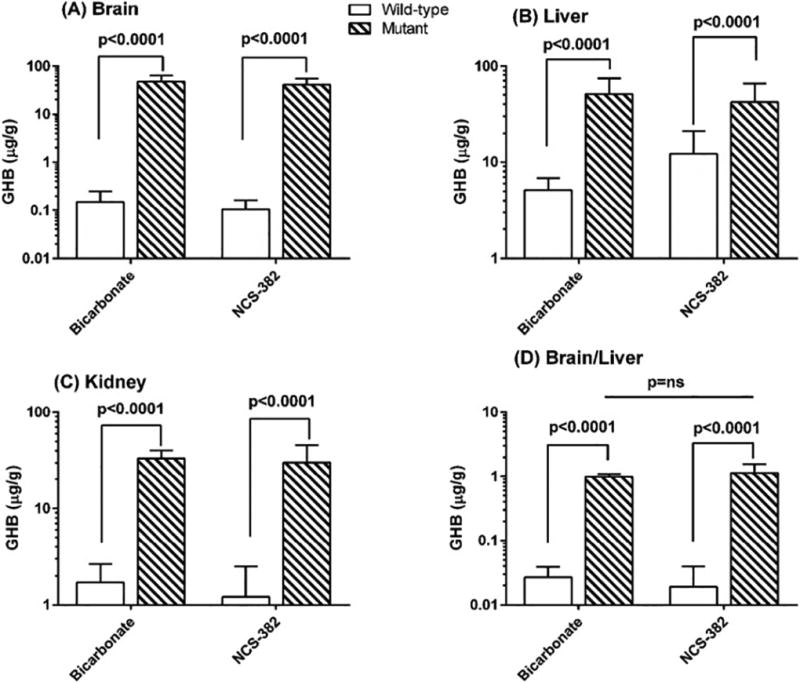
White bar graphs represent aldh5a1+/+ mice, while hatched (dark) bar graphs represent aldh5a1−/− mice. Each bar graph represents the mean ± SD of n=5–7 mice, each subject evaluated in duplicate. Animal subjects were injected intraperitoneally between 8–10 a.m. for 7 consecutive days with NCS-382 at 300 mg/kg. At the conclusion of final dosing, animal subjects were sacrificed within 12–24 hours and tissues rapidly harvested for metabolite analysis. Y-axis values represent GHB level in μg/g wet weight tissue. Vehicle for all studies was bicarbonate. Statistical analyses employed two way t tests.
Isolation and culture of mouse-derived neuronal stems cells (NSCs)
At postnatal day one of life (P1), pups (aldh5a1+/+ and aldh5a1−/−) were sacrificed, and the brain gently eviscerated into Hibernate media supplemented with penicillin/streptomycin and B27 medium (Thermo Fisher, Waltham, MA, USA). The cortex and hippocampal regions were dissociated with Versene (Thermo Fisher) in media (37°C). Cells were maintained in complete medium consisting of Neurobasal® A Medium (Thermo Fisher) supplemented with B-27® Serum-Free Supplement, GlutaMAX™ (Gibco, Thermo Fisher), antibiotic-antimycotic solution (Gibco, Thermo Fisher), FGF-basic (recombinant human (bFGF)), and EGF (recombinant human epidermal growth factor; Millipore, Darmstadt, Germany). Cells were expanded in 35-mm and 100-mm dishes coated with poly-L-ornithine (Sigma, St. Louis, MO). Confluent cells were passaged using Versene. Tail biopsies from P1 pups were obtained and genotype was determined as described (Hogema et al 2001). The neuronal status of these cells was confirmed using Nissl staining, as well as immunohistochemistry for Nestin and Sox2.
Biomarkers of mitochondrial function and oxidative stress, and perturbations of autophagy, quantified using a fluorescence cocktail
For these experiments, cells were cultured in 96-well plates (seeding density of 0.25 x10⁶ cells/cm2). Cells were treated with NCS-382 (0.01–1000 μM), XL-765 (0.01 μM), or vehicle (0.01% DMSO) for 24 hours. Cells were then supplemented with media favoring starvation through omission of B-27 and growth factors from complete medium described above. This depleted media is referred to as the ‘basal’ or ‘starvation’ media throughout the text and is employed to induce autophagy, a process which is dysregulated in aldh5a1−/− mice and responsive to correction by mTOR inhibitors (Vogel et al. 2016), including XL-765 and Torin 2. The latter two agents are inhibitors of mTOR (see Fig. 1), previously shown to override the effects of elevated GABA in aldh5a1−/− mice (Vogel et al, 2016), and served as positive controls for mitochondrial effects (Vogel et al 2017). The fluorescence cocktail employed to assess mitochondrial function and oxidative stress included: NucBlue® (2 drops/ml), Mitotracker® Green (1 nM or 1 μl/10 ml), LysoTracker® Red (75 nM or 0.75 μl/10 ml) and CellROX® Deep Red (5 μM or 20 μL/10 ml media; final volume achieved with Basal media). This cocktail was applied to individual cultures of cells 6 h following the initiation of starvation conditions, with fluorescence imaging performed on a BioTek Synergy HT plate reader. NucBlue was employed to normalize values to total cell number (based upon nuclei staining). Mitotracker green, Lysotracker Red and CellROX Deep Red measures were blank corrected and subsequently normalized to NucBlue.
Cytotoxicity and ATP consumption analyses in neuronal stem cells
NSCs cells were plated onto white 96-well plates with clear bottoms (VWR; cat:89136-852). Cells were subjected to treatment for 24 h and ≥ 3 wells containing cells remained untreated to serve as blanks for background signal correction. Cytotoxicity measurements employed fluorescence quantitation evaluated according to manufacturer’s instructions. Following fluorescent cytotoxicity measurements the luminescent probe and detection reagents (in lysis buffer) were prepared according to manufacturer’s instructions and sequential measurement of luminescence was made 5–60 minutes following the initiation of incubation. The luminescence signal was blank subtracted prior to cytotoxicity normalization. The luminescent signal output is directly proportional to ATP concentration. Cumulative outcomes using the Mitochondrial ToxGlo assay include the initial ATP level (initial measurement), as well as the rate of ATP consumption (initial rate, and half-life (t1/2)). All fluorescent and luminescent assays were quantified using a BioTek Synergy microplate reader.
Mitochondrial superoxide levels in NSCs treated with NCS-382 and Torin 2
Mitochondrial superoxide levels were measured in NSCs using the MitoSOX™ Red dye. A 0.5 mM stock solution was prepared in DMSO and diluted 100-fold in complete media to a final concentration of 5 μM (0.1% DMSO) and fluorescence was measured using a BioTek Synergy microplate reader with blank values subtracted.
Gene expression in NSCs under basal and treatment conditions employing qRT-PCR
Preparation of cell and tissue extracts, and gene expression analysis, followed previously described methodology (Vogel et al 2017). Briefly, Sybr green (Biorad) reactions were prepared as a master mix with 50 ng of cDNA/10 μl/well aliquoted into prearrayed and validated (per MIQE guidelines; Bustin et al., 2009) BioRad pathway finder plates (Epilepsy M384; PrimePCR™ SABioscience). A BioRad CFX384 real-time PCR with BioRad CFX Manager v3.0 software was employed for data acquisition, normalization, and statistical analysis.
Statistical and data analyses
MDCK cell permeability (PAAP) was calculated using equation 1:
| (1) |
In this equation, dQ/dt is the rate of permeation of drug across the cells, C0 is the donor compartment concentration at time zero, and A is the area of the cell monolayer. C0 was obtained from analysis of the dose solution at the onset of the experiment. Data is presented throughout in bar graphs which represent the mean ± SD (or SEM) and were analyzed using two-tailed t test for pairwise comparisons, or one- or two-way ANOVA followed by either Dunnet’s or Tukey’s posthoc testing across samples when three or more groups were evaluated. Statistical analyses were conducted using GraphPad Prism 6 (San Diego, CA, USA). For the majority of analyses, three independent analyses were used, with two samples evaluated within each independent analyses (n=6), consistent with previous studies of NCS-382 in hepatic cells (Vogel et al 2017).
Results
Cellular permeability and uptake of NCS-382 and GHB into MDCK cells
Using a transwell system and apical compartment dosing, the permeability of NCS-382 at 25, 50 and 100 μM was 7.6 ± 1.7, 1.4 ± 0.2 and 1.9 ± 0.2 × 10⁻⁶ cm/s, respectively, suggesting a saturable process consistent with active uptake (Fig. 2A). NCS-382 tested at 10 μM was below the limit of quantification. GHB permeability at 485 μM was 1.6 ± 0.9 cm/s (Fig. 2B). The highest GHB dose was selected to correspond to the levels measured in aldha5a1−/− mouse brains (see methods; Vogel et al 2017b). GHB was unquantifiable in the basolateral compartment at the lower concentrations tested (48 and 4.8 μM. In experiments in which the test compound (either species alone or in combination) was added to the basolateral compartment and sampled from the apical compartment, the levels were below the limit of quantification for both NCS-382 and GHB. With these experiments confirming that both NCS-382 and GHB are to some extent actively transported in MDCK cells, this phenomenon was further interrogated with uptake studies. The levels of NCS-382 in cell lysates were consistent regardless of the presence or absence of GHB (Fig 2C). However, GHB levels were decreased to below the limit of quantification (48 nM in cell lysates), representing ~ one-third of the value with GHB alone (Fig 2D).
Tissue GHB levels in aldh5a1−/− mice chronically treated with NCS-382
Based upon transport effects for NCS-382 in MDCK cells, we predicted that we would witness an effect of the GHB receptor antagonist in vivo in aldh5a1−/− mice. Accordingly, we next assessed tissue levels of GHB in aldh5a1−/− mice treated chronically with NCS-382. Mice were treated with NCS-382 at 300 mg/kg for 7 consecutive days. In all instances, GHB was significantly elevated by genotype (p < 0.0001), but was not significantly affected in aldh5a1−/− animals as a function of NCS-382 administration in any organ.
Importantly, the ratio of brain/liver was identical with and without NCS-382 (Fig. 3D). It is reasonable to assume that since the liver expresses considerable levels of SSADH enzyme activity, that hepatically produced GHB would be available for transport into the brain (Chambliss et al 1995). However, the data of Fig. 3 do not support this contention. Conversely, the short t1/2 of NCS-382 in peripheral tissues of mice (Ainslie et al 2016) could preclude potential competition with GHB transport in vivo.
Effect of NCS-382 on oxidative stress (reactive oxygen species) and organelle number in neuronal stem cells
We next evaluated NCS-382-mediated cellular toxicity in NSCs as a function of genotype (Fig. 4). Employing a cocktail of fluorescent probes, parameters of oxidative stress, mitochondrial and lysosome abundance were assessed (Fig. 4A-C). Vehicle-treated aldh5a1−/− NSCs exhibited a 50% increase in reactive oxygen species (ROS; p=0.0035, two-way ANOVA with Dunnett’s multiple comparison t test), a trend toward increased mitochondrial staining, and a trend toward decreased lysosomal staining in comparison to the same parameters quantified in aldh5a1+/+ NSCs. NCS-382 (1–1000 μM) did not markedly alter the ROS levels in aldh5a1−/− mice when compared to vehicle-treated aldh5a1−/− mice, although we observed a slight trend toward higher ROS in aldh5a1+/+ cells with NCS-382.
Figure 4. Effect of varying concentrations of NCS-382 on cellular parameters.
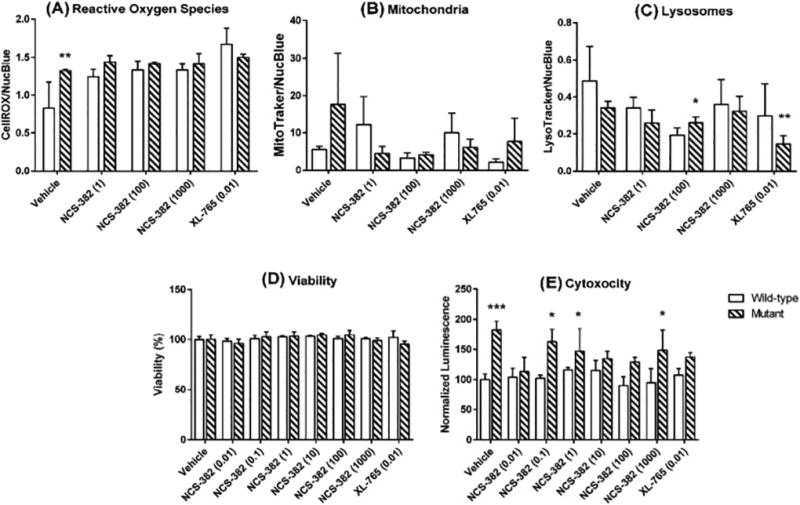
Legend: Reactive oxygen species (A); mitochondria number (B); lysosome number (C); cell viability (D); and cytotoxicity (necrosis; E). Open bars represent aldh5a1+/+ neuronal stem cells, while cross-hatched boxes represent aldh5a1−/− neuronal stem cells. Each bar graph denotes the mean ± SD of triplicate biological replicates (each replicated determined in duplicate; *p<0.05; **p<0.01; ***p<0.001). The data of Figs. 2A-C represent fluorescent measures that are corrected for nuclei staining. For cell viability and cytotoxicity (2D, E), counts and luminescent measures were normalized to vehicle-treated cells of the corresponding genotype. The x-axis in all instances represents vehicle, NCS-382 concentration, or the concentration of XL-765 (control; inhibitor of mTOR). All values on the x-axes are displayed in units of μM.
Since previous data documented that oxidative stress and organelle number in aldh5a1−/− mice were regulated via the mammalian target of rapamycin (mTOR; Vogel et al 2017), we employed the dual mTOR inhibitor, XL-765, as a control in NSCs. Employing XL-765 at 10 nM, we observed decreased mitochondrial and lysosomal numbers for aldh5a1−/− and aldh5a1+/+ NSCs in comparison to vehicle-treated cells of identical genotype. NCS-382 (1–1000 μM) did not significantly alter either mitochondrial or lysosomal number when compared to vehicle-treated cells for either genotype (Fig. 4B, C).
Effect of NCS-382 on cell viability and cytotoxicity
We next examined the extent of cell viability and cytotoxicity (necrosis) with increasing levels of NCS-382 (0.01–1000 μM) as a function of genotype in NSCs. Cell viability was normalized to vehicle control of each genotype. NCS-382 (0.01–1000 μM) had no adverse effects on cell viability, nor did XL-765 (0.01 μM), both relative to vehicle control (Fig. 4D). Cytotoxicity was examined as an additional measure of global cellular health. Overall, there was no significant effect on levels of cell necrosis (cytotoxicity) as a function of NCS-382 concentration (0.01–1000 μM), with similar outcomes for the dual mTOR inhibitor XL-765 (0.01 μM; Fig. 4E). Conversely, as a function of genotype, higher levels of cytotoxicity were observed in aldh5a1−/− cells in comparison to aldh5a1+/+ cells, across all dosages of NCS-382 and the single dose of XL-765. This reached significance at several, but not all, concentrations of NCS-382.
Effect of NCS-382 on mitochondrial function estimated as ATP levels and turnover, and superoxide production
We further examined mitochondrial function in NSCs via measurement of superoxide production, ATP, and ATP consumption rates. Superoxide represents a gauge of ROS that is generated in association with mitochondrial metabolism (Slade et al 2017). Superoxide levels were higher in aldh5a1−/− as compared to aldh5a1+/+ NSCs (Fig. 5A; two way ANOVA, p<0.05 with Tukey post hoc analysis). There was a clear dose-dependency effect for NCS-382 in aldh5a1+/+ NSCs that was not observed for aldh5a1−/− cells. There was no effect of NCS-382 (0.01–1000 μM) on superoxide production in aldh5a1−/− NSCs when contrasted with vehicle-treated cells of the same genotype (Fig. 5A).
Figure 5. Measures of mitochondrial function in NCS-382-treated neural stem cells (NSCs).

Legend: superoxide levels (A); initial ATP levels (B); and ATP consumption in aldh5a1+/+ (C) and aldh5a1−/− (D) NSCs. White bar graphs indicate aldh5a1+/+ and checkered (hatched) bar graphs aldh5a1−/− cells in A and B. For A and B, y-values represent relative fluorescent units (RFU) that have been normalized to vehicle-treated measurements. Conversely, x-axis values are varying concentration of NCS-382 (μM) or mTOR inhibitor (Torin 2 at 0.01 μM). For A and B, *p<0.05; **p<0.01; ***p<0.001. For C and D, each symbol denotes the mean ± SEM of triplicate biological replicates, each replicate determined in duplicate. For these time-course studies, ATP consumption was monitored employing luminescence (vehicle-corrected). Abbreviations: min, minutes. The time course of ATP decay is also displayed in Table 1 for both genotypes. Decay rates within genotype were not significantly different as a function of NCS-382 concentration; conversely, the mTOR inhibitor, XL-765, led to decreased levels of ATP in both genotypes at all time points which failed to reach significance (p=0.13).
Previous studies demonstrated that aldh5a1−/− mice exhibit larger and more abundant mitochondria than aldh5a1+/+ littermates (Lakhani et al 2014). As a surrogate measure for both mitochondrial function, as well as number, we next examined the concentration of ATP (Fig. 5B) and its rate of consumption rate (Fig. 5C-D) in NSCs as a function of NCS-382 concentration and genotype. As predicted, aldh5a1−/− NSCs produced significantly higher ATP concentrations as compared to aldh5a1+/+ NSCs (two-way ANOVA with Tukey posthoc, p=0.0002; Fig. 5B). NCS-382 treatment (0.01–1000 μM) had no effect on initial ATP levels for either genotype when compared to corresponding vehicle-treated cells. Conversely, the mTOR inhibitor Torin 2 (0.01 μM) significantly lowered the initial ATP levels in aldh5a1−/− cells, but not in aldh5a1+/+ cells (p < 0.05).
Rates of consumption of ATP as a function of treatment and genotype are depicted in Figs. 5C and DLevels of ATP were higher in aldh5a1−/− as compared to aldh5a1+/+ cells, consistent with the data of Fig. 5B. Nonetheless, the rate of decay of ATP levels was comparable between genotypes (p=ns; Table 1). No effect of NCS-382 was seen on the rate of decay, or temporal levels, of ATP with either genotype. XL-765 lowered ATP levels for both genotypes, , although this failed to achieve significance (p=0.13).
Table 1.
ATP depletion half-lives in NSCs treated with NCS-382.
| ATP half-life (minutes)[90% CI]
|
||
|---|---|---|
| NCS-382 Concentration (µM) | Wildtype | Mutant |
| Vehicle | 15 [11.2–21.9] | 12.8 [10.5–16.2] |
| 0.01 | 14.1 [9.64–24.8] | 15.3 [9.52–34.0] |
| 0.1 | 16.8 [15.0–19.2] | 17.0 [12.1–27.3] |
| 1 | 16.5 [12.4–23.9] | 17.1 [12.8–25.0] |
| 10 | 18.2 [15.8–21.5] | 15.8 [13.0–19.9] |
| 100 | 17.0 [13.7–22.1] | 16.1 [14.4–18.4] |
| 1000 | 17.0 [13.4–22.9] | 14.8 [11.4–20.6] |
Gene expression in NSCs as a function of genotype and NCS-382 treatment at 500 μM
To extend in vitro insights into the potential toxicological effects of NCS-382, we screened a panel of genes previously shown to be altered in expression levels in epileptic syndromes (Table 2). Of the 370 genes tested, only five were dysregulated > 4-fold in aldh5a1−/− NSCs when compared to normalized expression levels for aldh5a1+/+ cells (including Gabrb3, Il1rap, Ilk, Slc12a5, and Slc1a2; gene abbreviations are displayed on the x-axis and the role of each is defined in Table 2), and three other genes were > 2-fold dysregulated (Cyp2B10, Cyp39a1 and Slc12a2). We chose to evaluate a 7-day exposure instead of acute exposure to NCS-382 to insure sufficient time to induce alterations in transcriptional levels. NCS-382 (500 μM; 7 day treatment in culture) did not significantly exacerbate or normalize any of the dysregulated genes in aldh5a1−/− NSCs (Fig. 6).
Table 2.
Genes showing dysregulation in the presence of NCS-382 (0.5 mM) in NSCs
| Gene | Gene product | Function |
|---|---|---|
| Cyp2b10 | 1,4-Cineole 2-Exo-Monooxygenase | Synthesis of cholesterol, bile acids, steroids and other lipids. Xenobiotic metabolism. |
| Cyp39a1 | Oxysterol 7-Alpha-Hydroxylase | Synthesis of cholesterol, bile acids, steroids and other lipids. |
| Gabrb3 | GABAA Receptor Subunit Beta-3 | Ligand-gated ion channel responsible for mediating the inhibitory effects of GABA. |
| Il1rap | Interleukin-1 Receptor 3 | Induces synthesis of acute phase and proinflammatory proteins during infection, tissue damage, or stress. |
| Ilk | Integrin Linked Kinase | Regulates integrin-mediated signal transduction. Phosphorylates beta-1 and beta-3 integrin subunit on serine and threonine residues, but also AKT1 and GSK3B |
| Slc12a2 | Basolateral Na-K-Cl Symporter (NKCC1) | A membrane-bound channel that plays a major role in a variety of epithelial absorptive and secretory processes. |
| Slc12a5 | Neuronal K-Cl Cotransporter | Mediates electroneutral potassium-chloride cotransport in mature neurons and is required for neuronal Cl− homeostasis |
| Slc1a2 | Excitatory Amino Acid Transporter 2 | Glutamate transporter |
Figure 6. qRT-PCR gene array expression analysis showing minimal gene dysregulation in response to culture with NCS-382.

Treatment conditions for cells included NCS-382 at 0.5 mM for 7 days. Aldh5a1+/+ cells that are vehicle-treated are not shown, with those data set to the normal reference value of 1.0. The broken line indicates the 4-fold expression cutoff, of which approximately 5 genes met this criteria. The cutoff of 4-fold is that suggested by the manufacturer of the microarray plate (BioRad; Bustin et al 2009), and employed in consideration of the signal to noise ratio. Other genes (Cyp2b10, Cyp39a1 and Slc12a2) were > 2-fold dysregulated. Gene expression analysis was run on pooled triplicate biological replicates.
Discussion
In the current report, we have examined toxicological as well as transport characteristics of GHB and NCS-382, and the combinatorial effects of the latter two. This is relevant to the future consideration of NCS-382 in patients with SSADHD. We found the uptake characteristics of both NCS-382 and GHB to be linear up to 20 and 40 minutes, respectively (Figs. 2A, B), indicative of active uptake and not passive permeability. Indeed, the permeability of GHB at ~500 μM is unexpectedly high in the MDCK system given that GHB is a polar carboxylic acid species. In the present study, our findings suggest that GHB is not blocking NCS-382 uptake, but that NCS-382 is indeed inhibiting GHB uptake. Our results with GHB were consistent with studies previously reported in intestinal Caco-2 cells, in which GHB permeability in the apical to basolateral direction was higher than that for the basolateral to apical direction (Lam et al 2010). At the current time, however, we have not attempted assays to definitely implicate the monocarboxylate transporter subtype 1 (MCT1), since MDCK cells express other transporters, such as BGT 1 (the betaine-GABA transporter) and CreaT (the creatine transporter). The key point in our studies is that NCS-382 was capable of inhibiting GHB uptake in MDCK kidney cells under optimized culture conditions. Although is difficult to say definitively at this time, it would appear that NCS-382 demonstrates a greater affinity, or that it is not even a substrate but inhibitor, for GHB transport in kidney cells.
Based upon the findings that NCS-382 could block GHB transport in MDCK cells (Fig. 2D), we predicted a significant effect on the brain penetration characteristics of GHB in aldh5a1−/− mice, where GHB accrues to supraphysiological amounts (Vogel et al 2017b). Unexpectedly, we found no effect on the ratio of brain to liver GHB ratio in mice treated chronically for 7 days with NCS-382 (Fig. 3), which initially suggested that NCS-382 is not having the same effect at the blood-brain barrier transport as observed in MDCK cells. On the other hand, the short t1/2 of NCS-382 (less than 1 hour; Ainslie et al 2016) may represent a confounding effect in the intact animal, and measurement at a single time point may have been insufficient in these animals. A more sustained plasma concentration of NCS-382 might have been achieved using continuous-release osmotic minipumps (Vogel et al 2017c). Unfortunately, minipumps cannot be implanted into aldh5a1−/− mice due to their small body size and overall fragility. The in vivo plasma protein binding and brain tissue binding of NCS-382 may also contribute to the lack of observed effect. As well, the resident t1/2 of NCS-382 in brain is longer than that of the periphery (Ainslie et al 2016), such that excess NCS-382 not interacting with GHB receptors in the CNS may have been available to impede efflux/influx of GHB across the blood brain barrier. Thus, it was important to have both in vitro and in vivo studies, as the in vivo animal studies may have been misleading in isolation.
Having evaluated the processes by which NCS-382 is transported, we turned our attention towards evaluating the effects it may have in the CNS. Using various cellular parameters in which to evaluate toxicity, we found that doses of NCS-382 up to 1 mM were relatively devoid of adverse outcomes in NSCs, including cells of both aldh5a1+/+ and aldh5a1−/− subjects (Fig. 4). In a previous study, single-dosing of 300 mg/kg NCS-382 revealed a sera Cmax of ~ 400 μM, while a dose of 500 mg/kg provided a sera Cmax of ~ 450 μM. We chose the lower dose for our in vivo study in the current report because there was not a significant gain with the higher dose in relation to Cmax. We chose to approximately double this Cmax concentration in our in vitro studies, at up 1000 μM in cell toxicity studies and 500 μM in gene expression analyses.
Overall, increasing doses of NCS-382 slightly elevated ROS in aldh5a1+/+ cells but were without effect in aldh5a1−/− cells (Fig. 4A). As well, there were no convincing adverse trends for NCS-382 for mitochondrial and lysosomal numbers, and no effect in either genotype for cell viability with high-dose NCS-382 (Figs. 4B, C and D). On the other hand, 100 μM NCS-382 did result in a significant decrease in lysosome number in aldh5a1+/+ cells, but across the NCS-382 concentration range there was no clear dose response suggesting perhaps that the 100 μM data point was a spurious finding. In terms of overall cytotoxicity, the trend was for higher levels in aldh5a1−/− cells (Fig. 4E), but again there was no clear trend as a function of NCS-382 dose response in NSCs of either genotype.
We extended our findings to more closely examine mitochondrial activities as a function differing concentrations of NCS-382 in NSCs. To achieve this, we examined superoxide levels, as well as ATP levels and the rate of decay of the latter. As shown in Fig. 5A, there was a clear dose-response for increasing NCS-382 in aldh5a1+/+ cells, but no effect on aldh5a1−/− cells. The difference between genotypes for superoxide production at 100 and 1000 μM NCS-382 was significant (Fig. 5A). Nonetheless, it is worthwhile noting that NCS-382 had no effect on the superoxide level in aldh5a1−/− cells at up to 1 mM.
To explore the effects of NCS-382 at the molecular level, we focused attention on gene expression employing a previously examined panel of genes with documented roles in epileptic syndromes (Vogel et al 2017). The small number of genes dysregulated in association with high-dose culture in NCS-382 (0.5 mM) suggested that the impacts of this drug at the molecular level were minimal (Fig. 6). We found that gene dysregulation in this model included predominantly chloride transporters, excitatory or inhibitory receptors or transporters, signaling molecules and enzymes critical to major cellular biosynthetic pathways (Table 2). It is interesting to speculate that all of these may well fit with the phenotype that is responsive to mTOR and mTOR inhibitors, but further work is required to support this concept.
In conclusion, the current report provides evidence that NCS-382, at doses likely to be above those predicted to be clinically achieved, shows minimal toxicity in a neuronal stem cell model of SSADHD, while showing evidence of active transport parameters. These new findings add to the development of NCS-382 as a treatment consideration for SSADHD.
Highlights.
NCS-382 pharmacotoxicity was evaluated in SSADH-deficient neural stem cells
NCS-382 is actively transported and inhibits GHB transport in epithelial MDCK cells
NCS-382 showed minimal toxicity in parameters of cellular oxidative stress
NCS-382 minimally impacted cell organelle number, viability, and gene expression
NCS-382 holds promise for treating SSADH deficiency, a disorder of GABA meabolism
Acknowledgments
Supported by NIH R41 NS98856. The ongoing support of the SSADH Association is gratefully acknowledged.
Footnotes
Publisher's Disclaimer: This is a PDF file of an unedited manuscript that has been accepted for publication. As a service to our customers we are providing this early version of the manuscript. The manuscript will undergo copyediting, typesetting, and review of the resulting proof before it is published in its final citable form. Please note that during the production process errors may be discovered which could affect the content, and all legal disclaimers that apply to the journal pertain.
References
- Absalom N, Eghorn LF, Villumsen IS, Karim N, Bay T, Olsen JV, Knudsen GM, Bräuner-Osborne H, Frølund B, Clausen RP, Chebib M, Wellendorph P. α4βδ GABA(A) receptors are high-affinity targets for γ-hydroxybutyric acid (GHB) Proc Natl Acad Sci U S A. 2012;109:13404–9. doi: 10.1073/pnas.1204376109. [DOI] [PMC free article] [PubMed] [Google Scholar]
- Ainslie GR, Gibson KM, Vogel KR. A pharmacokinetic evaluation and metabolite identification of the GHB receptor antagonist NCS-382 in mouse informs novel therapeutic strategies for the treatment of GHB intoxication. Pharmacol Res Perspect. 2016;4(6):e00265. doi: 10.1002/prp2.265. [DOI] [PMC free article] [PubMed] [Google Scholar]
- Bay T, Eghorn LF, Klein AB, Wellendorph P. GHB receptor targets in the CNS: focus on high-affinity binding sites. Biochem Pharmacol. 2014;87:220–8. doi: 10.1016/j.bcp.2013.10.028. [DOI] [PubMed] [Google Scholar]
- Bustin SA. Why the need for qPCR publication guidelines?--The case for MIQE. Methods. 2010;50:217–26. doi: 10.1016/j.ymeth.2009.12.006. [DOI] [PubMed] [Google Scholar]
- Carai MA, Agabio R, Lobina C, Reali R, Vacca G, Colombo G, Gessa GL. GABA(B)-receptor mediation of the inhibitory effect of gamma-hydroxybutyric acid on intestinal motility in mice. Life Sci. 2002;70:3059–67. doi: 10.1016/s0024-3205(02)01553-9. [DOI] [PubMed] [Google Scholar]
- Chambliss KL, Zhang YA, Rossier E, Vollmer B, Gibson KM. Enzymatic and immunologic identification of succinic semialdehyde dehydrogenase in rat and human neural and nonneural tissues. J Neurochem. 1995;65:851–5. doi: 10.1046/j.1471-4159.1995.65020851.x. [DOI] [PubMed] [Google Scholar]
- Dave RA, Morris ME. Semi-mechanistic kidney model incorporating physiologically-relevant fluid reabsorption and transporter-mediated renal reabsorption: pharmacokinetics of γ-hydroxybutyric acid and L-lactate in rats. J Pharmacokinet Pharmacodyn. 2015;42:497–513. doi: 10.1007/s10928-015-9441-1. [DOI] [PMC free article] [PubMed] [Google Scholar]
- Froestl W, Gallagher M, Jenkins H, Madrid A, Melcher T, Teichman S, Mondadori CG, Pearlman R. SGS742: the first GABA(B) receptor antagonist in clinical trials. Biochem Pharmacol. 2004;68:1479–87. doi: 10.1016/j.bcp.2004.07.030. [DOI] [PubMed] [Google Scholar]
- Gibson KM, Aramaki S, Sweetman L, Nyhan WL, DeVivo DC, Hodson AK, Jakobs C. Stable isotope dilution analysis of 4-hydroxybutyric acid: an accurate method for quantification in physiological fluids and the prenatal diagnosis of 4-hydroxybutyric aciduria. Biomed Environ Mass Spectrom. 1990;19:89–93. doi: 10.1002/bms.1200190207. [DOI] [PubMed] [Google Scholar]
- Gobaille S, Schleef C, Hechler V, Viry S, Aunis D, Maitre M. Gamma-hydroxybutyrate increases tryptophan availability and potentiates serotonin turnover in rat brain. Life Sci. 2002. 2002;70:2101–12. doi: 10.1016/s0024-3205(01)01526-0. [DOI] [PubMed] [Google Scholar]
- Gupta M, Greven R, Jansen EE, Jakobs C, Hogema BM, Froestl W, Snead OC, Bartels H, Grompe M, Gibson KM. Therapeutic intervention in mice deficient for succinate semialdehyde dehydrogenase (gamma-hydroxybutyric aciduria) J Pharmacol Exp Ther. 2002;302:180–7. doi: 10.1124/jpet.302.1.180. [DOI] [PubMed] [Google Scholar]
- Hogema BM, Gupta M, Senephansiri H, Burlingame TG, Taylor M, Jakobs C, Schutgens RB, Froestl W, Snead OC, Diaz-Arrastia R, Bottiglieri T, Grompe M, Gibson KM. Pharmacologic rescue of lethal seizures in mice deficient in succinate semialdehyde dehydrogenase. Nat Genet. 2001;29:212–6. doi: 10.1038/ng727. [DOI] [PubMed] [Google Scholar]
- Kaupmann K, Cryan JF, Wellendorph P, Mombereau C, Sansig G, Klebs K, Schmutz M, Froestl W, van der Putten H, Mosbacher J, Bräuner-Osborne H, Waldmeier P, Bettler B. Specific gamma-hydroxybutyrate-binding sites but loss of pharmacological effects of gamma-hydroxybutyrate in GABA(B)(1)-deficient mice. Eur J Neurosci. 2003;18:2722–30. doi: 10.1111/j.1460-9568.2003.03013.x. [DOI] [PubMed] [Google Scholar]
- Kilb W. Development of the GABAergic system from birth to adolescence. Neuroscientist. 2012;18:613–30. doi: 10.1177/1073858411422114. [DOI] [PubMed] [Google Scholar]
- Klein AB, Bay T, Villumsen IS, Falk-Petersen CB, Marek A, Frølund B, Clausen RP, Hansen HD, Knudsen GM, Wellendorph P. Autoradiographic imaging and quantification of the high-affinity GHB binding sites in rodent brain using 3H-HOCPCA. Neurochem Int. 2016;100:138–145. doi: 10.1016/j.neuint.2016.09.002. [DOI] [PubMed] [Google Scholar]
- Koenig MK, Hodgeman R, Riviello JJ, Chung W, Bain J, Chiriboga CA, Ichikawa K, Osaka H, Tsuji M, Gibson KM, Bonnen PE, Pearl PL. Phenotype of GABA-transaminase deficiency. Neurology. 2017;88:1919–1924. doi: 10.1212/WNL.0000000000003936. [DOI] [PMC free article] [PubMed] [Google Scholar]
- Lakhani R, Vogel KR, Till A, Liu J, Burnett SF, Gibson KM, Subramani S. Defects in GABA metabolism affect selective autophagy pathways and are alleviated by mTOR inhibition. EMBO Mol Med. 2014;6:551–66. doi: 10.1002/emmm.201303356. [DOI] [PMC free article] [PubMed] [Google Scholar]
- Lam WK, Felmlee MA, Morris ME. Monocarboxylate transporter-mediated transport of gamma-hydroxybutyric acid in human intestinal Caco-2 cells. Drug Metab Dispos. 2010;38:441–7. doi: 10.1124/dmd.109.030775. [DOI] [PMC free article] [PubMed] [Google Scholar]
- Maitre M, Klein C, Mensah-Nyagan AG. Mechanisms for the Specific Properties of γ-Hydroxybutyrate in Brain. Med Res Rev. 2016a;36:363–88. doi: 10.1002/med.21382. [DOI] [PubMed] [Google Scholar]
- Maitre M, Klein C, Mensah-Nyagan AG. A proposed preventive role for Gamma-hydroxybutyrate (Xyrem(R)) in Alzheimer's disease. Alzheimers Res Ther. 2016b;8:37. doi: 10.1186/s13195-016-0205-y. [DOI] [PMC free article] [PubMed] [Google Scholar]
- Malaspina P, Roullet JB, Pearl PL, Ainslie GR, Vogel KR, Gibson KM. Succinic semialdehyde dehydrogenase deficiency (SSADHD): Pathophysiological complexity and multifactorial trait associations in a rare monogenic disorder of GABA metabolism. Neurochem Int. 2016;99:72–84. doi: 10.1016/j.neuint.2016.06.009. [DOI] [PMC free article] [PubMed] [Google Scholar]
- Molnár T, Barabás P, Héja L, Fekete EK, Lasztóczi B, Szabó P, Nyitrai G, Simon-Trompler E, Hajós F, Palkovits M, Kardos J. gamma-Hydroxybutyrate binds to the synaptic site recognizing succinate monocarboxylate: a new hypothesis on astrocyte-neuron interaction via the protonation of succinate. J Neurosci Res. 2008;86:1566–76. doi: 10.1002/jnr.21608. [DOI] [PubMed] [Google Scholar]
- Nava F, Carta G, Bortolato M, Gessa GL. gamma-Hydroxybutyric acid and baclofen decrease extracellular acetylcholine levels in the hippocampus via GABA(B) receptors. Eur J Pharmacol. 2001;430:261–3. doi: 10.1016/s0014-2999(01)01163-3. [DOI] [PubMed] [Google Scholar]
- Nielsen CU, Rasmussen RN, Mo J, Noori B, Lagunas C, Holm R, Nøhr MK. A Transporter of Ibuprofen is Upregulated in MDCK I Cells under Hyperosmotic Culture Conditions. Mol Pharm. 2016;13:3119–29. doi: 10.1021/acs.molpharmaceut.6b00330. [DOI] [PubMed] [Google Scholar]
- Oltra-Noguera D, Mangas-Sanjuan V, Centelles-Sangüesa A, Gonzalez-Garcia I, Sanchez-Castaño G, Gonzalez-Alvarez M, Casabo VG, Merino V, Gonzalez-Alvarez I, Bermejo M. Variability of permeability estimation from different protocols of subculture and transport experiments in cell monolayers. J Pharmacol Toxicol Methods. 2015;71:21–32. doi: 10.1016/j.vascn.2014.11.004. [DOI] [PubMed] [Google Scholar]
- Pearl PL, Gibson KM, Cortez MA, Wu Y, Carter Snead OY, 3rd, Knerr I, Forester K, Pettiford JM, Jakobs C, Theodore WH. Succinic semialdehyde dehydrogenase deficiency: lessons from mice and men. J Inherit Metab Dis. 2009;32:343–52. doi: 10.1007/s10545-009-1034-y. [DOI] [PMC free article] [PubMed] [Google Scholar]
- Poggioli R, Vitale G, Colombo G, Ottani A, Bertolini A. Gamma-hydroxybutyrate increases gastric emptying in rats. Life Sci. 1999;64:2149–54. doi: 10.1016/s0024-3205(99)00163-0. [DOI] [PubMed] [Google Scholar]
- Slade L, Chalker J, Kuksal N, Young A, Gardiner D, Mailloux RJ. Examination of the superoxide/hydrogen peroxide forming and quenching potential of mouse liver mitochondria. Biochim Biophys Acta. 2017;1861:1960–1969. doi: 10.1016/j.bbagen.2017.05.010. [DOI] [PubMed] [Google Scholar]
- Thiesen L, Kehler J, Clausen RP, Frølund B, Bundgaard C, Wellendorph P. In vitro and in vivo evidence for active brain uptake of the GHB analog HOCPCA by the monocarboxylate transporter subtype 1. J Pharmacol Exp Ther. 2015;354:166–74. doi: 10.1124/jpet.115.224543. [DOI] [PubMed] [Google Scholar]
- Vijay N, Morse BL, Morris ME. A Novel Monocarboxylate Transporter Inhibitor as a Potential Treatment Strategy for γ-Hydroxybutyric Acid Overdose. Pharm Res. 2015;32:1894–906. doi: 10.1007/s11095-014-1583-0. [DOI] [PMC free article] [PubMed] [Google Scholar]
- Vogel KR, Ainslie GR, Gibson KM. mTOR inhibitors rescue premature lethality and attenuate dysregulation of GABAergic/glutamatergic transcription in murine succinate semialdehyde dehydrogenase deficiency (SSADHD), a disorder of GABA metabolism. J Inherit Metab Dis. 2016;39:877–886. doi: 10.1007/s10545-016-9959-4. [DOI] [PMC free article] [PubMed] [Google Scholar]
- Vogel KR, Ainslie GR, Roullet JB, McConnell A, Gibson KM. In vitro toxicological evaluation of NCS-382, a high-affinity antagonist of γ-hydroxybutyrate (GHB) binding. Toxicol In Vitro. 2017;40:196–202. doi: 10.1016/j.tiv.2017.01.013. [DOI] [PubMed] [Google Scholar]
- Vogel KR, Ainslie GR, Jansen EE, Salomons GS, Gibson KM. Therapeutic relevance of mTOR inhibition in murine succinate semialdehyde dehydrogenase deficiency (SSADHD), a disorder of GABA metabolism. Biochim Biophys Acta. 2017b;1863:33–42. doi: 10.1016/j.bbadis.2016.10.009. [DOI] [PMC free article] [PubMed] [Google Scholar]
- Vogel KR, Ainslie GR, Schmidt MA, Wisor JP, Gibson KM. mTOR inhibition mitigates molecular and biochemical alterations of vigabatrin-induced visual field toxicity in mice. Pediatr Neurol. 2017c;66:44–52. doi: 10.1016/j.pediatrneurol.2016.09.016. [DOI] [PMC free article] [PubMed] [Google Scholar]