

Abstract
Background/objectives
Muscle mass is a key determinant of nutritional status and associated with outcomes in several patient groups. Computed tomography (CT) analysis is increasingly used to assess skeletal muscle area (SMA), skeletal muscle index (SMI) and muscle radiation attenuation (MRA). However, interpretation of these muscle parameters is difficult since values in a healthy population are lacking. The aim of this study was to provide sex specific percentiles for SMA, SMA and MRA in a healthy Caucasian population and to examine the association with age and BMI in order to define age- and BMI specific percentiles.
Subjects/methods
In this retrospective cross-sectional study CT scans of potential kidney donors were used to assess SMA, SMI and MRA at the level of the third lumbar vertebra. Sex specific distributions were described and, based on the association between age/BMI and muscle parameters, age, and BMI specific predicted percentiles were computed. The 5th percentile was considered as cut-off.
Results
CT scans of 420 Individuals were included (age range 20–82 years and BMI range 17.5–40.7 kg/m2). Sex specific cut-offs of SMA, SMI and MRA were 134.0 cm2, 41.6 cm2/m2 and 29.3 HU in men and 89.2 cm2, 32.0 cm2/m2 and 22.0 HU in women, respectively. Correlations were negative between age and all three muscle parameters, positive between BMI and SMA/SMI and negative between BMI and MRA, resulting in age- and BMI specific percentiles.
Conclusions
This study provides sex specific percentiles for SMA, SMI, and MRA. In addition, age- and BMI specific percentiles have been established.
Introduction
Muscle mass is a key determinant of nutritional status [1] and loss of muscle mass characterizes the malnutrition syndromes cachexia (disease related loss of muscle mass) and sarcopenia (age related low muscle mass and function) [2–4]. Muscle mass can be assessed with different body composition modalities. These modalities include bioelectrical impedance analysis, dual-energy X-ray absorptiometry (DXA) and computed tomography (CT) scan [5]. The latter modality is increasingly used in research to evaluate muscle mass [6], using a single slice at the level of the third lumbar vertebra (L3). Cross-sectional skeletal muscle area (SMA, cm2) at this level is highly correlated with total body skeletal muscle mass [7, 8]. Adjustment of SMA for height2 results in skeletal muscle index (SMI, cm2/m2), a measure for relative muscle mass [9]. An advantage of CT analysis over bioelectrical impedance analysis and DXA is the possibility to differentiate between lean mass components like organs and muscle. In addition, changes in muscle mass and composition which are undetectable using other modalities, can be detected [5, 10–12]. Furthermore, it provides the ability to determine muscle radiation attenuation (MRA, Hounsfield Units (HU)), a measure of muscle quality which is inversely related to muscle fat content [13]. Another advantage is that abdominal CT scans are conducted as part of routine care in several patient populations. In these patient populations this method can be used for muscle analysis without additional burden to the patient [5].
Recent studies have used CT analysis to evaluate muscle mass in different patient groups, for example in intensive care patients, cancer patients and patients undergoing surgery [14–19]. Most of these studies show that a “low” muscle mass (either SMA or SMI) is associated with worse outcomes compared to patients with a “normal” muscle mass. Whereas some of these studies have only investigated the linear association between muscle mass and clinical outcomes [18, 19], other studies have created cut-off points, distinguishing between “low” and “normal” muscle mass. In many studies, cut-off values for a “low” muscle mass were based on optimal stratification for survival [14, 16, 17, 20], resulting in different cut-off points between studies and patient populations. Regarding MRA, the association with survival has been analyzed with MRA as a continuous variable [19, 21] or as two groups [18, 21]. One study defined body mass index (BMI)-specific MRA cut-off values associated with survival in cancer patients [20].
Interpretation of the muscle parameters SMA, SMI, and MRA is difficult since reference values in a healthy population are lacking [22]. Moreover, these muscle parameters are likely to be associated with sex, age [4, 23–25], BMI [20, 24, 26] and ethnicity [13, 27–29]. These characteristics may have to be taken into account while interpreting muscle parameters. Therefore, the aim of this study is to provide sex specific percentiles for SMA, SMI, and MRA in a Caucasian population, measured by CT analysis at the L3 level, as well as examine the association with age and BMI in order to define age and BMI specific predicted percentiles.
Methods
This multicenter retrospective cross-sectional study was conducted in two university hospitals in Amsterdam, the Netherlands (VU University Medical Center (VUmc) and Academic Medical Center (AMC)). All data have been acquired as part of standard practice. The Medical Research Involving Human Subjects Act does not apply to the study, as confirmed by the Medical Ethics Committee of the VUmc, and the study was conducted in accordance with the Declaration of Helsinki.
Study population
A database consisting of potential living kidney donors was used as a representation for a healthy population. All individuals were screened for potential living kidney donation between 2006 and 2014. Medical evaluation for potential kidney donors includes review of the medical history, physical examination, blood- and urine tests and medical imaging. Individuals were included in the study if (1) the individual was considered to be healthy, i.e., when an individual was medically approved as a kidney donor candidate (see Supplementary Table 1 for the exclusion criteria for kidney donor candidates) [30]; (2) the individual had a Caucasian background, and (3) a 120 kV non-contrast CT scan eligible for assessment of SMA was available. To define cut-off values for sarcopenia, only individuals aged 20–60 years old were included as representation of younger adults.
Individual characteristics, assessed as part of the kidney donor screening, were obtained from the medical record and include sex, age at the time of CT scan, ethnicity, current smoking, height, body weight, and comorbidity.
CT scan evaluation
CT scans were performed in individuals who were eligible for kidney donation based on first assessment by the nephrologist or specialized nurse. Scans were performed according to the local screening protocol of potential living kidney donors. For the current study, the non-contrast CT scan with the largest slice thickness (3–5 mm) was selected and when not available, the 1.5 mm reconstruction was selected. Other scanning parameters were as follows: 64-row CT scanner (Sensation 64, Siemens, Forchheim, Germany (VUmc) or CT Brilliance 64, Philips, Eindhoven, Netherlands (AMC)); rotation time 0.5 s; pitch value 0.8 (VUmc) or 0.992 (AMC); collimation 64 × 0.6 mm; effective mAs 70 (VUmc) or 125 (AMC); reconstruction algorithms were similar for all scans (kernel B30f (VUmc) and filter B (AMC)). Scanners were calibrated (tolerance ± 4.0 HU) every 3 months using air-water phantoms. All scans were made in supine position. The transverse image at the L3 level most clearly displaying both vertebral transverse processes was selected. The selected image had to be of sufficient quality for muscle analysis, meaning (1) no artefacts; (2) no cut-off of muscle, and (3) clear differentiation between muscle and surrounding tissue.
Muscle parameters
Muscle parameters were measured on the selected CT slice with SliceOmatic software V5.0 (Tomovision, Magog, Canada). Muscle was identified based on anatomical features and included the psoas, paraspinal and abdominal wall muscles. Analyses were performed according to the Quality Assurance and Training Manual Version 1.4 [31] using threshold values of −29 to + 150 HU for muscle tissue. An example of an analyzed CT slice is shown in Fig. 1, where analyzed muscle is delineated. The software program computed SMA (cm2) by summing cross-sectional muscle areas and multiplying by pixel surface area. SMI (cm2/m2) was calculated by correcting SMA for height: SMA (cm2)/height (m)2. MRA (HU) was determined by the application by averaging the attenuation rate of the selected pixels.
Fig. 1. Example of a CT slice at the level of the third lumbar vertebra on which muscle was analyzed.
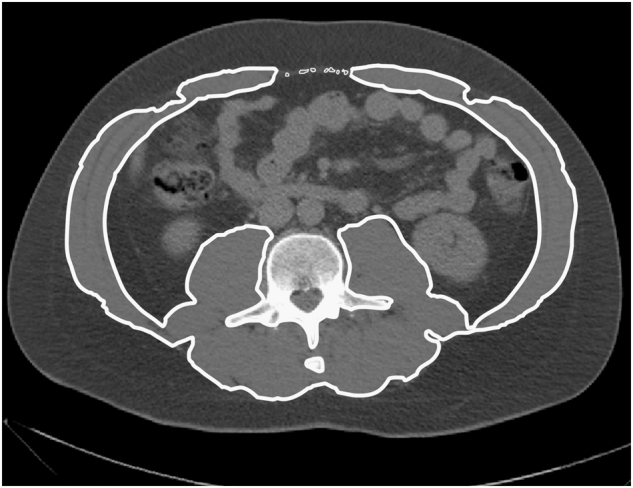
Of the selected muscle, both area and mean radiation attenuation can be computed, to determine skeletal muscle area (SMA) and the muscle radiation attenuation (MRA), respectively
Statistics
Subject characteristics were described separately for men and women, using percentages for categorical data and mean (standard deviation) or median (interquartile range) for respectively normally and not normally distributed continuous data. Percentiles (p5, p10, p25, p50, p75, p90, p95) were used to describe the distribution of SMA, SMI, and MRA. This was done for the total study population and for the individuals aged 20–60 years. A low SMA, SMI, and MRA was defined as a value below p5 [32, 33]. For the total study population, the correlation between age and skeletal muscle parameters and between BMI and skeletal muscle parameters was visualized with scatterplots and tested with linear regression analyses. Since both age and BMI were linearly related to all three skeletal muscle parameters, a multivariate regression analysis was performed. Interaction between age and BMI in predicting skeletal muscle parameters was tested and included in the analyses in case of significant interaction. For each of these parameters the 90% prediction interval was calculated based on linear regression, with the lower bound of the interval representing the predicted p5 value based on the correlation with age and BMI within the total study population. These predicted p5 values for SMI, SMA, and MRA were calculated for age by decade and for different BMI-groups (17–20, 20–25, 25–30, 30–35 kg/m2). In addition, a 80% prediction interval was calculated for the same subgroups to compute predicted values for p10 (Supplementary Table 2). If the number of individuals per age or BMI category stratified by gender was below 5, the predicted p5 values for these categories were not provided. Statistical analyses were performed using Statistical Package for the Social Sciences (SPSS, version 22.0. Armonk, NY). A p-value of <0.05 was considered statistically significant.
Results
Of the 692 individuals medically approved as a kidney donor, 420 were eligible for inclusion in this study based on personal and CT scan characteristics. Reasons for exclusion are shown in the study flowchart (Fig. 2).
Fig. 2.

Study flowchart showing the selection of eligible individuals with a CT scan eligible for muscle analysis
Study population
The study population consisted of 420 healthy individuals, of which 41% was male. The mean age in the total study population was 53 ± 11 (range from 20 till 82) years old and 300 individuals were aged 20–60 years. Mean BMI of the total study population was 25.7 ± 3.5 kg/m2 (range 17.5–40.7 kg/m2, Table 1).
Table 1.
Characteristics of the study population
| All subjects (n = 420) | Men (n = 174) | Women (n = 246) | |
|---|---|---|---|
| Age (years) | 53 ± 12 | 52 ± 12 | 54 ± 11 |
| Ethnicity* | |||
| Dutch | 395 (94.0%) | 163 (93.7%) | 232 (94.3%) |
| European non-Dutch | 11 (2.6%) | 5 (2.9%) | 6 (2.4%) |
| Non-European | 14 (3.3%) | 6 (3.4%) | 8 (3.3%) |
| Currently smoking (%) | 113 (26.7%) | 53 (30.5%) | 60 (24.4%) |
| Anthropometric characteristics | |||
| Height (cm) | 174 ± 10 | 182 ± 8 | 168 ± 6 |
| Weight (kg) | 78.9 ± 14.6 | 86.2 ± 12.3 | 72.0 ± 11.0 |
| Body mass index (kg/m2) | 25.7 ± 3.5 | 26.1 ± 3.3 | 25.5 ± 3.7 |
| Comorbidity for which use of maintenance medication† | |||
| Hypertension | 47 (11.2%) | 21 (12.1%) | 26 (10.6%) |
| Hyperlipidemia | 21 (5.0%) | 6 (3.4%) | 15 (6.1%) |
| Asthma/COPD ‡ /allergic rhinitis | 15 (3.6%) | 3 (1.7%) | 12 (4.9%) |
| Depression/anxiety disorder | 30 (7.1%) | 8 (4.6%) | 22 (8.9%) |
| Hypothyroidism | 17 (4.0%) | 3 (1.7%) | 14 (5.7%) |
| Other | 38 (9.0%) | 15 (8.6%) | 23 (9.3%) |
Characteristics are described using numbers (percentages) or mean ± standard deviation
*Non-European Caucasians include Turkish (5), Moroccan (5), Egyptian (1), Russian (1), Iranian (1), and Australian (1)
†The five most prevalent comorbidities are reported separately, “other” include other comorbidities for which use of systemic maintenance medication (except oral contraceptives)
‡ COPD chronic obstructive pulmonary disease
Skeletal muscle area (SMA)
Mean SMA was 173.6 ± 25.1 cm2 with a p5 of 134.0 cm2 in men and 113.4 ± 15.2 cm2 with a p5 of 89.2 cm2 in women. Other percentiles and percentiles for the subgroup of individuals aged 20–60 years are shown in Table 2. SMA was lower with increasing age (R 2 = 0.128, p < 0.001 in men and R 2 = 0.210, p < 0.001 in women). There was a significant positive correlation between BMI and SMA, which was stronger in men (R 2 = 0.195) than in women (R 2 = 0.058). Scatter plots of age and SMA and of BMI and SMA are included as supplementary material (Supplementary Fig. 1). In men, there was no interaction between age and BMI (p = 0.390), while in women there was an interaction (p = 0.001), indicating a stronger negative correlation between age and SMA with increasing BMI and a less strong correlation between BMI and SMA with increasing age. When age and BMI were included in the multivariate regression model (including the interaction term for women), explained variance (R 2) was 0.326 in men and 0.335 in women. Age and BMI specific lower limits of SMA are presented in Table 3.
Table 2.
Gender specific percentiles for skeletal muscle parameters for the total study population and for the subgroup aged 20–60 years
| SMA (cm2) | SMI (cm2/m2) | MRA (HU) | ||||
|---|---|---|---|---|---|---|
| Men | Women | Men | Women | Men | Women | |
| Aged 20–82 years | ||||||
| Mean ± SD | 173.6 ± 25.1 | 113.4 ± 15.2 | 52.8 ± 7.4 | 40.2 ± 5.2 | 38.4 ± 5.6 | 33.3 ± 6.8 |
| p5 | 134.0 | 89.2 | 41.6 | 32.0 | 29.3 | 22.0 |
| p10 | 141.6 | 93.0 | 44.7 | 32.8 | 31.7 | 24.9 |
| p25 | 154.2 | 102.8 | 47.7 | 36.4 | 34.9 | 28.5 |
| p50 | 171.4 | 112.5 | 52.0 | 40.0 | 38.4 | 33.3 |
| p75 | 190.1 | 124.0 | 58.0 | 43.3 | 42.3 | 38.8 |
| p90 | 208.6 | 132.0 | 63.3 | 46.9 | 45.5 | 41.7 |
| p95 | 216.9 | 138.9 | 67.1 | 48.9 | 48.0 | 43.6 |
| Aged 20–60 years | ||||||
| Mean ± SD | 179.3 ± 24.4 | 117.7 ± 14.4 | 53.9 ± 7.1 | 41.2 ± 5.0 | 39.6 ± 5.4 | 35.5 ± 6.0 |
| p5 | 138.2 | 96.2 | 43.1 | 32.7 | 30.9 | 24.8 |
| p10 | 146.3 | 99.8 | 45.9 | 34.5 | 32.8 | 27.7 |
| p25 | 163.6 | 107.6 | 48.4 | 37.9 | 35.8 | 31.2 |
| p50 | 178.9 | 117.9 | 53.2 | 40.9 | 39.4 | 36.2 |
| p75 | 196.9 | 127.0 | 58.8 | 44.1 | 43.3 | 40.6 |
| p90 | 212.2 | 135.4 | 64.8 | 47.7 | 46.4 | 42.8 |
| p95 | 219.3 | 142.3 | 67.4 | 49.6 | 48.1 | 44.6 |
Percentiles are based on a healthy population of 174 men and 246 women aged 20–82 years and 126 men and 174 women aged 20–60 years. p5 is considered as the cut-off between low and normal SMI, SMA, and MRA. SD standard deviation, SMI skeletal muscle index, SMA skeletal muscle area, MRA muscle radiation attenuation, HU hounsfield units
Table 3.
Predicted p5 values for skeletal muscle parameters for different age- and BMI categories in men and women*
| Men | Women | |||||||||
|---|---|---|---|---|---|---|---|---|---|---|
| BMI (kg/m2) | All BMIs | 17–20 | 20–25 | 25–30 | 30–35 | All BMIs | 17–20 | 20–25 | 25–30 | 30–35 |
| Age (years) | ||||||||||
| SMI (cm2/m2) | ||||||||||
| All ages | 32.8 | 37.9 | 44.0 | 50.1 | 28.6 | 31.3 | 34.5 | 37.5 | ||
| 20–29 | 44.9 | 37.4 | 42.5 | 48.7 | 54.8 | 36.7 | 28.5 | 33.7 | 39.6 | 45.1 |
| 30–39 | 43.4 | 35.9 | 41.0 | 47.2 | 53.3 | 35.3 | 28.7 | 32.8 | 37.6 | 42.2 |
| 40–49 | 41.8 | 34.3 | 39.4 | 45.6 | 51.7 | 33.9 | 28.8 | 31.8 | 35.6 | 39.2 |
| 50–59 | 40.2 | 32.7 | 37.7 | 43.9 | 50.0 | 32.3 | 28.7 | 30.9 | 33.5 | 36.1 |
| 60–69 | 38.6 | 31.0 | 36.1 | 42.3 | 48.4 | 30.7 | 28.5 | 29.9 | 31.4 | 32.9 |
| 70–79 | 36.9 | 29.3 | 34.4 | 40.6 | 46.7 | 28.9 | 28.2 | 28.8 | 29.3 | 29.5 |
| SMA (cm2) | ||||||||||
| All ages | 109.8 | 123.7 | 140.8 | 157.3 | 83.6 | 90.5 | 98.5 | 105.9 | ||
| 20–29 | 153.0 | 131.4 | 145.4 | 162.6 | 179.3 | 111.2 | 88.2 | 102.7 | 119.4 | 134.7 |
| 30–39 | 146.1 | 124.3 | 138.3 | 155.5 | 172.2 | 104.9 | 86.8 | 97.9 | 111.2 | 123.7 |
| 40–49 | 139.0 | 117.1 | 131.2 | 148.3 | 165.0 | 98.3 | 85.1 | 93.1 | 102.9 | 112.3 |
| 50–59 | 131.8 | 109.8 | 123.8 | 141.0 | 157.7 | 91.5 | 83.0 | 88.2 | 94.4 | 100.6 |
| 60–69 | 124.5 | 102.3 | 116.4 | 133.6 | 150.3 | 84.5 | 80.7 | 83.1 | 85.9 | 88.4 |
| 70–79 | 116.9 | 94.8 | 108.8 | 126.0 | 142.7 | 77.3 | 78.0 | 78.0 | 77.3 | 75.9 |
| MRA (HU) | ||||||||||
| All ages | 33.1 | 31.3 | 28.9 | 26.3 | 27.9 | 25.1 | 21.5 | 17.9 | ||
| 20–29 | 35.5 | 39.4 | 37.6 | 35.2 | 32.7 | 34.6 | 38.6 | 36.3 | 33.4 | 30.4 |
| 30–39 | 33.5 | 37.4 | 35.6 | 33.2 | 30.7 | 31.1 | 35.3 | 33.0 | 30.1 | 27.1 |
| 40–49 | 31.4 | 35.4 | 33.6 | 31.2 | 28.7 | 27.5 | 31.9 | 29.7 | 26.8 | 23.8 |
| 50–59 | 29.4 | 33.3 | 31.5 | 29.1 | 26.7 | 23.9 | 28.6 | 26.3 | 23.4 | 20.4 |
| 60–69 | 27.3 | 31.2 | 29.4 | 27.0 | 24.6 | 20.2 | 25.2 | 22.9 | 20.0 | 17.1 |
| 70–79 | 25.1 | 29.1 | 27.3 | 24.9 | 22.5 | 16.6 | 21.7 | 19.5 | 16.6 | 13.7 |
SMI skeletal muscle index, SMA skeletal muscle area, MRA muscle radiation attenuation, HU hounsfield units. BMI body mass index
Predicted p5 values for the age and BMI categories are based on a regression equation, derived from 174 men and 246 women. For each category, the middle value within the category range is used, for instance values for the age category 50–59 years and BMI category 30–35 kg/m2 are predicted values of age 55 years and BMI 32.5 kg/m2. In women, the regression equation for SMI and SMA included an interaction term for age and BMI, because of interaction between these variables in predicting SMI and SMA
*Predicted p10 values are provided as supplementary table (Supplementary Table 2)
Skeletal muscle index (SMI)
Mean SMI was 52.8 ± 7.4 cm2/m2 in men and 40.2 ± 5.2 cm2/m2 in women, with a p5 of 41.6 cm2/m2 and 32.0 cm2/m2, respectively (Table 2). The association between age and SMI and between BMI and SMI is shown in Fig. 3. Both were linearly associated in men and in women. There was a negative linear correlation between age and SMI (explained variance: R 2 = 0.071, p < 0.001 in men and R 2 = 0.078, p < 0.001 in women) and a positive correlation between BMI and SMI (explained variance: R 2 = 0.295, p < 0.001 in men and R 2 = 0.112, p < 0.001 in women). There was no interaction between age and BMI in men (p = 0.655). In women, there was an interaction (p = 0.005) showing a stronger negative correlation between age and SMA with increasing BMI and a less strong correlation between BMI and SMA with increasing age, as was the case for SMA. Multivariate regression with age and BMI (including the interaction term for women) resulted in an explained variance (R 2) of SMI of 0.369 in men and 0.248 in women. Based on this model, lower limits (p5) of SMI by age- and BMI group were calculated (Table 3).
Fig. 3.

Association between age and SMI (upper scatter plots) and between BMI and SMI (lower scatter plots). All associations were significant (p<0.001). SMI skeletal muscle index, BMI body mass index
Muscle radiation attenuation (MRA)
MRA was higher in men (mean 38.4 ± 5.6 HU) than in women (mean 33.3 ± 6.8 HU). The p5 was 29.3 HU in men and 22.0 HU in women (Table 2). There was a negative correlation between age and MRA, which was stronger in women (R 2 = 0.366, p < 0.001) than in men (R 2 = 0.212, p < 0.001). BMI was also negatively correlated with MRA (R 2 = 0.082, p < 0.001 in men and R 2 = 0.156 p < 0.001 in women). Scatter plots of age and MRA and of BMI and MRA are shown in Supplementary Fig. 2. The was no interaction between age and BMI (p = 0.124 in men and p = 0.467 in women).The multivariate regression model with age and BMI had a R 2 of 0.291 in men and 0.468 in women for predicting MRA. Table 3 shows the age- and BMI specific lower limits.
Discussion and conclusion
This is the first study describing percentiles for muscle parameters measured by CT analysis at the L3 level in a healthy Caucasian population. When p5 is considered as the cut-off between low and normal, the sex specific cut-offs of SMA, SMI and MRA are 134.0 cm2, 41.6 cm2/m2, and 29.3 HU in men and 89.2 cm2, 32.0 cm2/m2 and 22.0 HU in women, respectively. For the diagnosis of sarcopenia, the SMI cut-off values in a healthy, younger population (20–60 years old) are recommended, which is 43.1 cm2/m2 in men and 32.7 cm2/m2 in women. Because both age and BMI are associated with skeletal muscle parameters, sex specific cut-off points for different age- and BMI categories are provided as well. The percentiles reported in this study facilitate interpretation of muscle parameters in disease and at older age.
Although reference values are lacking for a healthy Caucasian population, cut-offs in a healthy Asian population have recently been defined in a study of Hamaguchi et al. [34]. In this study, psoas muscle mass index was assessed by CT analysis at the L3 level. The association between psoas muscle mass index and SMI was analyzed in a subgroup and was found to be moderate (r = 0.682, p < 0.001). Psoas muscle mass index was 1.53-fold higher in men than in women and a continuous decline in psoas muscle mass index was seen in both men and women, with a 1.20-fold higher muscle index in individuals <50 years vs. ≥50 years. In our Caucasian population, SMI was 1.31-fold higher in men than in women and 1.08-fold higher in individuals < 50 years vs. ≥ 50 years. Our findings are in line with Hamaguchi’s findings and confirm a higher SMI in men compared to women, however the magnitude of the sex and age specific proportions is different, which may be due to ethnic specific differences [35] or differences in muscles analyzed (psoas muscle vs. allmuscles at the L3 level, respectively).
Another study describing SMI cut-offs was performed by Mourtzakis et al. Appendicular muscle index (kg/m2) was measured by DXA and SMI was assessed by CT analysis at the L3 level in 31 cancer patients. Based on the association between DXA and CT measurements, a regression equation was computed. This regression equation was used to generate SMI cut-offs from previously defined DXA-based cut-offs. The latter were defined as two standard deviation below the mean value for healthy, non-Hispanic white adults aged 18–40 years (appendicular muscle index of 7.26 kg/m2 in men and 5.45 kg/m2 in women) [9]. This resulted in a SMI cut-off of 55.4 cm2/m2 in men and 38.9 cm2/m2 in women [8]. In our study, the cut-off (p5) for low muscle mass within the same age range is 44.7 cm2/m2 in men and 33.0 cm2/m2 in women. These values are considerably lower than the cut-offs defined by Mourtzakis et al. This may be due to the fact that Mourtzakis et al. indirectly calculated cut-offs using a regression equation derived from a relatively small population, which induces a margin of error. In addition, the relationship between DXA derived appendicular muscle mass and CT derived SMI may differ between cancer patients and a healthy population and therefore the equation may not be extrapolated. Other factors that may contribute to differences in cut-offs of Mourtzakis et. al and our study are the fact that the DXA cut-offs were based on another population (Mexican vs. Caucasian) and in a different period (1986–1992 vs. 2006–2014), which might be related to a difference in lifestyle and physical activity [36].
In several studies, cut-off values for muscle parameters using CT analysis have been defined based on optimal stratification for mortality [14, 16, 17, 20]. The established cut-offs in our study facilitate comparison of muscle parameters in patient groups with muscle parameters in healthy individuals. For instance, Prado et al. defined cut-offs for lumbar SMI associated with mortality in obese (BMI ≥ 30 kg/m2) patients with a solid tumor (n = 250). The cut-off was 52.4 cm²/m² in men and 38.5 cm²/m² in women, with 15% of the patients having a SMI below this sex specific value [16]. The mortality based SMI cut-offs as defined by Prado et al. correspond to our predicted p5 in healthy men (Table 3) and p10 in healthy women (Supplementary Table 2) within the same BMI range. This implies that men with a solid tumor are at higher mortality risk when SMI is below the p5, while women are already at higher mortality risk when their muscle mass is below p10 of the healthy population. Also in other studies in which outcome based cut-offs have been defined, the comparison with healthy individuals would be interesting and makes it possible to assess the prevalence of low muscle parameters.
When using the percentiles reported in the current study, a few considerations should be taken into account. Because SMA is not adjusted for height2, this parameter should only be used when total body skeletal muscle mass is relevant, for instance as indicator for body reserves of protein[14]. For diagnosis of low skeletal muscle mass, SMA should be adjusted for height2 (SMI). Regarding the study population, it should be noted that all individuals were potential kidney donors who were screening extensively, thus the health status of the study population may be higher than the health status of the general population. For instance, individuals with diabetes mellitus are not represented within our study population. The absence of individuals with diabetes might have led to an overestimation of muscle parameters, since diabetes mellitus is associated with a lower muscle mass and a reduced MRA [13, 37, 38]. In addition, a BMI > 35 kg/m2 was an absolute contraindication for kidney donation. Therefore, the study population includes only 7 individuals with a BMI > 35 kg/m2 (who were accepted for donation after weight loss) and percentiles for this BMI category cannot reliably be extrapolated from this study population. Because muscle parameters may differ between ethnicities [13, 27–29], the percentiles are representative for the Caucasian population, but could probably not be extrapolated to other ethnicities. CT scans used for muscle measurements should preferably be non-contrast scans performed at 120 kV since these factors may influence measurement outcomes [39, 40]. Using other software programs than the software program used in the current study (SliceOmatic) may give slightly different results. However, SMA shows excellent intersoftware-agreement and thus results of studies using different software programs may reliably be compared. [41] More research is needed to define reference values based on larger study population with a broader BMI range, in other ethnic groups, as well as to determine the effect of technical parameters on measurement outcomes.
In conclusion, this study is the first to describe sex specific percentiles for the muscle parameters SMI, SMA, and MRA measured by CT analysis at the L3 level derived from a healthy population. Because both age and BMI were associated with muscle parameters, sex, age, and BMI-specific values have been established. These percentiles will facilitate interpretation of muscle parameters in disease.
Electronic supplementary material
Supplementary figure 1 – Association between age and SMA (upper scatter plots) and between BMI and SMA (lower scatter plots)
Supplementary figure 2 – Association between age and MRA (upper scatter plots) and between BMI and MRA (lower scatter plots)
Supplementary table 1 – Exclusion criteria for living kidney donation
Supplementary table 2 – Predicted p10 values for skeletal muscle parameters for different age- and BMI categories in men and women
Acknowledgements
AvdW, JL, MdvdS, SB, NW contributed to the study design, analyses and writing the article. SN and KP recruited the study population, contributed to data collection and to writing the article. The authors acknowledge everyone who has contributed to this project. We would especially like to thank dr. M.R. Meijerink, drs. P.F.C. Groot and dr. M. van de Wiel for their radiological, technical and statistical support, respectively.
Competing interests
The authors declare that they have no competing interests.
Footnotes
Electronic supplementary material
The online version of this article (10.1038/s41430-017-0034-5) contains supplementary material, which is available to authorized users.
References
- 1.Cederholm T, Bosaeus I, Barazzoni R, Bauer J, Van GA, Klek S, et al. Diagnostic criteria for malnutrition - An ESPEN Consensus Statement. Clin Nutr. 2015;34:335–40. doi: 10.1016/j.clnu.2015.03.001. [DOI] [PubMed] [Google Scholar]
- 2.Cruz-Jentoft AJ, Baeyens JP, Bauer JM, Boirie Y, Cederholm T, Landi F, et al. Sarcopenia: European consensus on definition and diagnosis: Report of the European Working Group on Sarcopenia in Older People. Age Ageing. 2010;39:412–23. doi: 10.1093/ageing/afq034. [DOI] [PMC free article] [PubMed] [Google Scholar]
- 3.Evans WJ, Morley JE, Argiles J, Bales C, Baracos V, Guttridge D, et al. Cachexia: a new definition. Clin Nutr. 2008;27:793–9. doi: 10.1016/j.clnu.2008.06.013. [DOI] [PubMed] [Google Scholar]
- 4.Barlett HL, Puhl SM, Hodgson JL, Buskirk ER. Fat-free mass in relation to stature: ratios of fat-free mass to height in children, adults, and elderly subjects. Am J Clin Nutr. 1991;53:1112–6. doi: 10.1093/ajcn/53.5.1112. [DOI] [PubMed] [Google Scholar]
- 5.Di Sebastiano KM, Mourtzakis M. A critical evaluation of body composition modalities used to assess adipose and skeletal muscle tissue in cancer. Appl Physiol Nutr Metab. 2012;37:811–21. doi: 10.1139/h2012-079. [DOI] [PubMed] [Google Scholar]
- 6.Prado CM, Birdsell LA, Baracos VE. The emerging role of computerized tomography in assessing cancer cachexia. Curr Opin Support Palliat Care. 2009;3:269–75. doi: 10.1097/SPC.0b013e328331124a. [DOI] [PubMed] [Google Scholar]
- 7.Shen W, Punyanitya M, Wang Z, Gallagher D, St-Onge MP, Albu J, et al. Total body skeletal muscle and adipose tissue volumes: estimation from a single abdominal cross-sectional image. J Appl Physiol. 2004;97:2333–8. doi: 10.1152/japplphysiol.00744.2004. [DOI] [PubMed] [Google Scholar]
- 8.Mourtzakis M, Prado CM, Lieffers JR, Reiman T, McCargar LJ, Baracos VE. A practical and precise approach to quantification of body composition in cancer patients using computed tomography images acquired during routine care. Appl Physiol Nutr Metab. 2008;33:997–1006. doi: 10.1139/H08-075. [DOI] [PubMed] [Google Scholar]
- 9.Baumgartner RN, Koehler KM, Gallagher D, Romero L, Heymsfield SB, Ross RR, et al. Epidemiology of sarcopenia among the elderly in New Mexico. Am J Epidemiol. 1998;147:755–63. doi: 10.1093/oxfordjournals.aje.a009520. [DOI] [PubMed] [Google Scholar]
- 10.Nelson ME, Fiatarone MA, Layne JE, Trice I, Economos CD, Fielding RA, et al. Analysis of body-composition techniques and models for detecting change in soft tissue with strength training. Am J Clin Nutr. 1996;63:678–86. doi: 10.1093/ajcn/63.5.678. [DOI] [PubMed] [Google Scholar]
- 11.Fiatarone MA, Marks EC, Ryan ND, Meredith CN, Lipsitz LA, Evans WJ. High-intensity strength training in nonagenarians. Effects on skeletal muscle. JAMA. 1990;263:3029–34. doi: 10.1001/jama.1990.03440220053029. [DOI] [PubMed] [Google Scholar]
- 12.MacDonald AJ, Greig CA, Baracos V. The advantages and limitations of cross-sectional body composition analysis. Curr Opin Support Palliat Care. 2011;5:342–9. doi: 10.1097/SPC.0b013e32834c49eb. [DOI] [PubMed] [Google Scholar]
- 13.Aubrey J, Esfandiari N, Baracos VE, Buteau FA, Frenette J, Putman CT, et al. Measurement of skeletal muscle radiation attenuation and basis of its biological variation. Acta Physiol. 2014;210:489–97. doi: 10.1111/apha.12224. [DOI] [PMC free article] [PubMed] [Google Scholar]
- 14.Weijs PJ, Looijaard WG, Dekker IM, Stapel SN, Girbes AR, Oudemans-van Straaten HM, et al. Low skeletal muscle area is a risk factor for mortality in mechanically ventilated critically ill patients. Crit Care. 2014;18:R12. doi: 10.1186/cc13189. [DOI] [PMC free article] [PubMed] [Google Scholar]
- 15.Prado CM, Baracos VE, McCargar LJ, Reiman T, Mourtzakis M, Tonkin K, et al. Sarcopenia as a determinant of chemotherapy toxicity and time to tumor progression in metastatic breast cancer patients receiving capecitabine treatment. Clin Cancer Res. 2009;15:2920–6. doi: 10.1158/1078-0432.CCR-08-2242. [DOI] [PubMed] [Google Scholar]
- 16.Prado CM, Lieffers JR, McCargar LJ, Reiman T, Sawyer MB, Martin L, et al. Prevalence and clinical implications of sarcopenic obesity in patients with solid tumours of the respiratory and gastrointestinal tracts: a population-based study. Lancet Oncol. 2008;9:629–35. doi: 10.1016/S1470-2045(08)70153-0. [DOI] [PubMed] [Google Scholar]
- 17.van Vledder MG, Levolger S, Ayez N, Verhoef C, Tran TC, Ijzermans JN. Body composition and outcome in patients undergoing resection of colorectal liver metastases. Br J Surg. 2012;99:550–7. doi: 10.1002/bjs.7823. [DOI] [PubMed] [Google Scholar]
- 18.Antoun S, Lanoy E, Iacovelli R, Albiges-Sauvin L, Loriot Y, Merad-Taoufik M, et al. Skeletal muscle density predicts prognosis in patients with metastatic renal cell carcinoma treated with targeted therapies. Cancer. 2013;119:3377–84. doi: 10.1002/cncr.28218. [DOI] [PubMed] [Google Scholar]
- 19.Sabel MS, Lee J, Cai S, Englesbe MJ, Holcombe S, Wang S. Sarcopenia as a prognostic factor among patients with stage III melanoma. Ann Surg Oncol. 2011;18:3579–85. doi: 10.1245/s10434-011-1976-9. [DOI] [PubMed] [Google Scholar]
- 20.Martin L, Birdsell L, Macdonald N, Reiman T, Clandinin MT, McCargar LJ, et al. Cancer cachexia in the age of obesity: skeletal muscle depletion is a powerful prognostic factor, independent of body mass index. J Clin Oncol. 2013;31:1539–47. doi: 10.1200/JCO.2012.45.2722. [DOI] [PubMed] [Google Scholar]
- 21.Kumar A, Moynagh MR, Multinu F, Cliby WA, McGree ME, Weaver AL, et al. Muscle composition measured by CT scan is a measurable predictor of overall survival in advanced ovarian cancer. Gynecol Oncol. 2016;142(2):311–6. doi: 10.1016/j.ygyno.2016.05.027. [DOI] [PubMed] [Google Scholar]
- 22.Cederholm T, Barazzoni R, Austin P, Ballmer P, Biolo G, Bischoff SC, et al. ESPEN guidelines on definitions and terminology of clinical nutrition. Clin Nutr. 2017;36:46–64. doi: 10.1016/j.clnu.2016.09.004. [DOI] [PubMed] [Google Scholar]
- 23.Janssen I, Heymsfield SB, Wang ZM, Ross R. Skeletal muscle mass and distribution in 468 men and women aged 18-88 yr. J Appl Physiol. 2000;89:81–8. doi: 10.1152/jappl.2000.89.1.81. [DOI] [PubMed] [Google Scholar]
- 24.Schutz Y, Kyle UU, Pichard C. Fat-free mass index and fat mass index percentiles in Caucasians aged 18-98 y. Int J Obes Relat Metab Disord. 2002;26:953–60. doi: 10.1038/sj.ijo.0802037. [DOI] [PubMed] [Google Scholar]
- 25.Coin A, Sergi G, Minicuci N, Giannini S, Barbiero E, Manzato E, et al. Fat-free mass and fat mass reference values by dual-energy X-ray absorptiometry (DEXA) in a 20-80 year-old Italian population. Clin Nutr. 2008;27:87–94. doi: 10.1016/j.clnu.2007.10.008. [DOI] [PubMed] [Google Scholar]
- 26.Bosy-Westphal A, Muller MJ. Identification of skeletal muscle mass depletion across age and BMI groups in health and disease--there is need for a unified definition. Int J Obes. 2015;39:379–86. doi: 10.1038/ijo.2014.161. [DOI] [PubMed] [Google Scholar]
- 27.Gallagher D, Visser M, De Meersman RE, Sepulveda D, Baumgartner RN, Pierson RN, et al. Appendicular skeletal muscle mass: effects of age, gender, and ethnicity. J Appl Physiol. 1997;83:229–39. doi: 10.1152/jappl.1997.83.1.229. [DOI] [PubMed] [Google Scholar]
- 28.Kazemi-Bajestani SM, Mazurak VC, Baracos V. Computed tomography-defined muscle and fat wasting are associated with cancer clinical outcomes. Semin Cell Dev Biol. 2016;54:2–10. doi: 10.1016/j.semcdb.2015.09.001. [DOI] [PubMed] [Google Scholar]
- 29.Newman AB, Haggerty CL, Goodpaster B, Harris T, Kritchevsky S, Nevitt M, et al. Strength and muscle quality in a well-functioning cohort of older adults: the Health, Aging and Body Composition Study. J Am Geriatr Soc. 2003;51:323–30. doi: 10.1046/j.1532-5415.2003.51105.x. [DOI] [PubMed] [Google Scholar]
- 30.Homan van der Heide JJ. Nederlandse Richtlijn Evaluatie van Potentiële Donoren voor Levende Donor Niertransplantatie (Dutch Guideline for Living Kidney Donation) 2008.
- 31.Baracos VE, Sawyer M, Beaumont C, Esfandiari N, Lieffers J, Murphy R. Quality Assurance and Training Manual - Body Composition Analysis Using Computed Tomography (CT) Imaging Version 1.4. 2014.
- 32.Geffre A, Friedrichs K, Harr K, Concordet D, Trumel C, Braun JP. Reference values: a review. Vet Clin Pathol. 2009;38:288–98. doi: 10.1111/j.1939-165X.2009.00179.x. [DOI] [PubMed] [Google Scholar]
- 33.Fearon K, Strasser F, Anker SD, Bosaeus I, Bruera E, Fainsinger RL, et al. Definition and classification of cancer cachexia: an international consensus. Lancet Oncol. 2011;12:489–95. doi: 10.1016/S1470-2045(10)70218-7. [DOI] [PubMed] [Google Scholar]
- 34.Hamaguchi Y, Kaido T, Okumura S, Kobayashi A, Hammad A, Tamai Y, et al. Proposal for new diagnostic criteria for low skeletal muscle mass based on computed tomography imaging in Asian adults. Nutrition. 2016;32(11-12):1200–5. doi: 10.1016/j.nut.2016.04.003. [DOI] [PubMed] [Google Scholar]
- 35.Chen LK, Liu LK, Woo J, Assantachai P, Auyeung TW, Bahyah KS, et al. Sarcopenia in Asia: consensus report of the Asian Working Group for Sarcopenia. J Am Med Dir Assoc. 2014;15:95–101. doi: 10.1016/j.jamda.2013.11.025. [DOI] [PubMed] [Google Scholar]
- 36.Church TS, Thomas DM, Tudor-Locke C, Katzmarzyk PT, Earnest CP, Rodarte RQ, et al. Trends over 5 decades in U.S. occupation-related physical activity and their associations with obesity. PLoS One. 2011;6:e19657. doi: 10.1371/journal.pone.0019657. [DOI] [PMC free article] [PubMed] [Google Scholar]
- 37.Park SW, Goodpaster BH, Lee JS, Kuller LH, Boudreau R, de Rekeneire N, et al. Excessive loss of skeletal muscle mass in older adults with type 2 diabetes. Diabetes Care. 2009;32:1993–7. doi: 10.2337/dc09-0264. [DOI] [PMC free article] [PubMed] [Google Scholar]
- 38.Larsen BA, Allison MA, Laughlin GA, Araneta MR, Barrett-Connor E, Wooten WJ, et al. The association between abdominal muscle and type II diabetes across weight categories in diverse post-menopausal women. J Clin Endocrinol Metab. 2015;100:E105–9. doi: 10.1210/jc.2014-2839. [DOI] [PMC free article] [PubMed] [Google Scholar]
- 39.van der Werf A, Dekker IM, Wierdsma NJ, de van der Schueren MAE, Langius JAE. Skeletal muscle analyses: agreement between non-contrast and contrast CT scan measurements of skeletal muscle area and mean attenuation. ESPEN2016 Abstract Book SUN-P128. [DOI] [PubMed]
- 40.Rollins KE, Awwad A, Macdonald IA, Fearon KC, Lobo DN. The impact of the choice of software package on cumputed tomography calculation of body composition variables. ESPEN2016 Abstract Book OR33.
- 41.van Vugt JL, Levolger S, Gharbharan A, Koek M, Niessen WJ, Burger JW, et al. A comparative study of software programmes for cross-sectional skeletal muscle and adipose tissue measurements on abdominal computed tomography scans of rectal cancer patients. J Cachexia Sarcopenia Muscle. 2017;8(2):285–297. doi: 10.1002/jcsm.12158. [DOI] [PMC free article] [PubMed] [Google Scholar]
Associated Data
This section collects any data citations, data availability statements, or supplementary materials included in this article.
Supplementary Materials
Supplementary figure 1 – Association between age and SMA (upper scatter plots) and between BMI and SMA (lower scatter plots)
Supplementary figure 2 – Association between age and MRA (upper scatter plots) and between BMI and MRA (lower scatter plots)
Supplementary table 1 – Exclusion criteria for living kidney donation
Supplementary table 2 – Predicted p10 values for skeletal muscle parameters for different age- and BMI categories in men and women