

Abstract
Beclin-1 (BECN1) is an essential component of macroautophagy. This process is a highly conserved survival mechanism that recycles damaged cellular components or pathogens by encasing them in a bilayer vesicle that fuses with a lysosome to allow degradation of the vesicular contents. Mutations or altered expression profiles of BECN1 have been linked to various cancers and neurodegenerative diseases. Viruses, including HIV and herpes simplex virus 1 (HSV-1), are also known to specifically target BECN1 as a means of evading host defense mechanisms. Autophagy is regulated by the interaction between BECN1 and Bcl-2, a pro-survival protein in the apoptotic pathway that stabilizes the BECN1 homodimer. Disruption of the homodimer by phosphorylation or competitive binding promotes autophagy through an unknown mechanism. We report here the first recombinant synthesis (3–5 mg/L in an Escherichia coli culture) and characterization of full-length, human BECN1. Our analysis reveals that full-length BECN1 exists as a soluble homodimer (KD ~ 0.45 μM) that interacts with Bcl-2 (KD = 4.3 ± 1.2 μM) and binds to lipid membranes. Dimerization is proposed to be mediated by a coiled-coil region of BECN1. A construct lacking the C-terminal BARA domain but including the coiled-coil region exhibits a homodimer KD 3.5-fold weaker than that of full-length BECN1, indicating that both the BARA domain and the coiled-coil region of BECN1 contribute to dimer formation. Using site-directed mutagenesis, we show that residues at the C-terminus of the coiled-coil region previously shown to interact with the BARA domain play a key role in dimerization and mutations weaken the interface by ~5-fold.
Graphical abstract
Macroautophagy (hereafter called autophagy) is a highly conserved catabolic process in eukaryotes that maintains cellular homeostasis via lysosomal degradation.1 Assembly of the initial double-membrane autophagosome vesicle is guided by autophagy-related proteins that capture aggregated or degraded macromolecules, damaged organelles, and pathogens.2 Fusion of the autophagosome with a lysosome initiates degradation of the vesicle cargo. Autophagy has also been shown to play roles in inflammation, neurodegeneration, immunity, etc.3–7 Beclin-1 (BECN1) is a rate-limiting component of autophagy and a haplosufficient tumor suppressor that is essential for embryonic development.8 Moreover, this protein is a core component in two phosphatidylinositol-3-kinase (PI3K) complexes that are involved in either nucleation or maturation of the autophagosome.9
BECN1 is a 450-amino acid protein that is comprised of four structurally distinct regions (Figure 1A): (1) an intrinsically disordered region (IDR, residues 1–130) that contains a BH3 motif (residues 105-130),10 (2) a flexible helix domain (residues 141–171),11 (3) a coiled-coil (CC) domain (residues 175–264),12,13 and (4) a membrane binding β/α-repeated, autophagy-related (BARA) domain (residues 265–450).14 The previously reported evolutionarily conserved domain (ECD, residues 248–337) overlaps with the 17 C-terminal residues of the CC and N-terminal half of the BARA domains.15 Huang and co-workers crystallized a truncated form of the ECD/BARA domain of human BECN1 (residues 248–450), which contained a portion of the CC domain (residues 248–265), and showed that this protein exists as a single globular domain with trifold symmetry and no stand-alone structural features for the ECD component.14 A similar observation was made for the BARA domain of Atg6, the yeast homologue of BECN1.16 We therefore simplify the nomenclature of the ECD/BARA domain herein by referring to this region of BECN1 as only the BARA domain.16,17
Figure 1.
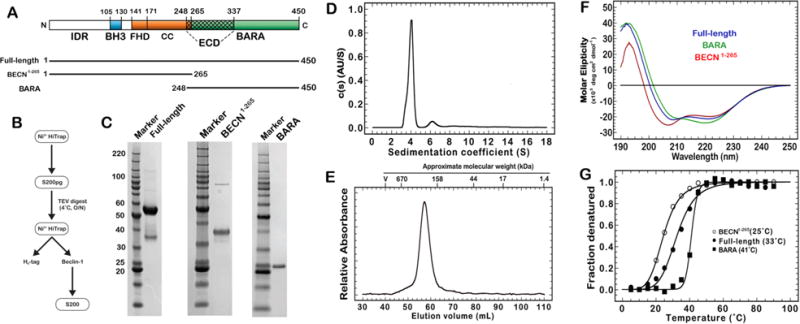
Purification, folding, and thermal stability of BECN1 proteins. (A) Schematic of BECN1 structural domains and constructs. Domains are defined as the intrinsically disordered region (IDR), the BH3 motif (BH3), the coiled-coil domain (CC), the evolutionary conserved domain (ECD), and the β/α-repeated, autophagy-related domain (BARA). (B) General scheme for purifying recombinant BECN1 proteins from Escherichia coli. (C) Sodium dodecyl sulfate–polyacrylamide gel electrophoresis of BECN1 proteins. (D) Sedimentation coefficient distributions [c(s) analysis] of velocity data for full-length BECN1. (E) Size exclusion chromatography of the full-length Becin-1 final product on a S200 16/600 GL column at 1.0 mL/min and 4°C. Approximate molecular weights of Bio-Rad standards (catalog no. 151-1901): thyroglobulin (670 kDa), γ-globin (158 kDa), ovalbumin (44 kDa), myoglobin (17 kDa), and vitamin B12 (1.35 kDa). (F) Circular dichroism (CD) spectroscopy of the full-length protein (blue), BECN1-265 (red), and the BARA domain (green) in 50 mM phosphate (pH 7.4). (G) CD thermal melts of the full-length BECN1 protein (●), BARA domain (■), and BECN1-265 (○).
Pro-survival Bcl-2 and Bcl-2 homologues (e.g., Bcl-xL) are known to downregulate autophagy by binding to the BH3 motif of BECN1.18-20 Bcl-2 is believed to stabilize the inactive BECN1 homodimer as a 2:2 complex on the endoplasmic reticulum (ER) membrane.20 Crystal structures of the truncated yeast or human CC domain show an antiparallel orientation of the BECN1 homodimer.12,13 Several viruses also target the BECN1 BH3 motif with Bcl-2-like proteins to block autophagy as a survival mechanism.21,22 Disruption of the Bcl-2/BECN1 complex, via phosphorylation of the BH3 motif or competitive disruption, will therefore initiate autophagy.23–26 How BECN1 undergoes the transition from the inactive homodimer to an active PI3K complex is currently unresolved; however, a mechanism for controlling the BECN1 monomer–dimer switch has been proposed for Bcl-xL and UVRAG.27 Low-resolution crystal (4.4 Å) and EM (28 Å) structures of the PI3K complexes from human and yeast show BECN1 in an extended conformation that spans one axis of the heterocomplex. Both complexes contain a single BECN1 protein in a 1:1:1:1 stoichiometry with the other PI3K proteins, where the BECN1 CC domain is aligned in a parallel orientation with the CC domain of either ATG14 or UVRAG.9,28,29
We present the first characterization of full-length, recombinant, human BECN1 expressed in milligram quantities from Escherichia coli. A combination of biochemical and biophysical techniques was used to show that the full-length BECN1 protein exists as a soluble, folded, homodimer with an elongated structure in solution. Binding experiments between either the wild type or a mutant form of full-length BECN1 and Bcl-2 or liposomes agree well with published reports of truncated BECN1 domains. Full-length BECN1 exhibits a propensity to form the homodimer (KD ~ 0.45 μM) that is stronger than that of the isolated CC domain (48 μM).13 We also compare the full-length protein to two truncated forms of BECN1 (Figure 1A): (1) the BARA domain (residues 248–450) and (2) a BARA-less construct that contains the complete set of domains that are N-terminal to the BARA domain (residues 1–265). We define this latter construct as BECN1-265 to clearly differentiate the nomenclature from the BARA domain construct. These data, together with analysis of the crystal structure of the BARA domain,14 led us to hypothesize that BECN1 homodimerization is strengthened by interactions between the CC and BARA domains. In support of this hypothesis, mutations of residues at the proposed interface destabilize the ability of full-length BECN1 to form a homodimer by ~5-fold. A similar mutant was recently reported in this region using a truncated CC/BARA construct.30
MATERIALS AND METHODS
Peptide Synthesis
A peptide composed of residues 97–126 of the BECN1 sequence (FTLIGEASDGGTMENLSRRLKVTGDLFDIM) was synthesized and purified by the Tufts Core Facility (Medford, MA) using automated, solid-phase, Fmoc synthesis and purified by high-performance liquid chromatography (HPLC). The peptide was solubilized at 10 mM in dimethyl sulfoxide and stored at −20°C until it was needed. The peptide was thawed and diluted into buffer before use.
Expression and Purification of Full-Length BECN1
The BECN1 gene (UniProt entry Q14457) was optimized for expression in E. coli (GeneArt, Life Technologies) and cloned into a novel suite of pET21b vectors, each having a different N-terminal tag (i.e., His6, His6-SUMO, His6-GST, His6-MBP, or His6-Trigger Factor) using the Golden Gate strategy.31 All N-terminal tags were followed by two protease cleavage sites (i.e., thrombin and TEV) for removal of the solubility tag. A C-terminal FLAG-AviTag was used for the initial tracking and identification of BECN1 throughout the purification process but later omitted from the construct with a stop codon. Protein expression for each set of vectors was tested in five strains of E. coli: One Shot BL21 Star (DE3) (ThermoFisher), Arctic Express (Stratagene), Origami B(DE3) (Novagen), SHuffle T7Express (New England BioLabs), and SHuffle K12 competent cells (New England BioLabs). SHuffle T7 Express E. coli (New England Biolabs) gave the highest level of overexpression of soluble BECN1 fusion proteins and was used for subsequent experiments. Large-scale expression of BECN1 fusion proteins was performed by growing cultures in TB at 37°C with orbital shaking at 180 rpm to mid-log phase (A600 ~ 0.6–0.8), cooling cultures to 18°C for 30 min before induction with 0.5 mM isopropyl β-D-1-thiogalactopyranoside, and growing the induced cultures for 18 h at 18°C. Cell pellets were harvested via centrifugation and stored at −50°C.
The procedure for purifying full-length BECN1 is shown in Figure 1B. Purification of the fusion protein began by resuspending thawed cell pellets in lysis buffer [50 mM Tris (pH 8), 500 mM NaCl, 10% glycerol, 20 mM imidazole, 0.5 mM TCEP, 1× Roche protease inhibitor, and 1× lysonase] in ~10 mL of lysis buffer per gram of cell pellet. Cells were broken via two passes through a microfluidizer (Avestin, Inc.) at 4°C and 18000 psi. The lysates were centrifuged to remove insoluble material and filtered (0.2 μm) before being loaded on a 20 mL Ni2+-charged HiTrap column (GE Life Sciences). The column was washed with 3–5 column volumes of wash buffer [25 mM Tris (pH 8), 500 mM NaCl, 10% glycerol, and 0.5 mM TCEP] containing 20 mM imidazole, and bound protein was eluted with a linear gradient of imidazole. The HiTrap product was passed over a preparation grade Superdex 200 26/600 GL column (GE LifeSciences) using an isocratic elution in wash buffer to remove soluble aggregates and low-molecular weight contaminants. The dimeric BECN1 fusion protein was isolated and digested overnight with His-tagged TEV protease [1:20 (w/w)] at 4°C. The next day, the digested sample was rebound to a Ni2+-charged HiTrap column and eluted with 3–5 column volumes of wash buffer with 20–30 mM imidazole. The protein was then either concentrated and frozen at −80°C or further purified with a Superdex 200 column to remove residual aggregates before analysis. A typical purification of the Trigger Factor construct of full-length BECN1 yielded 3-5 mg of full-length BECN1 per liter of culture. Sample purity was estimated to be ≥80% full-length BECN1 by both densiometric analysis of sodium dodecyl sulfate-polyacrylamide gel electrophoresis (SDS-PAGE) using ImageJ (Figure 1C) and ultracentrifugation (Figure 1D, described below). Attempts to remove the degraded product with additional reducing agent (≤2 mM) or Arg/Glu mixtures32 had no effect on the final product. The mass of the BECN1 monomer (calculated mass, 51953 Da; observed mass, 51952 Da) was confirmed by liquid chromatography and mass spectrometry (LC-MS). Western blot analysis of the protein product was performed using a BECN1 primery antibody (Abcam catalog no. 62557) and a secondary nanobody-HRP fusion (Abcam catalog no. 191866). Purified BECN1 protein was quantified via ultraviolet-visible (UV-vis) analysis using an ε280 of 54890 M−1 cm−1.
Investigation of the degradation product observed during SDS-PAGE analysis of full-length BECN1 was conducted in two ways. First, a second BECN1 construct with a C-terminal FLAG tag was used in select experiments to determine that at least one component of the degradation product was the C-terminal portion of BECN1. An anti-FLAG primary antibody fused to HRP (Sigma-Aldrich catalog no. A8592-1mg) was used. The second analysis involved excision of each SDS-PAGE band and peptide mapping using the Proteomics Core Facility at the Whitehead Institute (Cambridge, MA). Peptides from both termini of BECN1 were observed in the excised band for the degradation product.
The number of reduced sulfhydryls in the full-length BECN1 protein was quantified using Ellman’s reagent (Thermo Scientific). The protein was solvent-exchanged into 100 mM phosphate buffer (pH 8.0) with 1 mM EDTA using a Superdex 200 Increase 10/300 GL column. The assay was then performed according to the manufacturer’s protocol. The assay reported an average of 8.4 ± 0.3 reactive sulfhydryl moieties, which supports the fact that there are no disulfide bonds in the full-length BECN1 protein, consistent with the LC-MS data.
The V250/M254/L261A mutant of full-length BECN1 was created using QuikChange mutagenesis (Stratagene) with the following primers: V250A/M254A, GAACTGAAAAGCGCTGAAAATCAGGCGCGTTATGCACAG (forward) and CTGTGCATAACGCGCCTGATTTTCAGCGCTTTTCAGTTC (reverse); L261A, GCACAGACCCAGGCGGACAAACTGAAAAAAACGAATG (forward) and CATTCGTTTTTTTCAGTTTGTCCGCCTGGGTCTGTGC (reverse). Each mutated residue is underlined in each primer. Purification of the mutant protein was performed as described above.
Expression and Purification of Truncated BECN1 Domains
Two truncated forms of BECN1 were made for comparison with the full-length protein: BECN1-265 (residues 1-265) and BARA (residues 248-450). Each truncation protein was cloned into a pET21b vector with an N-terminal hexahistidine tag followed by thrombin and TEV protease cleavage sites. Each vector was independently transformed into One Shot BL21 Star (DE3) E. coli cells (ThermoFisher).
Expression and purification of BECN1-265 were performed as described above for BECN1. Sample purity was estimated to be ≥90% by SDS-PAGE with image analysis using ImageJ (Figure 1C). LC-MS of the BECN1-265 sample showed the presence of two major species, at 30529 and 30534 Da. Both values are relatively close to the calculated value of 30533 Da but indicate that some disulfide character exists in roughly 50% of the population (even with 0.5 mM TCEP). Sulfhydryl analysis of purified BECN1-265 was performed using Ellman’s reagent as described above for the full-length protein. On average, 2.0 ± 0.2 of the six cysteines in the BECN1-265 sequence were reactive to the Ellman’s reagent, confirming the LC-MS analysis result that two disulfide bonds exist in the BECN1-265 construct. Expression and purification of BARA were performed as described above for BECN1, except an S75pg 26/600 column was used in place of the S200pg 26/600 column. BARA sample purity was estimated to be ≥95% by SDS-PAGE using ImageJ (Figure 1C), and the mass of the BARA monomer was confirmed by LC-MS to be 23657 Da.
Expression and Purification of Human Bcl-2
Residues 1-218 of the Bcl-2 gene (UniProt entry P10415) were optimized for expression in E. coli (GeneArt, Life Technologies) and cloned into a pET28a vector with an N-terminal His6-MBP solubility tag with a TEV cleavage site to remove the tag. Expression and purification of Bcl-2 were performed as described above for BECN1. Bcl-2 sample purity was estimated to be ≥95% by SDS-PAGE, with image analysis using ImageJ, and the mass of the Bcl-2 monomer was confirmed by LC-MS to be 24256 Da. Purified protein was quantified via UV-vis analysis using an ε280 of 43430 M−1 cm−1. Aliquots were concentrated to >100 μM and frozen at −80°C until they were used.
Circular Dichroism (CD)
CD spectroscopy was used to estimate the secondary structure and melting temperature (TM) of BECN1 proteins. Both experiments were performed using a J-815 CD spectrophotometer (Jasco). For secondary structure analysis, proteins were thawed on ice and solvent-exchanged into 50 mM phosphate buffer (pH 7.4) using an S200 Increase 10/300 GL column (GE Life Sciences). Samples were prepared at 1-3 μM, and spectra were recorded in a 2 mm path-length quartz cuvette from 260 to 190 nm at a rate of 2 nm/min and 20°C. The resulting spectra were the average of three scans after subtraction of a buffer blank. Secondary structure analysis was performed using three online servers: K2D3,33 Perry,34 and BestSel.35
For TM analysis, proteins were solvent-exchanged either by dialysis (1:1000) or by size exclusion chromatography (SEC) against 25 mM Tris (pH 8), 150 mM NaCl, and 0.5 mM TCEP at 4°C and loaded into a 2 mm quartz cuvette at 0.1 mg/mL. The sample was then heated from 5 to 90°C at a rate of 2°C/min using a Peltier controlled sample cell. Protein denaturation was assessed by monitoring the loss of the signal at 222 nm. Curves were fit using a single or double Boltzmann equation.30
Size Exclusion Chromatography (SEC)
The BECN1 homodimer was characterized using SEC by varying the salt or protein concentration. In both experiments, BECN1 was buffer-exchanged by SEC or dialysis (1:1000) against 25 mM HEPES (pH 7.5), 150-500 mM NaCl, and 0.5 mM TCEP at 4°C, concentrated using a YM-30 Centricon (Amersham), and stored on ice until it was used. BECN1 was diluted into the appropriate buffer and incubated for 30 min at room temperature prior to SEC analysis in the corresponding running buffer. Chromatograms were collected with a Superdex 200 5/15 GL Increase column (GE LifeSciences) at a rate of 0.4 mL/min using an Agilent 1100 HPLC system (Agilent Technologies,) coupled to miniDAWN TREOS light scattering and OptiLab T-rEX refractive index detectors (Wyatt Technology Co.). Protein elution was monitored at 280 nm, and the area under the curve was calculated for each species. Light scattering data were fit using Astra version 6.1.
Analytical Ultracentrifugation
Two types of sedimentation experiments were performed using a ProteomeLab XL-1 ultracentrifuge (Beckman Instruments). Prior to each experiment, the aggregate was removed from the protein sample using a Superdex 200 Increase 10/300 GL column in 25 mM HEPES (pH 7.5), 150 mM NaCl, and 0.5 mM TCEP. The first experiment assessed sample purity using sedimentation velocity. These experiments were conducted in an An50 Ti rotor at 42000 rpm and 20°C. Samples were allowed to equilibrate at 20°C for 1 h prior to the start of the experiment. Absorbance data were collected at 280 nm and fit as a function of sedimentation coefficient distributions [c(s) analysis] in SedFIT.36,37 SedNTerp was used to calculate the partial specific volume (0.72846 mL/g), buffer density (1.0064 g/mL), and buffer viscosity (0.010034 cP) parameters.38 The second set of experiments used high-speed sedimentation equilibrium and was performed to determine the binding affinity of the BECN1 homodimer.39 These experiments were conducted at 4°C using an An60 Ti rotor at 9500, 12000, and 19000 rpm. SedNTerp was used to calculate the partial specific volume, buffer density, and buffer viscosity parameters used for fitting.38 Absorbance data were collected at 280 nm. Data were fit using SedPHAT.37,40 Images were generated using GUSSI.41
Isothermal Titration Calorimetry (ITC)
ITC experiments were conducted with an automated MicroCal (Amherst, MA) VP-ITC instrument. Proteins were dialyzed (1:1000) against two changes of ITC buffer [25 mM HEPES (pH 7.5), 150 mM NaCl, and 0.5 mM TCEP] at 4°C. Bcl-2 was loaded into the sample syringe (225-250 μM) and titrated into the BECN1 sample (9-20 μM) as 2 μL injections at 25°C. Titration data were corrected for the heats of injection and fit using Origin 7.0 (OriginLab, Wellesley, MA).
Lipid Binding Assays
Liposome float assays were performed using a step sucrose gradient (0, 40, and 50%) as described by Huang et al.14 L-α-Phosphatidylcholine (PC, chicken egg), L-α-phosphatidylethanolamine (PE, chicken egg), L-α-phosphatidylserine (PS, porcine brain), L-α-phosphatidylinositol (PI, bovine liver), and cardiolipin (CL, bovine heart) lipids were purchased in chloroform (Avanti Polar Lipids). Liposomes were assembled at a PC:PE:PS:PI:CL ratio of 47:28:9:9:7, extruded using a membrane with 100 nm pores, and sized using a MALS detector. SDS-PAGE, with ImageJ analysis, of the top fraction was used to compare the relative amount of BECN1 bound to liposomes.
Dynamic Light Scattering (DLS)
Samples (20 μL) were prepared at a protein concentration of 8 μM and incubated alone or with liposomes (0.6 mg/mL) in a 384-well plate (Corning catalog no. 8794BC) at 25°C. Measurements were taken at 5-10 min intervals, with 10 acquisitions per measurement, using a DynaPro Plate Reader II (Wyatt Technology Co.). Liposomes were prepared as described above. Analysis was done using Prism 7.
1H-15N SOFAST-HMQC
Uniformly 15N-labeled BARA protein was prepared using published methods.42 The labeled protein was solvent-exchanged into binding buffer by two changes of dialysis buffer (1:1000) at 4°C. NMR spectra of 30-35 μM 15N-labeled BARA with and without increasing amounts of BECN1-265 and unlabeled BARA were recorded at 298 K using a 600 MHz Bruker Avance III NMR instrument (Bruker Co.) equipped with a 5 mm Cryo-QCI probe and a SampleJet for sample handling. 1H-15N SOFAST-HMQC spectra were recorded using published methods by collecting 128 increments of 512 complex points using 96 transients with a 70 ms interscan delay.43 Data were analyzed using TopSpin version 3.5.
Molecular Modeling
The coordinates deposited in the RCSB Protein Data Bank (PDB) for the BARA domain (entry 4DDP) were used as the starting coordinates for the protein and imported into MOE.44 Upon inspection of the F0 electron density maps generated by the PDB Redo server at 1.5σ, there was little to no resolvable electron density for the positions of residues 265–272, which linked the helix to the larger protein. These residues were removed or not added in subsequent steps. Solvent atoms were removed, and missing side chains and backbone atoms in the 387–389 loop were added as highest-probability rotamers and ϕ and ψ angles. Hydrogens were then added and adjusted using the Protonate3D routine in MOE, which assigns the most likely ionization state of amino acids, the tautomer state of His, Glu, and Asp, and rotamers of the alcohol or thiol of Ser, Thr, Cys, and Tyr. C-Terminal breaks were capped by N-CH3, and N-terminal breaks were capped by acetyl (C=OCH3) to avoid strong charge effects during minimization. The structure was then minimized using the AMBER10 force field45 with fixed backbone atoms followed by full optimization of the protein. Images were produced in PyMol after removing the capping groups and the nonhelical Lys248 for better visualization using a default surface rendering (Connoly surface with a 1.4 Å radius probe). The contact surface was colored orange on the basis of the sum of van der Waals distances between partners plus a tolerance of 0.5 Å.
RESULTS
A Soluble Form of Full-Length BECN1 Can Be Expressed in E. coli in Milligram Quantities
The full-length BECN1 gene was cloned into modified pET21b vectors with different N-terminal solubility tags. The greatest yields were obtained with an N-terminal affinity tag comprised of a polyhistidine sequence and either the maltose binding protein (MBP) or the chaperone protein Trigger Factor (TF). While both constructs produced similar yields, the TF fusion gave a significantly more homogeneous product after TEV cleavage as assessed by SEC. The TF fusion was therefore used for all subsequent preparations of full-length BECN1. The level of overexpression for all constructs was greatest in E. coli strains with cytoplasmic environments enhanced for disulfide bond formation (i.e., Origami B, SHuffle). A reducing agent was required throughout the purification to reduce the level of formation of soluble aggregates. A typical purification yielded 3-5 mg of the full-length BECN1 protein per liter of bacterial culture. The LC-MS value of full-length BECN1 (51951.8 ± 0.5 Da) was within error of the calculated mass (51953 Da). The relative sample purity was determined to be ≥80% using a combination of ImageJ analysis of SDS-PAGE and integration of the peaks observed in sedimentation velocity experiments. The major impurity that co-purified with BECN1, with an apparent mass of 35 kDa (Figure 1C), was identified by Western blots of N- and C-terminal epitopes to be a degradation product (see Materials and Methods).
The BECN1 Homodimer Exhibits an Elongated Structure in Solution
Sedimentation velocity experiments resolve a single major protein population (83% of the signal; Sw = 3.97 S; Sw,20 = 4.07 S) that agrees well with the SDS-PAGE densitometric analysis using ImageJ and likely represents the full-length BECN1 protein (Figure 1D and Figure S1). These sedimentation velocity data were best modeled with a frictional ratio consistent with an ellipsoid particle (f/f0 = 1.52). This ratio indicates a structure for the full-length protein that is more compact than that reported for truncated forms of the IDR alone (residues 1-150; f/f0 = 2.2),10 BH3/CC (residues 95-266; f/f0 =1.96),27 or the CC domain alone (residues 133–266; f/f0 = 2.01)27 but less compact than that of globular proteins like BSA (f/f0 = 1.3).46 A nonspherical shape for the full-length protein is further supported by SEC experiments at 4°C that reveal a single species eluting with an apparent molecular weight of ~300 kDa (Figure 1E). SEC coupled with multiangle light scattering (MALS) gave an observed mass of 111.6 kDa that agrees well with the calculated dimer mass of 103.9 kDa (Figure S2).
The SEC and ultracentrifugation data indicate that BECN1 exhibits a larger than expected hydrodynamic radius for a homodimer, which is typical of nonspherical proteins or proteins with large unstructured regions.10 We used DLS to estimate the approximate hydrodynamic radius of the full-length and truncated BECN1 constructs in solution. BARA had an experimental radius of 1.4 nm, which indicates that the BARA domain assumes a compact, globular structure in solution. Experimental radii for the BECN1-265 and full-length BECN1 protein were 5.7 and 7.6 nm, respectively. Elongated radii for the BECN1-265 construct and full-length BECN1 protein strongly agree with the observations from AUC, SEC, and SEC-MALS experiments.
The Full-Length BECN1 Structure Is Largely Disordered, but Thermally Stable, in Solution
The relative secondary structure of the full-length protein and truncated domains was assessed using CD spectroscopy (Figure 1F). Each sample produced CD spectra with a curve that represents a well-folded structure with different mixtures of secondary structure elements. The spectra of the full-length BECN1 protein lie between the limits of the BECN1-265 and BARA constructs but do not appear to be the average of the two constructs. The most notable qualitative changes in CD spectra are the shifted position and amplitude of the spectral minima near 208 and 222 nm, which classically define proteins with a high helical content.47 The full-length protein exhibits minima at 208.4 and 221.4 nm, each with a similar signal intensity. The BECN1-265 construct has a pronounced blue shift in the minimum at 206.8 nm that indicates a structure more disordered than that of the WT protein and has a second weaker minimum at 222.0 nm. The BARA construct has a prominent minimum at 220 nm and a shoulder around 210 nm.
We used three online servers for a more quantitative comparison of the amount of secondary structure for each set of spectra and to test for consistency in the structural calculations (see Materials and Methods). The results of the calculations are summarized in Table 1. Calculation of the secondary structure content of the BARA construct from the CD spectra agrees fairly well with the observed secondary structure in the crystal structure (PDB entry 4DDP).14 Similarly, the calculations for the BECN1-265 construct predict 34% α-helical content, which is consistent with the expected 91 residues that would form the CC domain. The 13% β-sheet content of the BECN1-265 construct is unexpected because published NMR and CD data of the IDR (residues 1-150) show no significant secondary structure.10 We therefore believe one of two scenarios will likely explain the β-sheet content in the BECN1-265 construct. (1) There is induced β-sheet structure in the IDR from interactions with the CC domain, or (2) there is induced β-sheet structure in the IDR from disulfide bonds. Attempts to denature the disulfide bonds with excess TCEP were unsuccessful and not extensively pursued because the BECN1-265 construct performed as expected in functional assays (vide infra). The full-length BECN1 protein exhibited an amount of α-helical content similar to that of the BARA domain and the smallest amount of β-sheet character of the three samples. We interpret this result as there simply being more disordered structure within the IDR of the full-length protein, especially in the absence of the disulfide bonds observed in the BECN1-265 construct.
Table 1.
Calculated Values for the Secondary Structural Composition of the BECN1-265 or BARA Constructs and Full-Length BECN1 Protein from CD Spectra
| % α-helix | % β-sheet | |
|---|---|---|
| BECN1-265 | 34.3 ± 4.7 | 13.4 ± 5.7 |
| BARA | 47.8 ± 11.1 | 11.5 ± 6.0 |
| full-length | 48.3 ± 11.5 | 9.6 ± 5.1 |
Thermal melts of the full-length BECN1 protein, the BECN1-265 construct, or the BARA construct using CD spectroscopy each revealed a single TM value of 33, 25, or 41°C, respectively (Figure 1G). The TM of our BARA construct agrees with the published value,14 where the TM of the BECN1-265 construct is notably lower than that of the full-length protein (ΔTM = −7°C) and reported values for the truncated human CC (TM = 34°C)30 and rat CC (TM = 40°C)12 constructs. Interestingly, a recent publication by Sinha and co-workers shows a biphasic set of transitions (TM values of 23.9 and 49.0°C) for BECN1 (residues 175-450; F359D/F360D/W361D). This construct comprised the coiled-coil and BARA domains and also contained three point mutations in the “aromatic finger” of the BARA domain, which increased the stability of the protein.30 These transitions were proposed to represent the TM of the coiled-coil and BARA domains. We conducted additional thermal melt experiments closer to their buffer system [10 mM phosphate (pH 7.4) and 100 mM (NH4)2SO4] or under conditions with no added salt, 100 mM NaCl, or 500 mM NaCl to determine whether we could generate differential melting events with our full-length BECN1 protein (Figure S3). In phosphate buffer alone, BECN1 exhibits a TM of 31°C. All three salt conditions yielded melting transitions with a single event that fit to a TM value of 33°C. Hence, we conclude that the unaltered, full-length BECN1 protein melts in a single, cooperative process. The difference between our results and those of Glover et al. may be due to their use of a truncated BECN1 construct and/or the presence of the three point mutations in the BARA domain that gave rise to greater protein stability (△TM = +5°C).14
Bcl-2 Binds More Tightly to Full-Length BECN1 Than to the Isolated BH3 Peptide
BECN1 is a BH3-only protein.48 Bcl-2 inhibits autophagy by binding to the BH3 domain of BECN1.20,49,50 This BH3 motif is an amphipathic helix that is largely disordered when free in solution and assumes a helical structure upon binding to Bcl-2.10 To confirm that the bacterially produced constructs recapitulate the Bcl-2-BECN1 interaction, we performed ITC experiments between Bcl-2 and three forms of BECN1 that contain the BH3 motif: a BECN1 BH3 peptide (residues 97-126), BECN1-265, and full-length BECN1 (Figure 2 and Table 2). Titrations of Bcl-2 into solutions of the BH3 and BECN1-265 domains yielded similar KD values (9.6 ± 2.2 and 9.1 ± 1.1 μM, respectively). These data are consistent with literature values for a shorter BECN1 BH3 peptide (residues 105-130; KD = 8.0 ± 0.2 μM) or the BECN1 IDR (residues 1-135; KD = 8.6 ± 1.2 μM).51 ITC experiments with the full-length BECN1 protein produced a KD of 4.3 ± 1.2 μM, roughly 2-fold tighter than the shorter constructs.
Figure 2.
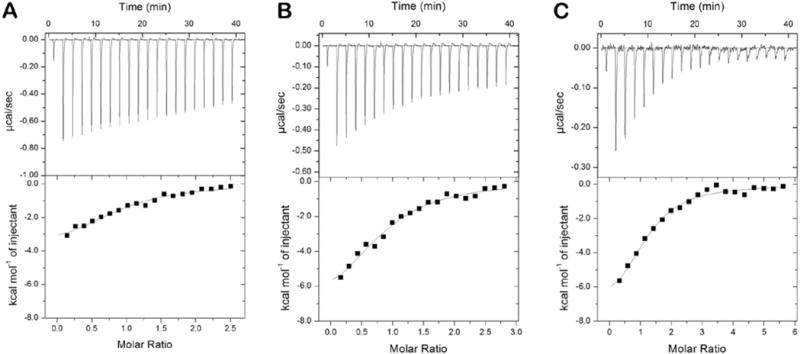
ITC isotherms of Bcl-2 (amino acids 1–218) titrated into a solution of the BECN1 (A) BH3 peptide (amino acids 97–126), (B) BECN1-265 (amino acids 1–265), or the (C) full-length protein (amino acids 1–450). Bcl-2 (225–250 μM) was titrated as 2 μL injections into a solution of each BECN1 protein (9–20 μM) at 25°C.
Table 2.
Thermodynamic Data from ITC Experiments between Bcl-2 and BECN1 Proteins at 25°Ca
| BH3 | BECN1-265 | full-length | |
|---|---|---|---|
| residues | 97–126 | 1–265 | 1–450 |
| KD (μM) | 9.6 ± 2.2 | 9.1 ± 1.1 | 4.3 ± 1.2 |
| N | 1.02 ± 0.09 | 0.87 ± 0.02 | 1.01 ± 0.18 |
| ΔH (kcal/mol) | −3.8 ± 0.3 | −8.3 ± 0.6 | −7.9 ± 0.8 |
| ΔG (kcal/mol) | −6.9 ± 0.1 | −6.9 ± 0.1 | −7.4 ± 0.2 |
| −TΔS (kcal/mol) | 3.0 ± 0.2 | −1.5 ± 0.6 | −0.5 ± 0.9 |
Values and standard deviations from this work represent the average of three experiments.
Full-Length BECN1 Preferentially Binds to Cardiolipin-Containing Liposomes
The BARA domain of BECN1 was first shown to bind to and deform liposomes that mimic Xenopus laevis mitochondria.14 Moreover, the authors showed that cardiolipin specifically enhances the ability of the BARA domain to interact with liposomes. We tested whether the bacterially produced, full-length BECN1 protein behaved like the BARA construct by mixing it with liposomes that contain or lack cardiolipin. These mixtures were analyzed by either a liposome float assay that measured the ability of BECN1 to bind liposomes or a kinetic assay that monitored an increase in average liposome size over time. For liposome float assays, the mixture was added to a high-density sucrose solution, layered under lower-density solutions, and centrifuged until equilibrium was achieved. Liposomes are low-density structures that float to the top of the density gradient during the ultracentrifugation run. ImageJ was used to analyze SDS-PAGE gels of the relative protein content for the top fraction of each gradient. The bacterially produced, full-length BECN1 protein showed a 4-5-fold preferential binding to liposomes containing cardiolipin over those that do not (Figure 3A).
Figure 3.
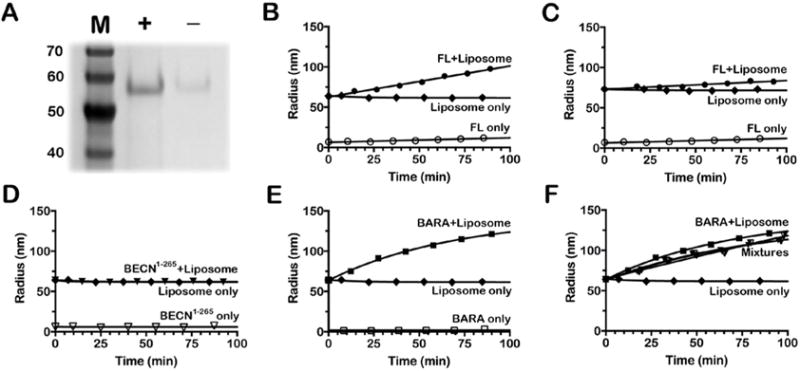
Lipid interaction assays. (A) SDS-PAGE analysis of the top fraction from a liposome float assay for full-length BECN1 using liposomes made with (+) or without (−) cardiolipin. (B-F) Liposome deformation assays for (B) full-length BECN1 using liposomes with 7% cardiolipin, (C) full-length BECN1 using liposomes with 0% cardiolipin, (D) BECN1-265 with liposomes containing 7% cardiolipin, (E) the BARA domain with liposomes containing 7% cardiolipin, and (F) the BARA domain with liposomes containing 7% cardiolipin, but with 0, 0.25, 1, or 2 molar equivalents of BECN1-265 added to the BARA/liposome reaction. The term Mixtures represents three overlaying traces of the BARA construct with 0.25, 1, or 1.5 equiv of the BECN1-265 construct added to the reaction (▼).
The BARA domain has been shown to bind and deform liposomes using electron microscopy and kinetic DLS experiments.14 We replicated the DLS assays using the full-length BECN1 to test whether it could deform liposomes as a function of an increased average hydrodynamic radius of extruded liposomes. As seen in the liposome float assays described above, the full-length protein preferentially increased the relative size of cardiolipin-containing liposomes (~3.5 times faster) over those without cardiolipin over 90 min at 25°C (Figure 3B,C). DLS experiments for BECN1-265 showed no ability to alter the size of cardiolipin-containing liposomes (Figure 3D). Experiments with the BARA domain showed an appreciable increase in the size of cardiolipin-containing liposomes (Figure 3E), which is consistent with the report by Huang et al.14 Adding the BECN1-265 construct to the BARA reaction mixtures at 0.25, 1, or 1.5 molar equivalents had an only nominal effect on the activity exhibited by the BARA domain (Figure 3F). Control experiments that monitor only protein or liposomes showed no significant change in particle size over the 90 min experiment. Hence, we interpret these findings to mean that the BARA domain, either alone or in the full-length protein, interacts with cardiolipin-containing membranes without any influence of other BECN1 domains.
Full-Length BECN1 Forms a Homodimer with Submicromolar Affinity
Full-length BECN1 forms a homogeneous high-molecular weight species in solution with an observed mass of approximately 110 kDa (Figure 1E and Figure S2) that agrees well with the calculated mass of a homodimer (103.9 kDa). Titration of the loaded amount of full-length BECN1 in SEC-MALS experiments enabled separation of the monomeric and dimeric species by decreasing the salt concentrations (from 500 to 150 mM) at room temperature (Figure 4A). These experiments also used an analytical grade resin that improved separation when compared to that seen with the preparation grade resin shown in Figure 1. Integration of the respective peaks gave a crude approximation of the KD of 480 ± 54 nM (Figure 4B). To provide a more accurate measure of the KD of dimerization, we used sedimentation equilibrium analytical ultracentrifugation to measure the affinity for the BECN1 homodimer in solution. The sedimentation data fit well to a monomer/dimer equilibrium model with a KD of 390 (380, 460) nM (Figure 4C). Global analysis of these data estimated the molecular weight of the dominant protein species to be 104.5 kDa, which agreed well with the result of the SEC-MALS experiment and the calculated mass of the BECN1 homodimer. Attempts to measure the homodimer KD using ITC via dissociation heats, which is a method previously employed for the BECN1 CC domain,12,13 were unsuccessful because of a lack of observed heats in several attempts and aggregation at the concentrations required for ITC.
Figure 4.
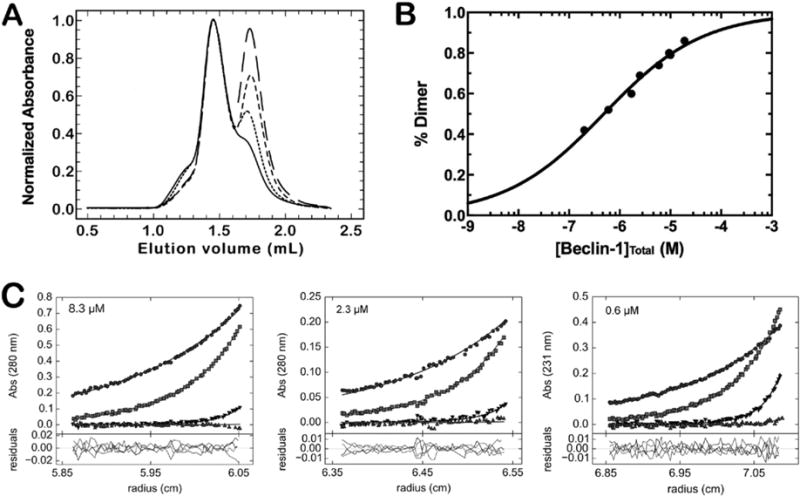
Full-length BECN1 undergoes a reversible monomer/dimer equilibrium. (A) Overlaid chromatographic profiles of BECN1 at various protein concentrations using a Superdex 200 5/15 GL Increase column. Samples were run at 0.4 mL/min in 25 mM HEPES (pH 7.5), 150 mM NaCl, and 0.5 mM TCEP. The concentrations for the injected samples shown in the figure are 10 (—), 5.9 (⋯), 2.5 (—), and 0.6 (—) μM. Data were normalized to the BECN1 dimer peak at ~1.45 mL. (B) Determination of the KD for the BECN1 homodimer from integration of the absorbance spectra in panel A. (C) Sedimentation equilibrium of full-length BECN1. The samples were run at 9500 (●), 14500 (■), 24000 (▼), or 35000 (▲) rpm.
The measured homodimer KD is significantly tighter than the value estimated from the isolated CC domain of the human (48 μM) or rat (89 μM) homologue under similar buffer conditions (150 mM NaCl at pH 8).12,13 To investigate whether the BARA domain could contribute to dimerization, we repeated the SEC-MALS experiments with the construct BECN1-265. SEC-MALS analysis at 100 μM shows an asymmetric peak with an average mass of 40.1 kDa (Figure 5A). This mass is larger than that of a monomer (30.5 kDa) and significantly lower than that expected for the dimer (61.1 kDa). Lower concentrations of BECN1-265 (7.7–15 μM) elute as a symmetric peak with an average mass of 30.4 kDa (Figure S4A) and resolve the mass of the pure monomer. Together, these data indicate that the BECN1-265 construct forms a weakly associated homodimer that dissociates as it elutes over the column. We were unable to determine an accurate KD from discernible species in these SEC-MALS experiments. Using sedimentation equilibrium analytical ultracentrifugation, we estimate the homodimer KD for the BECN1-265 construct to be 1350 (1150, 1540) nM (Figure S4B). This value is 3.5-fold weaker than that of the full-length BECN1 protein and should be observable in SEC-MALS experiments at 100 μM; however, we attribute the lack of a stable BECN1-265 dimer to column interactions and significant dilution over the course of the experiment. We also note that the homodimer KD for the BECN1-265 construct is 35-fold tighter than the value for the isolated human CC domain.13 Our BECN1-265 construct contains the entire CC domain used in their study, and we attribute this difference to the experimental methodology. During SEC-MALS experiments, the BARA construct eluted as a predominantly monomeric species in parallel experiments up to 100 μM, but without an observable migration of the elution volume (Figure 5B and Figure S4C).
Figure 5.
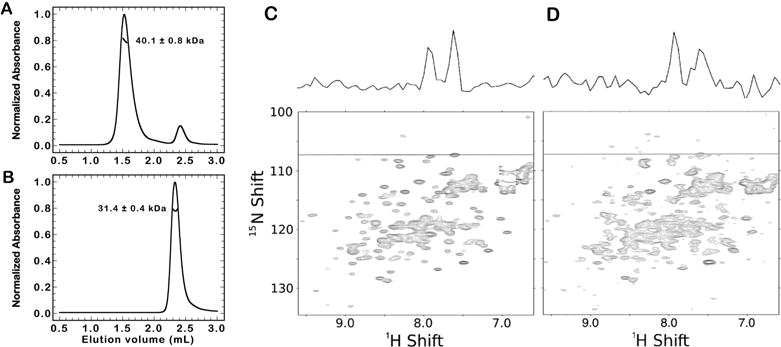
BECN1-265 and the BARA domain are predominately monomeric in solution and interact with low affinity. (A) SEC-MALS of BECN1-265 (100 μM) on a Superdex 200 5/15 GL Increase column at a rate of 0.4 mL/min. An average mass of 40.1 kDa was observed. (B) SEC-MALS of BARA (100 μM) as described for panel A. An average mass of 31.4 kDa was observed. (C) SOFAST-HMQC spectra of 15N-labeled BARA (35 μM) at 25°C. The dashed line represents a one-dimensional (1D) slice of the 1H ordinate that is shown above the two-dimensional (2D) spectra. (D) SOFAST-HMQC spectra of 15N-labeled BARA (35 μM) mixed with 30 μM BECN1-265 at 25°C. The dashed line represents a 1D slice of the 1H ordinate that is shown above the 2D spectra.
The dramatic difference in KD values between the full-length and truncated construct indicates that both the CC domain and the BARA domain contribute to form a stable homodimer in the full-length protein. We propose three possible explanations for this change in affinity. (1) The CC domain forms an intramolecular interaction with the BARA domain. (2) The CC domain of one molecule interacts with the BARA domain of a second molecule in an intermolecular fashion. (3) The BARA domain requires the structure imposed on the CC domain from the N-terminal part of the protein. Lee et al.10 used NMR to show that only weak interactions occur between the isolated IDR (amino acids 1-150) and the BARA (amino acids 248–450) proteins and concluded that these domains are essentially noninteracting in the context of the full-length protein. We investigated whether our BECN1-265 construct, which contained both the IDR and CC domains, contained the missing high-affinity binding site for the BARA domain using NMR as a probe. The 15N-labeled BARA domain shows many disperse, well-defined peaks that indicate a folded protein with a mixture of secondary structure elements (Figure 5C). Titration of BECN1-265 into the 15N-labeled BARA domain sample results in significant peak broadening (average of ~30% for 10 peaks) throughout the spectra (Figure 5D and Figure S5), consistent with an increase in the overall apparent size of the molecule. Interestingly, few significant peak shifts are observed, indicating minimal perturbation of the overall structure of the BARA domain upon interaction with BECN1-265. This interaction is presumably weak because both proteins elute independently from a sizing column. To determine if the CC residues from one BARA protein could interact with the BARA domain of another in an intermolecular fashion, we titrated the unlabeled BARA domain into a fixed amount of the 15N-labeled BARA domain. These spectra show no significant changes in the peak positions or line widths of the two-dimensional (2D) NMR spectra up to 100 μM total protein (data not shown). This result supports the SEC-MALS data for the BARA domain that show it exists as a monomeric species and rule out inter-BARA interactions of residues 248-265. Taken together, these results support the hypothesis that residues from BECN1-265 directly interact with the BARA domain.
Monomeric Mutant of Full-Length BECN1
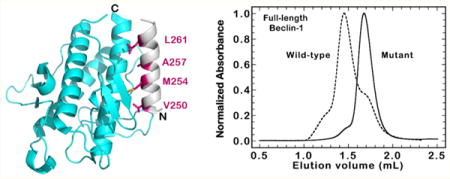
Inspection of the available crystal structures for the CC and BARA domains reveals an overlapping 17-residue α-helix (amino acids 248–265) that exists in both crystal structures.13,14,52 Moreover, this helix is the C-terminal portion of the CC domain and forms intramolecular contacts with a hydrophobic pocket of the BARA domain (Figure 6A). This interaction was first observed in the crystal structure of the BARA domain, which begins at residue 248, and shows this helix folded back on the BARA domain (Figure 6B).14 The buried hydrophobic face of the helix consists of four hydrophobic residues (V250, M254, A257, and L261) that are modestly conserved across eukaryotes (Figure 6C–E). We hypothesized that the interactions between these coiled-coil residues and the BARA domain could be involved in stabilizing the BECN1 homodimer and that mutation of the hydrophobic face to alanine residues (V250A/M254A/L261A) would directly weaken the affinity of the full-length BECN1 homodimer.
Figure 6.
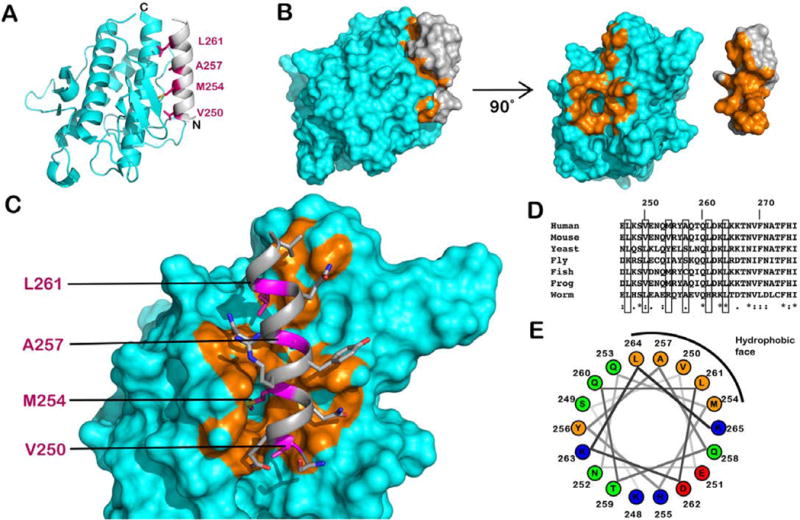
Structural analysis of the homodimerization site in BECN1. (A) Model showing the location of the mutations with respect to the high-affinity homodimerization site in BECN1 using the BARA domain crystal structure (PDB entry 4DDP). The overlapping helix (amino acids 248–265) is colored gray and the BARA domain cyan. The four residues that compose the hydrophobic face of the overlapping helix are colored magenta. (B) Space-filling model of the 4DDP crystal structure with the domains presented either as they were published or each rotated 90° to expose the hydrophobic, van der Waals contacts as orange surfaces. (C) View of the interaction between the overlapping helix (gray) and BARA domain (cyan). Orange portions highlight van der Waals interactions of <4 Å. (D) Sequence alignment for the overlapping region with the hydrophobic face denoted by gray rectangles. The yellow rectangle highlights the L261 site. Accession numbers for the aligned sequences are as follows: human, NP_003757; mouse, NP_062530; yeast, NP_015205; fly, NP_651209; fish, NP_957166; frog, NP_001085751; worm, NP_500844. (E) Helical wheel projection of residues 248–265. Hydrophobic residues are colored orange, acidic residues red, and basic residues blue.
SEC-MALS experiments with the V250A/M254A/L261A mutant in full-length BECN1 showed a single species with a mass of 50.8 ± 1.6 kDa at ~10 μM, consistent with a BECN1 monomer (~52 kDa), where the wild-type protein is >80% dimeric (Figure 7A). Using sedimentation equilibrium analytical ultracentrifugation, we estimated the homodimer KD of the mutant BECN1 protein to be 1860 (1470, 2340) nM (Figure S6). This value is 4.8-fold weaker than that of wild-type BECN1 and comparable to that of the BECN1-265 construct. The aggregation prone nature of the mutant BECN1 precluded SEC-MALS experiments at higher concentrations.
Figure 7.
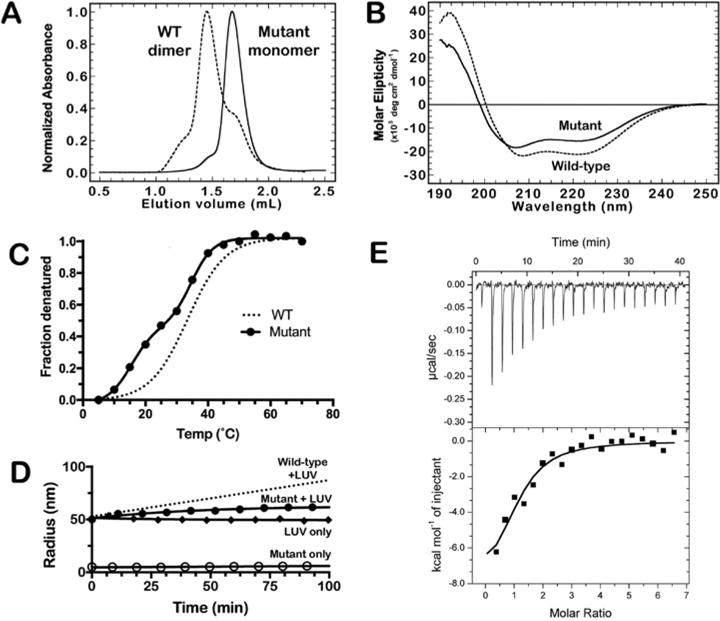
V250A/M254A/L261A mutant of full-length BECN1 that forms a stable monomer at ambient temperature. (A) SEC-MALS data for wild-type (—) or mutant (—) BECN1. Both proteins (each at 10 μM) were run at 0.4 mL/min on a Superdex 200 Increase 5/15 GL column in 25 mM HEPES (pH 7.5), 150 mM NaCl, and 0.5 mM TCEP. (B) CD spectra of wild-type [1.1 μM (—)] or mutant [0.93 μM (—)] BECN1. Spectra were recorded in 50 mM phosphate buffer (pH 7.5). (C) CD thermal melt of the full-length BECN1 mutant. The trend line for the wild-type protein is shown as a dotted line. Experiments were performed as described in the legend of Figure 1G. (D) Liposome deformation assay for the mutant of full-length BECN1 with liposomes containing 7% cardiolipin. (E) Isotherm of binding of Bcl-2 to the mutant of BECN1. Bcl-2 (228–248 μM) was titrated into a solution of the BECN1 mutant (5-10 μM) as 2 μL injections at 25°C.
Comparison of the CD spectra of the mutant with wild-type BECN1 exhibited a clear change in the CD spectra with a 1.4 nm blue shift in the low-wavelength minima (from 208.4 to 207 nm) and a decrease in the overall amplitude (Figure 7B). Deconvolution of these spectra estimated the secondary structure content of the mutant to be 41.6 ± 12.0% α-helix and 14.5 ± 6.0% β-sheet. Under the same conditions, wild-type BECN1 was predicted to contain 48.3 ± 11.5% α-helix and 9.6 ± 5.1% β-sheet. The increased β-sheet content of the BECN1 mutant is interesting because it is similar to the β-sheet content of 13.4% observed in the BECN1-265 construct. The structural change of the mutant protein is echoed by the drastic change in the thermal melt profile of the V250A/M254A/L261A BECN1 mutant (TM = 15 and 32°C) from that of the single-phase melt for the wild-type protein (TM = 33°C) (Figure 7C). We note that the melt data for the BECN1 mutant fit better to the two-phase transition (R2 = 0.999) than they did to the single-phase transition (R2 = 0.9766). Attempts to fit the melt data of wild-type BECN1 under various salt conditions (Figure S3) to a biphasic model resulted in only a marginal improvement in the fit, where the curve appeared to be monophasic (data not shown). Moreover, the biphasic fit of the mutant melt is similar to those used for the truncated CC/BARA mutants reported by Glover et al.30 (TM = 23.9 and 49.0°C or 22.1 and 45.1°C). We speculate that the higher TM values for their truncated constructs may result from inclusion of the “aromatic finger mutations” that have been shown to stabilize the isolated BARA domain by 5°C compared to the wild-type BARA domain.14 We therefore interpret the altered structural content and TM profile of the mutant protein as further evidence that these residues promote CC–BARA interactions that stabilize the BECN1 homodimer. Indeed, Glover et al. determined that mutation to this overlapping helix weakens the homodimer KD of their CC construct from 45 to 71 μM and that of their CC–BARAAFM construct from 64 to 134 μM.30 We therefore reiterate that, in the context of the full-length protein, these mutations weaken the homodimer KD by ~5 fold.
DLS analysis of 8 μM mutant BECN1 protein at 25°C yielded a hydrodynamic radius of ~5 nm (Figure 7D). This radius is 2.6 nm smaller than that of wild-type BECN1, which is dimeric under these conditions, and further supports the observation that the mutant exists in a monomeric conformation. The effect of these mutations was also observed in liposome binding assays, where the mutant protein exhibited ~35% lower efficiency of liposome modification activity compared to that of wild-type BECN1 (Figure 7D). The mutations, however, do not affect the binding of the mutant to Bcl-2, which gave a KD similar to that observed for the wild type (KD = 2.7 ± 0.7 μM; N = 1.0 ± 0.2) (Figure 7E and Table 2).
DISCUSSION
We have demonstrated the first recombinant synthesis of milligram amounts of the full-length, human BECN1 protein per liter of bacterial culture. This protein lacks post-translational modification and has only minimal scarring (one N-terminal glycine) after TEV cleavage as a result of the recombinant expression process. The full-length BECN1 protein exhibits a folded structure in solution, as determined by CD spectroscopy (Figure 1F), forms a stable homodimer with an elongated structure (hydrodynamic radius of 7.6 nm) (Figures 1E and 4A), and is stable at ambient temperature (Figures 1G and 3).
The BECN1 homodimer is of particular interest in this study because we find that the full-length protein dimerizes with a KD of ~450 nM (Figure 4). This value is roughly 100 times tighter than that reported for the isolated CC domain (48 μM) and signifies the presence of regions outside of the traditional CC domain that contribute to dimerization. NMR experiments demonstrate that a stoichiometric mixture of the BECN1-265 and BARA domains produced a larger complex (Figure 5C,D); however, attempts to purify a stable high-molecular weight species from the truncated domains via SEC were unsuccessful. This result, in combination with a recent review by Sinha and co-workers,11 directed our attention toward an overlapping helix (residues 248–264) that packs against either a hydrophobic cleft in the BARA domain or a hydrophobic face of the CC domain in various binding partners.13,14 The relevance of this overlapping helix is further underscored by our attempts to delete it from the BARA construct, which resulted in a loss of protein expression in E. coli and supports the idea that it directly stabilizes the BARA structure. The weak interaction of the BECN1-265 and BARA domains in our NMR experiments likely results from a competition of this overlapping helix between the two constructs for the hydrophobic cleft on the BARA domain. We hypothesized that mutation of the hydrophobic face of the overlapping helix to alanine residues would weaken the affinity of the full-length BECN1 homodimer. Indeed, the V250A/M254A/L261A mutant of full-length BECN1 resulted in a predominantly monomeric form of the full-length protein at concentrations at which the wild-type protein is largely dimeric (Figure 7A). This result was directly observed in SEC-MALS experiments and a change in the denaturation profile from that of the wild-type protein in CD melts. The role of this overlapping helix for stabilizing the BECN1 homodimer is recapitulated in a recent report of a truncated form of BECN1 that contained analogous mutations in the overlapping helix and stabilizing mutations in the BARA domain.30
Binding experiments using BECN1 and Bcl-2 show that the full-length protein binds Bcl-2 with an affinity 2-fold higher than that of either the BH3 peptide or the BECN1-265 construct (Figure 2 and Table 2). Analogous ITC experiments with the V250A/M254A/L261A BECN1 mutant yield a KD with Bcl-2 that is within error of that of wild-type BECN1 (Figure 7E). We therefore conclude that the tighter affinity of full-length BECN1 does not result from two Bcl-2 binding sites on the BECN1 homodimer but appears to be related to the presence of the BARA domain. We did not further refine the source of this interaction but note that it is also reflected in differences between the binding enthalpy of the BH3 peptide or the full-length BECN1 protein (−3.8 ± 0.3 or −7.9 ± 0.8 kcal/mol, respectively).
We also confirmed the ability of the full-length BECN1 protein to preferentially bind to liposomes that contain cardiolipin (Figure 3A). This result is consistent with the results of Huang and co-workers for the BARA construct and was reflected in our data for all constructs (Figure 3B,D,E).14 We reiterate their caution, however, that the biological implication for the BECN1-cardiolipin interaction is presently unclear because this lipid exists primarily within the inner mitochondrial membrane and away from the known areas that are accessible to BECN1.
Lastly, we would be remiss not to comment on the nature of the orientation of the BECN1 homodimer in the context of our results with full-length BECN1. The overlapping helix is clearly an integral component of the BECN1 homodimer because mutations to it drastically weaken the ability of the full-length protein to dimerize. The currently accepted model, however, aligns two BECN1 molecules with antiparallel CC domains and the BARA domains at opposite ends of the CC structure. A simple alignment of the published CC and BARA crystal structures, via the overlapping helix, clearly shows a steric clash between the BARA domain and the N-terminal end of the CC from the partner molecule.20,52 The overlapping helix cannot interact with the CC and BARA domains at the same time and possibly means that there is a dynamic equilibrium of the interaction between the overlapping helix and either the BARA domain or the CC domain. Indeed, the overlapping helix has been shown to be structurally labile but to preferentially interact with the BARA domain using a truncated, mutant construct of BECN1.30 Our results with the full-length protein agree with this conclusion; however, an intriguing possibility that the overlapping helix from one monomer could interact with the BARA domain of a second monomer in a dimer-swap-type model cannot be ruled out. Further experiments are required to further assess either model.
Supplementary Material
Acknowledgments
The authors thank Vamsi Mootha for the use of his ultracentrifuge and Jason McCoy for helpful discussions regarding the liposome float experiments. The authors also thank Stuart Schreiber for the use of his DLS instrument and Zarko Boskovic for his help with collecting the DLS data. The authors thank Deborah Pheasant and the Biophysical Instrumentation Facility for the Study of Complex Macromolecular Systems (National Science Foundation Grant 0070319) for their help with the ultracentrifugation experiments. The authors also thank Huaying Zhao for her helpful discussions regarding the sedimentation velocity data.
Funding
This work was supported by the National Institute of Allergy and Infectious Diseases of the National Institutes of Health via Grant U19 AI109725.
Footnotes
Supporting Information
The Supporting Information is available free of charge on the ACS Publications website at DOI: 10.1021/acs.biochem.7b00936.
Sedimentation velocity analytical ultracentrifugation of full-length BECN1 at 10.3 μM, SEC-MALS data of full-length BECN1, CD thermal melts of full-length BECN1 with varying salt concentrations, biophysical analysis of the BECN1-265 and BARA constructs, line width and integration data for select 2D SOFAST-HMQC peaks of 15N-labeled BARA spectra, and sedimentation equilibrium analytical ultracentrifugation of the V250A/M254A/L261A mutant of full-length BECN1 (PDF)
ORCID
Matthew J. Ranaghan: 0000-0003-3572-5127
Author Contributions
MJ.R. cloned and purified all BECN1 proteins, purified Bcl-2, and performed all in vitro experiments. K.L.C. cloned the Bcl-2 construct. A.P.S. generated various BECN1 clones. M.A.D. and M.F.M. helped design, conduct, and analyze all NMR experiments. P.R.M. performed the molecular modeling of the BECN1 BARA domain. C.W.G., D.S.D., B.L., and J.R.P. initiated and supervised the project. All authors contributed to writing and proofreading the manuscript.
Notes
The authors declare no competing financial interest.
References
- 1.Feng Y, He D, Yao Z, Klionsky DJ. The machinery of Macroautophagy. Cell Res. 2014;24:24–41. doi: 10.1038/cr.2013.168. [DOI] [PMC free article] [PubMed] [Google Scholar]
- 2.Farre JC, Subramani S. Mechanistic insights into selective autophagy pathways: lessons from yeast. Nat Rev Mol Cell Biol. 2016;17:537–552. doi: 10.1038/nrm.2016.74. [DOI] [PMC free article] [PubMed] [Google Scholar]
- 3.Levine B, Kroemer G. Autophagy in the pathogenesis of disease. Cell. 2008;132:27–42. doi: 10.1016/j.cell.2007.12.018. [DOI] [PMC free article] [PubMed] [Google Scholar]
- 4.Gozuacik D, Kimchi A. Autophagy as a cell death and tumor suppressor mechanism. Oncogene. 2004;23:2891–2906. doi: 10.1038/sj.onc.1207521. [DOI] [PubMed] [Google Scholar]
- 5.Frake RA, Ricketts T, Menzies FM, Rubinsztein D. Autophagy and neurodegeneration. J Clin Invest. 2015;125:65–74. doi: 10.1172/JCI73944. [DOI] [PMC free article] [PubMed] [Google Scholar]
- 6.Rubinsztein DC, Marino G, Kroemer G. Autophagy and aging. Cell. 2011;146:682–695. doi: 10.1016/j.cell.2011.07.030. [DOI] [PubMed] [Google Scholar]
- 7.Netea-Maier RT, Plantinga TS, Van De Veerdonk FL, Smit JW, Netea MG. Modulation of inflammation by autophagy: consequences for human disease. Autophagy. 2016;12:245–260. doi: 10.1080/15548627.2015.1071759. [DOI] [PMC free article] [PubMed] [Google Scholar]
- 8.Yue Z, Jin S, Yang C, Levine AJ, Heintz N. Beclin 1, an autophagy gene essential for early embryonic development, is a haploinsufficient tumor suppressor. Proc Natl Acad Sci U S A. 2003;100:15077–15082. doi: 10.1073/pnas.2436255100. [DOI] [PMC free article] [PubMed] [Google Scholar]
- 9.Morris DH, Yip CK, Shi Y, Chait BT, Wang QJ. Beclin-1/VPS34 Complex Architechture: Understanding the Nuts and Bolts of Therapeutic Targets. Front Biol (Beijing, China) 2015;10:398–426. doi: 10.1007/s11515-015-1374-y. [DOI] [PMC free article] [PubMed] [Google Scholar]
- 10.Lee EF, Perugini MA, Pettikiriarachchi A, Evangelista M, Keizer DW, Yao S, Fairlie WD. The BECN1 N-terminal domain is intrinsically disordered. Autophagy. 2016;12:460–471. doi: 10.1080/15548627.2016.1140292. [DOI] [PMC free article] [PubMed] [Google Scholar]
- 11.Mei Y, Ramanathan A, Glover K, Stanley C, Sanishvili R, Chakravarthy S, Yang Z, Colbert CL, Sinha SC. Conformational Flexibility Enables the Function of a BECN1 Region Essential for Starvation-Mediated Autophagy. Biochemistry. 2016;55:1945–1958. doi: 10.1021/acs.biochem.5b01264. [DOI] [PMC free article] [PubMed] [Google Scholar]
- 12.Li X, He L, Che KH, Funderburk SF, Pan L, Pan N, Zhang M, Yue Z, Zhao Y. Imperfect interface of Beclin1 coiled-coil domain regulates homodimer and heterodimer formation with Atg14L and UVRAG. Nat Commun. 2012;3:662–672. doi: 10.1038/ncomms1648. [DOI] [PMC free article] [PubMed] [Google Scholar]
- 13.Mei Y, Su M, Sanishvili R, Chakravarthy S, Colbert CL, Sinha SC. Identification of BECN1 and ATG14 Coiled-Coil Interface Residues That Are Important for Starvation-Induced Autophagy. Biochemistry. 2016;55:4239–4253. doi: 10.1021/acs.biochem.6b00246. [DOI] [PMC free article] [PubMed] [Google Scholar]
- 14.Huang W, Choi W, Hu W, Mi N, Guo Q, Ma M, Liu M, Tian Y, Lu P, Wang FL, Deng H, Liu L, Gao N, Yu L, Shi Y. Crystal structure and biochemical analyses reveal Beclin 1 as a novel membrane binding protein. Cell Res. 2012;22:473–489. doi: 10.1038/cr.2012.24. [DOI] [PMC free article] [PubMed] [Google Scholar]
- 15.Furuya N, Yu J, Byfield M, Pattingre S, Levine B. The evolutionarily conserved domain of Beclin 1 is required for Vps34 binding, autophagy and tumor suppressor function. Autophagy. 2005;1:46–52. doi: 10.4161/auto.1.1.1542. [DOI] [PubMed] [Google Scholar]
- 16.Noda NN, Kobayashi T, Adachi W, Fujioka Y, Ohsumi Y, Inagaki F. Structure of the novel C-terminal domain of vacuolar protein sorting 30/autophagy-related protein 6 and its specific role in autophagy. J Biol Chem. 2012;287:16256–16266. doi: 10.1074/jbc.M112.348250. [DOI] [PMC free article] [PubMed] [Google Scholar]
- 17.Hurley JH, Schulman BA. Atomistic Autophagy: The Structures of Cellular Self-Digestion. Cell. 2014;157:300–311. doi: 10.1016/j.cell.2014.01.070. [DOI] [PMC free article] [PubMed] [Google Scholar]
- 18.Ku B, Woo JS, Liang C, Lee KH, Hong HS, E X, Kim KS, Jung JU, Oh BH. Structural and biochemical bases for the inhibition of autophagy and apoptosis by viral Bcl-2 of murine gamma-herpesvirus 68. PLoS Pathog. 2008;4:e25. doi: 10.1371/journal.ppat.0040025. [DOI] [PMC free article] [PubMed] [Google Scholar]
- 19.Oberstein A, Jeffrey PD, Shi Y. Crystal structure of the Bcl-xL-Beclin 1 peptide complex: Beclin 1 is a novel BH3-only protein. J Biol Chem. 2007;282:13123–13132. doi: 10.1074/jbc.M700492200. [DOI] [PubMed] [Google Scholar]
- 20.Levine B, Liu R, Dong X, Zhong Q. Beclin orthologs: Integrative hubs of cell signaling, membrane trafficking, and physiology. Trends Cell Biol. 2015;25:533–544. doi: 10.1016/j.tcb.2015.05.004. [DOI] [PMC free article] [PubMed] [Google Scholar]
- 21.Dreux F, Chisari FV. Viruses and the autophagy machinary. Cell Cycle. 2010;9:1295–1307. doi: 10.4161/cc.9.7.11109. [DOI] [PubMed] [Google Scholar]
- 22.Orvedahl A, Levine B. Viral evasion of autophagy. Autophagy. 2008;4:280–285. doi: 10.4161/auto.5289. [DOI] [PMC free article] [PubMed] [Google Scholar]
- 23.Maiuri MC, Le Toumelin G, Criollo A, Rain JC, Gautier F, Juin P, Tasdemir E, Pierron G, Troulinaki K, Tavernarakis N, Hickman JA, Geneste O, Kroemer G. Functional and physical interaction between Bcl-XL and a BH3-like domain in Beclin-1. EMBO J. 2007;26:2527–2539. doi: 10.1038/sj.emboj.7601689. [DOI] [PMC free article] [PubMed] [Google Scholar]
- 24.Zalckvar E, Berissi H, Mizrachy L, Idelchuk Y, Koren I, Eisenstein M, Sabanay H, Pinkas-Kramarski R, Kimchi A. DAP-kinase-mediated phosphorylation on the BH3 domain of beclin 1 promotes dissociation of beclin 1 from Bcl-xL and induction of autophagy. EMBO Rep. 2009;10:285–292. doi: 10.1038/embor.2008.246. [DOI] [PMC free article] [PubMed] [Google Scholar]
- 25.Maejima Y, Kyoi S, Zhai P, Liu T, Li H, Ivessa A, Sciarretta S, Del Re DP, Zablocki DK, Hsu CP, Lim DS, Isobe M, Sadoshima J. Mst1 inhibits autophagy by promoting the interaction between Beclin1 and Bcl-2. Nat Med. 2013;19:1478–1488. doi: 10.1038/nm.3322. [DOI] [PMC free article] [PubMed] [Google Scholar]
- 26.Wei Y, Pattingre S, Sinha S, Bassik M, Levine B. JNK1-mediated phosphorylation of Bcl-2 regulates starvation-induced autophagy. Mol Cell. 2008;30:678–688. doi: 10.1016/j.molcel.2008.06.001. [DOI] [PMC free article] [PubMed] [Google Scholar]
- 27.Noble CG, Dong JM, Manser E, Song H. Bcl-xL and UVRAG Cause a Monomer-Dimer Switch in Beclin1. J Biol Chem. 2008;283:26274–26282. doi: 10.1074/jbc.M804723200. [DOI] [PMC free article] [PubMed] [Google Scholar]
- 28.Rostislavleva K, Soler N, Ohashi Y, Zhang L, Pardon E, Burke JE, Masson GR, Johnson C, Steyaert J, Ktistakis NT, Williams RL. Structure and flexibility of the endosomal Vps34 complex reveals the basis of its function on membranes. Science. 2015;350:aac7365. doi: 10.1126/science.aac7365. [DOI] [PMC free article] [PubMed] [Google Scholar]
- 29.Baskaran S, Carlson LA, Stjepanovic G, Young LN, Kim DJ, Grob P, Stanley RE, Nogales E, Hurley JH. Architecture and dynamics of the autophagic phosphatidylinositol 3-kinase complex. eLife. 2014;3:e05115. doi: 10.7554/eLife.05115. [DOI] [PMC free article] [PubMed] [Google Scholar]
- 30.Glover K, Li Y, Mukhopadhyay S, Leuthner Z, Chakravarthy S, Colbert CL, Sinha S. Structural transitions in conserved, ordered Beclin-1 domains essential to regulating autophagy. J Biol Chem. 2017;292:16235–16248. doi: 10.1074/jbc.M117.804195. [DOI] [PMC free article] [PubMed] [Google Scholar]
- 31.Engler C, Gruetzner R, Kandzia R, Marillonnet S. Golden Gate Shuffling: A One-Pot DNA Shuffling Method Based on Type IIs Restriction Enzymes. PLoS One. 2009;4:e5553. doi: 10.1371/journal.pone.0005553. [DOI] [PMC free article] [PubMed] [Google Scholar]
- 32.Golovanov AP, Hautbergue GM, Wilson SA, Lian LY. A Simple Method for Improving Protein Solubility and Long-Term Stability. J Am Chem Soc. 2004;126:8933–8939. doi: 10.1021/ja049297h. [DOI] [PubMed] [Google Scholar]
- 33.Louis-Jeune C, Andrade-Navarro MA, Perez-Iratxeta C. Prediction of protein secondary structure from circular dichroism using theoretically derived spectra. Proteins: Struct, Funct, Genet. 2012;80:374–381. doi: 10.1002/prot.23188. [DOI] [PubMed] [Google Scholar]
- 34.Raussens V, Ruysschaert JM, Goormaghtigh E. Protein concentration is not an absolute prerequisite for the determination of secondary structure from circular dichroism spectra: A new scaling method. Anal Biochem. 2003;319:114–121. doi: 10.1016/s0003-2697(03)00285-9. [DOI] [PubMed] [Google Scholar]
- 35.Micsonai A, Wien F, Kernya L, Lee YH, Goto Y, Réfrégiers M, Kardos J. Accurate secondary structure prediction and fold recognition for circular dichroism spectroscopy. Proc Natl Acad Sci U S A. 2015;112:E3095–E3103. doi: 10.1073/pnas.1500851112. [DOI] [PMC free article] [PubMed] [Google Scholar]
- 36.Dam J, Velikovsky CA, Mariuzza RA, Urbanke C, Schuck P. Sedimentation Velocity Analysis of Heterogeneous Protein-Protein Interactions: Lamm Equation Modeling and Sedimentation Coefficient Distributions c(s) Biophys J. 2005;89:619–634. doi: 10.1529/biophysj.105.059568. [DOI] [PMC free article] [PubMed] [Google Scholar]
- 37.Vistica J, Dam J, Balbo A, Yikilmaz E, Mariuzza RA, Rouault TA, Schuck P. Sedimentation equilibrium analysis of protein interactions with global implicit mass conservation constraints and systematic noise decomposition. Anal Biochem. 2004;326:234–256. doi: 10.1016/j.ab.2003.12.014. [DOI] [PubMed] [Google Scholar]
- 38.Laue TM, Shah BD, Ridgeway TM, Pelletier SL. Analytical Ultracentrifugation. In: Harding SE, Rowe A, editors. Biochemistry and Polymer Science. Royal Society of Chemistry; Cambridge, U.K.: 1992. pp. 90–125. [Google Scholar]
- 39.Yphantis DA. Equilibrium Ultracentrifugation of Dilute Solutions. Biochemistry. 1964;3:297–317. doi: 10.1021/bi00891a003. [DOI] [PubMed] [Google Scholar]
- 40.Schuck P. Size distribution analysis of macromolecules by sedimentation velocity ultracentrifugation and Lamm equation modeling. Biophys J. 2000;78:1606–1619. doi: 10.1016/S0006-3495(00)76713-0. [DOI] [PMC free article] [PubMed] [Google Scholar]
- 41.Brautigam CA. Calculations and Publication-Quality Illustrations for Analytical Ultracentrifugation Data. Methods Enzymol. 2015;562:109–133. doi: 10.1016/bs.mie.2015.05.001. [DOI] [PubMed] [Google Scholar]
- 42.Marley J, Lu M, Bracken C. A method for efficient isotopic labeling of recombinant proteins. J Biomol NMR. 2001;20:71–75. doi: 10.1023/a:1011254402785. [DOI] [PubMed] [Google Scholar]
- 43.Schanda P, Brutscher B. Very Fast Two-Dimensional NMR Spectroscopy for Real-Time Investigation of Dynamic Events in Proteins on the Time Scale of Seconds. J Am Chem Soc. 2005;127:8014–8015. doi: 10.1021/ja051306e. [DOI] [PubMed] [Google Scholar]
- 44.Molecular Operating Environment (MOE) Chemical Computing Group; Montreal: 2017. version 2016.08. [Google Scholar]
- 45.Case DA, Betz RM, Botello-Smith W, Cerutti DS, Cheatham DE, III, Darden TA, Duke RE, Giese TJ, Gohlke H, Goetz AW, Homeyer N, Izadi S, Janowski P, Kaus J, Kovalenko A, Lee TS, LeGrand S, Li P, Lin C, Luchko T, Luo R, Madej B, Mermelstein D, Merz KM, Monard G, Nguyen H, Nguyen HT, Omelyan I, Onufriev A, Roe DR, Roitberg A, Sagui C, Simmerling CL, Swails J, Walker RC, Wang J, Wolf RM, Wu X, Xiao L, York DM, Kollman PA. AMBER 2016. University of California; San Francisco: 2008. [Google Scholar]
- 46.Putnam FW. The Plasma Proteins: Structure, Function and Genetic Control. 2nd. Vol. 1. Academic Press; New York: 1975. [Google Scholar]
- 47.Greenfield N. Using circular dichroism collected as a function of temperature to determine the thermodynamics of protein unfolding and binding interactions. Nat Protoc. 2007;1:2527–2535. doi: 10.1038/nprot.2006.204. [DOI] [PMC free article] [PubMed] [Google Scholar]
- 48.Sinha S, Levine B. The autophagy effector Beclin 1: A novel BH3-only protein. Oncogene. 2008;27(Suppl 1):S137–S148. doi: 10.1038/onc.2009.51. [DOI] [PMC free article] [PubMed] [Google Scholar]
- 49.He C, Levine B. The Beclin 1 interactome. Curr Opin Cell Biol. 2010;22:140–149. doi: 10.1016/j.ceb.2010.01.001. [DOI] [PMC free article] [PubMed] [Google Scholar]
- 50.Maiuri MC, Zalckvar E, Kimchi A, Kroemer G. Self-eating and self-killing: crosstalk between autophagy and apoptosis. Nat Rev Mol Cell Biol. 2007;8:741–752. doi: 10.1038/nrm2239. [DOI] [PubMed] [Google Scholar]
- 51.Sinha SC, Colbert CL, Becker N, Wei Y, Levine B. Molecular basis of the regulation of Beclin 1-dependent autophagy by the γ-herpesvirus 68 Bcl-2 homolog M11. Autophagy. 2008;4:989–997. doi: 10.4161/auto.6803. [DOI] [PMC free article] [PubMed] [Google Scholar]
- 52.Mei Y, Glover K, Su M, Sinha SC. Conformational flexibility of BECN1: Essential to its key role in autophagy and beyond. Protein Sci. 2016;25:1767–1785. doi: 10.1002/pro.2984. [DOI] [PMC free article] [PubMed] [Google Scholar]
Associated Data
This section collects any data citations, data availability statements, or supplementary materials included in this article.