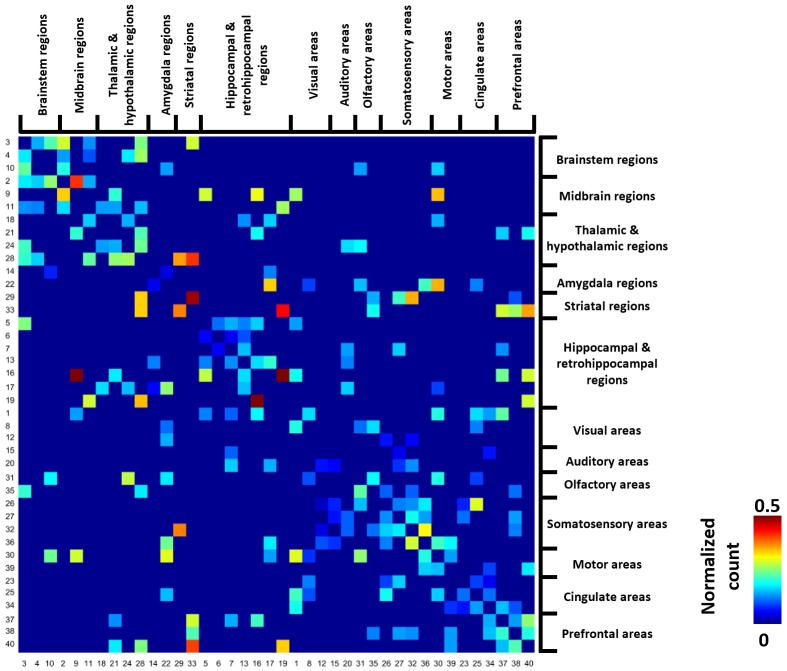
Figure 4. Thresholded group-level RSFC pattern transition matrix after regression of RSFC pattern similarities.
Rows/columns are arranged based on the brain system of the seed regions. Numbers next to/below rows/columns correspond to the seed map number in Figure 2 and Figure 2—figure supplement 1.

