. 2018 Feb 27;7:e31949. doi: 10.7554/eLife.31949

Figure 4. Experiment 2: behavioural results.

(a) Model comparison showed that TD model fitted choices best (Bayesian: hierarchical Bayesian model, HMM: hidden Markov model, Hybrid: action-learning model with associability as changing learning rate). (b) SCRs measured on the side with thermal stimulation (‘Stim side’, left hand) were lower than those on without stimulation (‘Non-stim side’, right hand), but both were highly correlated. (c) Associability from state-learning hybrid model fit SCRs best, similarly to Experiment 1. (d) Trial-by-trial associability from hybrid model fitted pain ratings best compared with other uncertain measures (entropy: HMM entropy, surprise: TD model prediction error magnitude from previous trial, null model: regression with no predictors). (e) Regression coefficients with associability as uncertainty predictor were significantly negative across subjects.

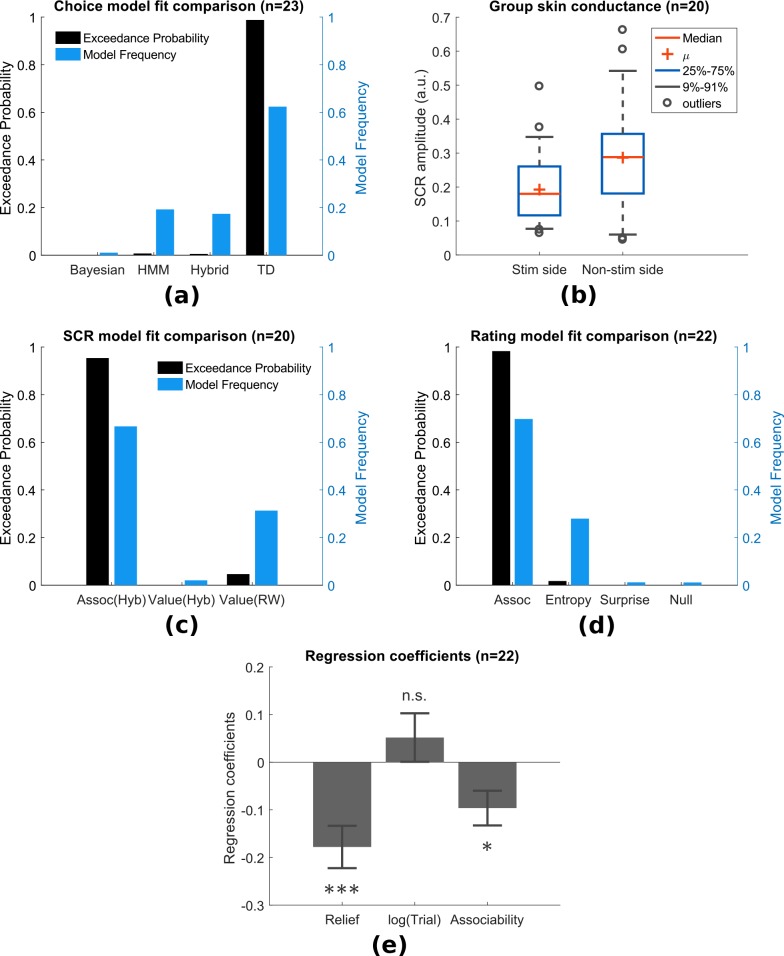
Figure 4—source data 1. Experiment 2: behavioural data including SCRs, choices, ratings can be found in zip file attached.
DOI: 10.7554/eLife.31949.016

Figure 4.

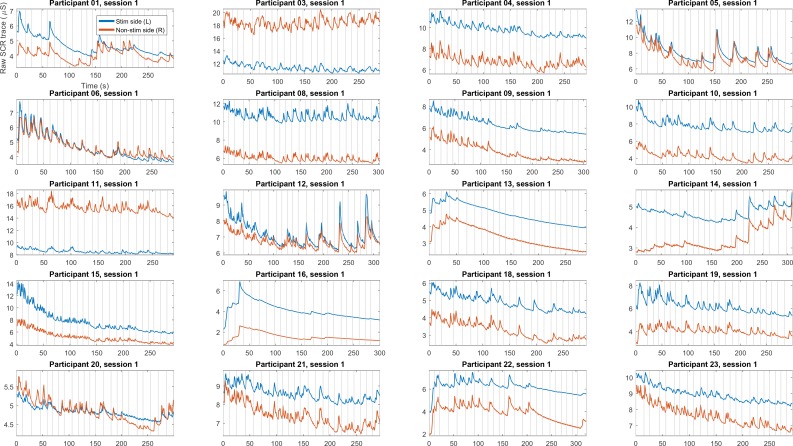
Figure 4—figure supplement 1. Experiment 2: raw skin conductance traces, where vertical lines are beginning of each trial when cue display starts (n = 20, excluded participants not shown, showing first non-excluded session from all participants).

Figure 4—figure supplement 1.

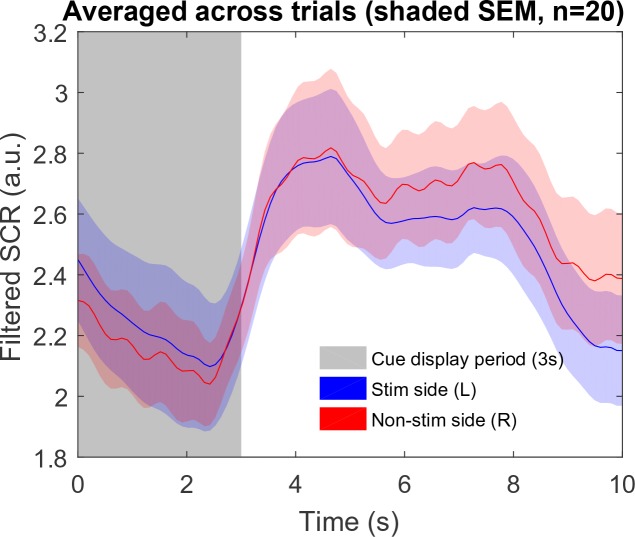
Figure 4—figure supplement 2. Experiment 2: filtered skin conductance traces (band-pass at 0.0159–2 Hz, 1 st order Butterworth), averaged across all trials within participant (n = 20, excluded participants not shown, shaded region represent SEM across all participants).

Figure 4—figure supplement 2.

In Experiment 2, pain ratings took place immediately after cue display period, with variable length of rating time (participant terminates rating whenever they finish). This increased time gap between cue display and outcome account for the second peak in trial averaged SCR trace.
Figure 4—figure supplement 3. Experiment 2: model protected exceedance probability.

Figure 4—figure supplement 3.

Choice, SCR, rating fitting all remain similar to original exceedance probability figures.