Abstract
Recent genetic studies have highlighted the potential involvement of melatonin receptor 1 (MT1) and melatonin receptor 2 (MT2) in the pathogenesis of type 2 diabetes. Here we report that mice lacking MT1 (MT1 KO) tend to accumulate more fat mass than WT mice and exhibit marked systemic insulin resistance. Additional experiments revealed that the main insulin signaling pathway affected by the loss of MT1 was the activation of phosphatidylinositol-3-kinase (PI3K). Transcripts of both catalytic and regulatory subunits of PI3K were strongly down-regulated within MT1 KO mice. Moreover, the suppression of nocturnal melatonin levels within WT mice, by exposing mice to constant light, resulted in impaired PI3K activity and insulin resistance during the day, similar to what was observed in MT1 KO mice. Inversely, administration of melatonin to WT mice exposed to constant light, was sufficient and necessary to restore insulin mediated PI3K activity and insulin sensitivity. Hence our data demonstrate that the activation of MT1 signaling at night modulates insulin sensitivity during the day via the regulation of the PI3K transcription and activity. Lastly we provide evidence that decreased expression of MTNR1A (MT1) in the liver of diabetic individuals is associated with poorly controlled diabetes.
Keywords: melatonin receptor 1, insulin sensitivity, PI3K, liver, metabolism
Introduction
The hormone melatonin is secreted by the pineal gland during the dark portion of the day and is considered one of the main hormonal signals through which external light information is communicated to the rest of the body1. Although classically known for its function in the regulation of reproductive cycles, recent studies have implicated melatonin in the timing of a number of different physiological processes2. Among these, perhaps one of the most surprising, is the role of melatonin in the regulation of blood glucose levels. Low levels of melatonin at night have been linked to metabolic abnormalities such as insulin resistance and type 2 diabetes (T2D)3,4. Moreover, the suppression of nocturnal melatonin by light at night, has been associated with several pathologies including T2D5,6.
Melatonin communicates nightly timing cues through the activation of two G-Protein coupled receptors (GPCRs) –Melatonin receptor 1 (MT1) and Melatonin receptor 2 (MT2). Both MT1 and MT2 have been shown to activate several signaling pathways, most notably the Gi/cAMP and Gq/Phospholipase C (PLC)/Ca2+ pathways1,7. These receptors are expressed in a number of different peripheral tissues, and as such, function to modulate multiple aspects of human physiology (reviewed in8). Recent genome-wide association studies have shown that polymorphisms in the genes encoding human melatonin receptors (MTNR1A and MTNR1B) are involved in the pathogenesis of T2D9–11. Variants in MTNR1B (MT2) have been linked to impairments in both insulin secretion and increased fasting glucose levels9,10, and variants in MTNR1A (MT1) have been shown to be associated with an increased risk of developing polycystic ovarian syndrome, an endocrine disorder marked by insulin resistance and T2D onset11,12. By re-sequencing the coding region of the MTNR1B gene coding for the MT2 receptor, 40 variants have been identified and functionally characterized. Corresponding mutants with impaired receptor signaling strongly associated with the T2D risk, indicating that loss of melatonin receptor function is positively associated with disease risk9,13. A recent study proposed that a common variant (rs10830963) of the MT2 receptor, which is associated with a modest increase in T2D risk might be associated with increased MT2 mRNA expression within pancreatic islets and more pronounced inhibition of insulin secretion14.
Despite this substantial genetic evidence linking melatonin receptors to diabetes, relatively few studies have characterized mechanisms underlying glucose homeostasis in melatonin receptor knock-out (KO) mice14–16. An early report demonstrated that mice lacking MT1 had higher mean blood glucose levels than wild type (WT) controls and mice lacking MT216. A subsequent investigation further established that MT1 KO mice are glucose intolerant and insulin resistant with respect to both WT and MT2 KO mice15. Finally, the recent study by Tuomi et al.14 reported that although MT2 KO mice did not show any significant differences in glucose tolerance, they exhibited slightly reduced hepatic insulin sensitivity with respect to WT mice. In the latter study tissue specific glucose metabolism was not characterized in MT1 KO mice.
To date the underlying mechanism by which MT1 KO mice develop insulin resistance remains largely unknown, and this is compounded by the fact this phenotype occurs during the day when melatonin- the endogenous ligand for MT1- is absent. The aim of the present study was thus to characterize glucose metabolism in MT1 KO mice, and investigate the mechanism by which the removal of MT1 impairs insulin responsiveness during the day.
Research Design & Methods
Animals
Melatonin proficient (C3H-f+/+; WT) and melatonin proficient mice lacking MT1 (C3H-f+/+; MT1 KO) were used in this study15. Mice (males, 3–5 months) were maintained in a 12-hour Light: Dark (LD) cycle (lights on at 6 am (denoted as Zeitgeber Time (ZT) 0) and lights off at 6pm (ZT12), food and water were available ad libitum. All experimental procedures were performed in accordance with the NIH Guide on Care and Use of Laboratory Animals and were approved by the Morehouse School of Medicine Animal Care and Use Committee.
Body composition and hyperinsulinemic- euglycemic clamp
Whole body fat mass and lean mass were noninvasively measured in awake mice fed a normal chow diet using 1H-MRS (Echo-MRI; Echo Medical Systems, Houston, TX). Hyperinsulinemic-euglycemic clamp studies were performed at the National Mouse Metabolic Phenotyping Center at UMass Medical School. Briefly, mice were fasted overnight (~15 hours), and a 2-hr hyperinsulinemic-euglycemic clamp was conducted in awake mice with a primed and continuous infusion of human insulin (150 mU/kg body weight priming followed by 2.5 mU/kg/min; Novolin, Novo Nordisk, Plainsboro, NJ)17. To maintain euglycemia, 20% glucose was infused at variable rates during clamps. Whole body glucose turnover was assessed with a continuous infusion of [3-3H]glucose (PerkinElmer, Waltham, MA), and 2-deoxy-D-[1-14C]glucose (2-[14C]DG) was administered as a bolus (10 µCi) at 75 min after the start of clamps to measure insulin-stimulated glucose uptake in individual organs. At the end of the clamps, mice were anesthetized, and tissues were taken for biochemical analysis as previously described17.
Lipid Analysis
Collected blood samples were centrifuged at 3000 g for 10 min and the obtained serum stored at −20 °C until assayed. Triglycerides, phospholipids, total cholesterol, and non-esterified fatty acids (NEFA) were analyzed spectrophotometrically (SEAC, Florence, Italy) following enzymatic hydrolysis. Briefly, triglycerides were quantified after enzymatic hydrolysis with lipoprotein lipases, phospholipids were quantified following enzymatic hydrolysis with phospholipase D (Centronic GmbH), and total cholesterol was assessed following enzymatic hydrolysis and oxidation. NEFA were measured enzymatically with a commercially available kit (Randox Laboratories). All samples were analyzed in duplicate.
Western Blot
Mice were fasted for 5 hrs before intraperitoneal (i.p) injection with 0.75 U/kg body weight of insulin (Humalog Lilly in 0.9% NaCl) during the day at ZT6, then sacrificed 0 min and 15 min post insulin injection. Skeletal muscle, adipose tissue, and liver tissue were collected at each time point and homogenized in lysis buffer (Invitrogen). Following gel electrophoresis and western blotting, immuno-complexes were visualized using antibodies directed against phospho-AKT (T308) (Cell Signaling Technology # 2965), total AKT (Cell Signaling Technology # 2960), phospho-ERK (Thr202/Tyr204) (Cell Signaling Technology #4370), and total ERK (Cell Signaling Technology # 9102). Bands were developed using nonradioactive enhanced chemiluminescence system (ECL) and optical densitometry was performed using NIH ImageJ software.
Glucose Tolerance Test and Insulin Tolerance Test
WT mice were separated into 3 groups: (1) mice which were kept in the acclimation conditions of 12L:12D; (2) mice which were exposed to LAN (300–400 lux); and (3) mice exposed to LAN with melatonin in the drinking water (dissolved in ethanol and diluted 1:1000 with water to a final concentration of 20 µg/ml) from ZT12 to ZT24. The day of the experiment mice were fasted for 5 h and at ZT 6 an intraperitoneal insulin tolerance test (IPITT), or intraperitoneal glucose tolerance test (IPGTT) was performed as previously described15.
Pyruvate tolerance tests (PTT) was performed by injecting (i.p.) 1.5 mg/g body weight of sodium pyruvate (20 % sodium pyruvate, Sigma).
Real Time Quantitative- RT-PCR (Q-PCR)
WT and MT1 KO mice were sacrificed every 3 hrs. from ZT1 to ZT22 and livers were collected and immediately frozen. The daily rhythm in the expression of the regulatory (p50, p55 and p85) and the catalytic subunits (p110α and p110β) that form the PI3K enzyme was determined by quantitative RT-PCR, using specific primers (Table S1). Total RNA extraction (Life Technologies), DNase treatment (Promega), reverse transcription was performed on 1 µg of RNA using a High-Capacity RNA-to-cDNA Kit (Life Technologies) and Q-PCR reactions (iQ SYBR Green Supermix; Bio-Rad Laboratories) were carried out as previously described18.
Study of PI3K activity by measuring PIP3 formation
Mice were injected i.p. with either vehicle (NaCl 0.9%) or insulin (0.75 U/kg body weight; Humalog) and 15 min after the injection, were anesthetized with isoflurane and perfused with 4 % paraformaldehyde. The livers were then explanted and kept overnight in paraformaldehyde. The samples were then transferred to a 30% sucrose solution to cryoprotect the tissue and thereafter the samples were imbedded in TissueTek and sectioned at 12 µm using a cryostat. Sections were mounted onto Histobond+ slides (VWR).
PIP3 levels in the liver were determined using the Mouse on Mouse (M.O.M.) detection Kit following the manufacturer’s protocol (Vector Laboratories) as previously described19. Samples were blocked with the MOM Mouse IgG blocking reagent for 1h and treated with MOM diluent for 5 min. The slides were then incubated for 30 min with the primary antibody (mouse anti-PIP3; Echelon Biosciences Inc.) diluted 1:10 in MOM mouse diluent. Following this, samples were incubated for 10 min with the MOM biotinylated anti-mouse IgG solution and the secondary antibody (DyLight Streptavidin 488: Vector Laboratories) was added for 1h. Finally, slides were coverslipped with Vectashield and observed with a confocal microscope (Zeiss LSM700).
Detection of MT1 mRNA
RNA extraction (TRI® Reagent method, DNase treatment (Promega), cDNA synthesis and conventional PCR (One Step SYBR® PrimeScript™ RT-PCR kit II, Takara) reactions were carried out following manufacturer instructions. A quantity of 200 ng of RNA was used to perform the one step PCR reactions that were developed in a final volume of 50 µl. The resulting PCR product (expected sizes are 137 and 123 bp for MT1 and 18S, respectively) was run in an agarose 1.5% TAE gel and visualize by using the EZvision kit (Amresco) in an UV transilluminator.
Gene Expression Ominbus (GEO) Analysis
To investigate the clinical implications of MT1 in the regulation of insulin sensitivity, we utilized the GEO software available through NCBI to browse datasets related to insulin resistance and diabetes. From the sets identified, microarray dataset GDS3876 was chosen based on tissue specific examination of the liver and its inclusion of both diabetic and non-diabetic samples. Within this cohort obese subjects were significantly more insulin resistant than lean controls. For more details on the clinical features of this cohort please refer to ref (25). To determine the correlation of melatonin expression levels with clinical features such obesity and disease state, the GEO profile was queried for dataset-specific gene expression profiles for MTNR1A (MT1), then stratified according to individual phenotype (lean; obese) and disease state (non-T2D, T2D well controlled (T2D WC), T2D poorly controlled (T2D PC).
Data analysis
Results are presented as mean ± standard error of the mean (SEM) and were considered significant when p<0.05. COSINOR analysis was done using the nonlinear regression model within SigmaPlot V 10.0 (Systat Software, San Jose, CA, USA as described in18. Statistical analysis was performed using the Students t test or a one-way analysis of variance (ANOVA) and post-hoc Holm-Sidak test.
Results
MT1 KO mice exhibit systemic insulin resistance in the absence of dyslipidemia
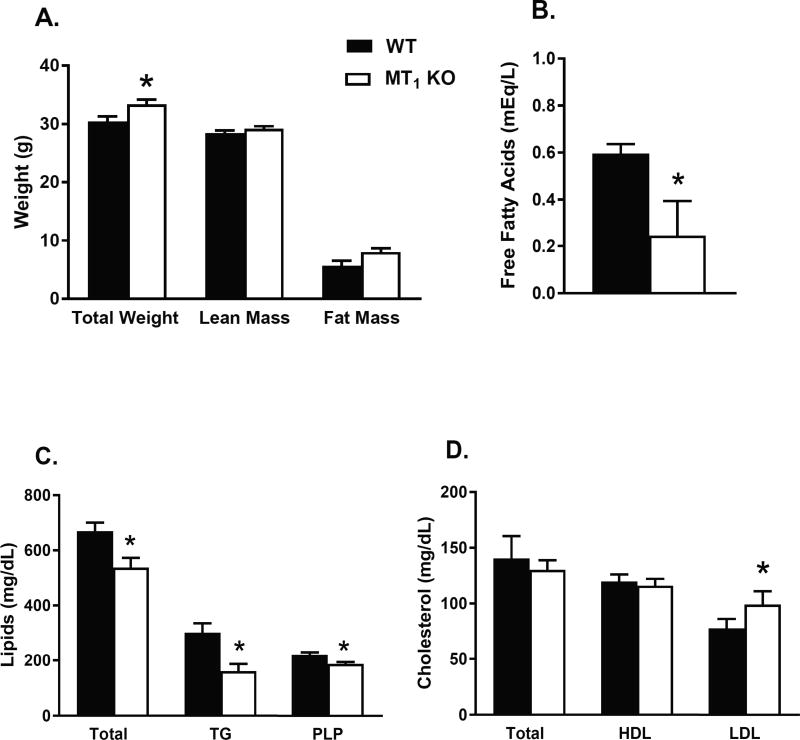
Increased adiposity has been linked to insulin resistance and abnormal glucose metabolism17. Therefore, we first examined the relationship between fat mass and insulin sensitivity in WT and MT1 KO mice. MT1 KO mice had slightly higher body weight (10%) than WT mice (Fig. 1A). This was largely due to increased fat mass (30%, p < 0.052) in MT1 KO mice since whole body lean mass did not differ between groups. Increased obesity in MT1 KO mice was not attributed to changes in physical activity or daily food intake20. Subsequent analysis of plasma lipids in MT1 KO mice revealed significantly lower levels of triglycerides, phospholipids, and free fatty acids, in the presence of moderately elevated LDL cholesterol levels (Fig. 1B–D). These alterations do not align with the typical dyslipidemic profile commonly associated with insulin resistance21,22, and collectively suggest that the deletion of MT1 beneficially affects lipid metabolism.
Fig 1. Altered Lipid Metabolism in MT1 KO mice.
(A) Total body weight, whole body lean mass, and fat mass were assessed in 4–5-month-old WT and MT1 KO mice. Lipid parameters were measured in the plasma of WT and MT1 KO mice fed a normal chow diet. (B) Free Fatty Acids (C) Total Lipid, Triglycerides (TG), Phospholipids (PLP) (D) Total Cholesterol, HDL Cholesterol, LDL Cholesterol. Results are expressed as mean ± SEM (n=5–7; students t-test *p<0.05).
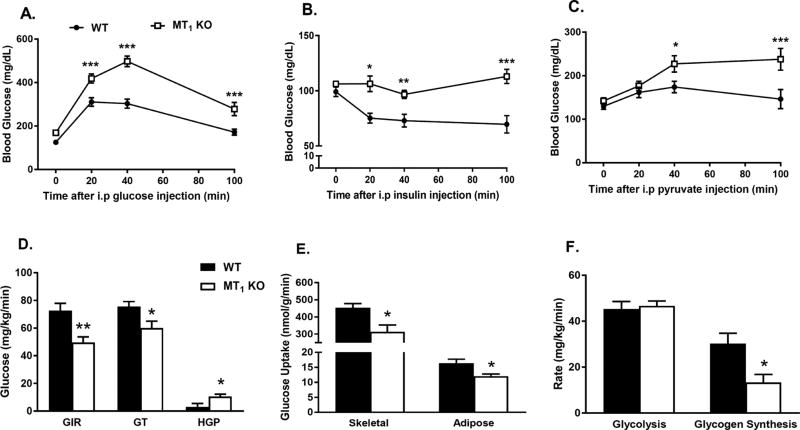
To gain a better understanding of the mechanisms underlying insulin resistance in MT1 KO mice, we performed hyperinsulinemic-euglycemic clamp studies in WT and MT1 KO mice (see Figure 2D–F and Table S2). MT1 KO mice required a substantially lower glucose infusion rate (GIR) to maintain euglycemia during the clamp and exhibited decreased rates of glucose turnover compared to WT mice (Fig. 2D). At the tissue level, decreased insulin sensitivity in MT1 KO mice was mostly attributed to significant reductions in insulin-stimulated glucose uptake in skeletal muscle and white adipose tissue (Fig. 2E). Additionally, pyruvate tolerance as well as insulin-mediated suppression of hepatic glucose production (HGP) during the clamp were significantly impaired in MT1 KO mice (Fig. 2C & 2D). Consistent with a classical insulin resistant phenotype, MT1 KO mice also exhibited substantial impairments in whole body glycogen synthesis (Fig. 2F). Taken together these data point to the existence of a generalized mechanism by which the loss of MT1 affects insulin sensitivity in multiple insulin-responsive organs.
Fig 2. Loss of MT1 induces systemic insulin resistance.
(A) IPGTT test and (B) IPITT in WT and MT1 KO showing impaired glucose tolerance and decreased insulin sensitivity in MT1 KO mice at ZT6. (C) PTT was also significantly affected in MT1 KO mice. Results are expressed as mean ± SEM (n=5–7; 2-WAY ANOVA (post-hoc: Holm-Sidak) *p<0.05; **p<0.01, ***p<0.001). (D) Hyperinsulinemic-euglycemic clamp in awake mice. GIR: Glucose Infusion Rate, Rd: Whole Body Glucose Turnover, HGP: Hepatic Glucose Production. (E) Insulin-stimulated glucose uptake in skeletal muscle (gastrocnemius) and white adipose tissue (epidydimal) (F) Whole body glycolysis and glycogen synthesis. Results are expressed as mean ± SEM (n=5–7; t-tests*p<0.05; **p<0.01).
MT1 KO mice exhibit impaired insulin signaling in vivo
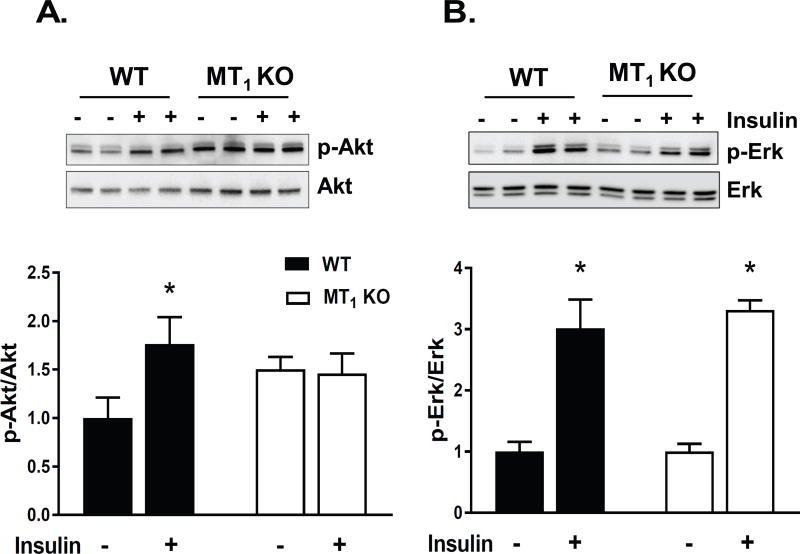
One of the driving forces for the alteration of the glucose control in MT1 KO mice was the loss of insulin sensitivity within the liver – as demonstrated by the complete inability of MT1 KO mice to suppress hepatic glucose production (Fig 2D). To determine how the loss of MT1 could generate such generalized systemic impairments in insulin sensitivity, we next investigated whether these defects were directly linked to alterations in the insulin signaling pathway in the liver where MT1 receptors are expressed (see Fig 1S). To test this hypothesis, we evaluated the activation of two key downstream effectors of insulin signaling- protein kinase B (AKT) and extracellular signal regulated kinase (ERK)- within the liver. As shown in Fig. 3, the phosphorylation (Threonine 308) of AKT in response to an i.p. injection of insulin (0.75 units/kg) at ZT6 was significantly impaired within liver of MT1 KO mice; whereas there were no clear differences in the activation of the phospho-ERK pathway in response to insulin. Hence our data suggest that the loss of MT1 impairs the ability of insulin to activate the AKT pathway within the liver.
Fig 3. MT1 KO mice exhibit impaired insulin signaling in vivo.
Insulin sensitive tissues from WT, and MT1 KO mice were collected 0 and 15 min post insulin injection (n=3–5) at ZT6. Immunoblotting was performed to quantify the relative amount of p-AKT(Thr308), and Total AKT. Representative blots are shown for (A) Adipose tissue, (B) Liver, and (C) Skeletal Muscle. Corresponding densitometric quantification plots for p-AKT/AKT are shown in the bottom panels. Results are expressed as mean ± SEM (n=4–5; t-tests *p<0.05).
Loss of MT1 affects PI3K activity and the transcription of the genes encoding regulatory and catalytic subunits of PI3K
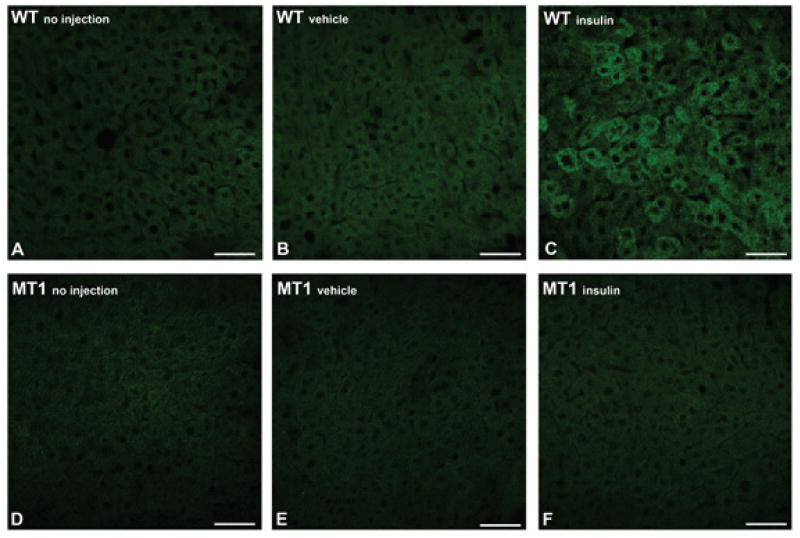
Given the central role of liver in the maintenance of glucose homeostasis23, we further investigated whether the impairment in the activation of the insulin signaling pathway could be detected upstream of AKT, at the level of phosphatidylinositol-3-kinase (PI3K). In response to insulin, PI3K generates phosphatidylinositol-3,4,5-trisphosphate (PIP3), a second messenger essential for both the plasma membrane translocation and activation of AKT24. To evaluate PI3K activity, WT and MT1 KO mice were injected with insulin or vehicle during the day at ZT6 and the activity of PI3K – measured as PIP3 production – was assessed within the liver 15 min. post insulin injection. As shown in Fig. 4, PIP3 production showed an increase in WT but not in MT1 KO mice. Vehicle injection did not affect PIP3 production within either genotype (Fig. 4).
Fig 4. Impaired PIP3 activation within the liver of MT1 KO mice.
PIP3 formation was assessed within the liver of WT and MT1 KO mice following insulin injection. Mice were injected either with (B;E) vehicle or (C;F) insulin (0.75 U/kg body weight) at ZT 6 and PIP3 formation was measured by IHC in livers obtained 15 min after the injection. Similar results have been obtained in at least 3 independent samples per group.
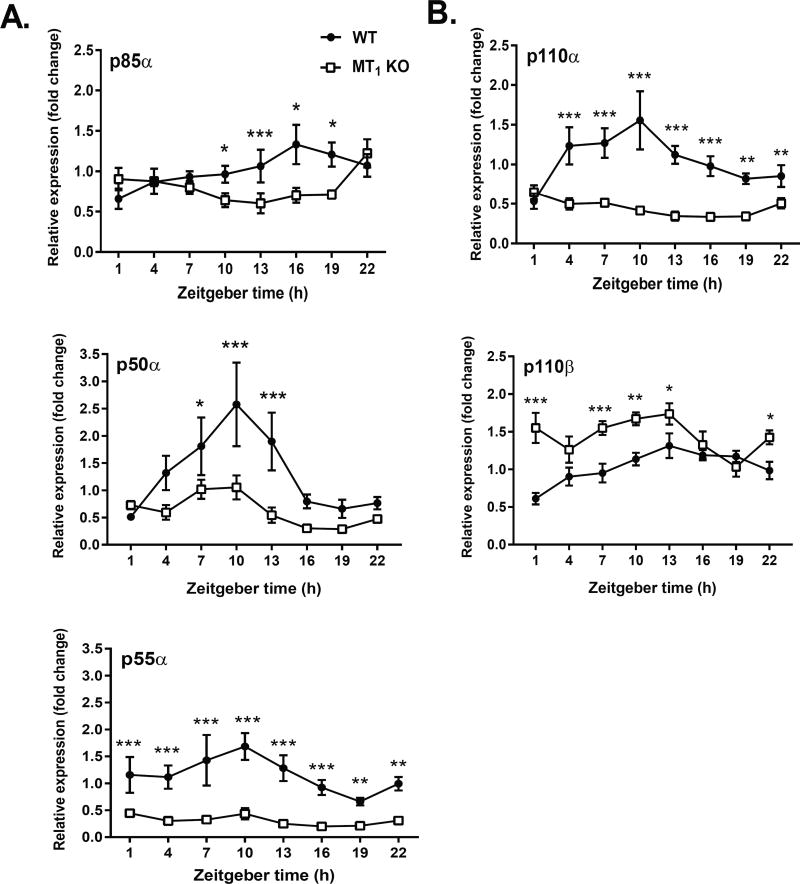
At this point it was unclear whether MT1 could directly regulate the activation of PI3K; or given its nocturnal activation profile, possibly confer more indirect effects by regulating steady state transcriptional levels of PI3K. Hence to investigate whether the regulation of PI3K by MT1 occurs at the transcriptional level, we examined the daily rhythm in the 5 subunits (p50α, p55α, p85α, p110α, p110β) which compose PI3K24. Our data indicate that within MT1 KO mice p50α, p55α, p85α, and p110α mRNA levels were no longer rhythmic and significantly reduced (Fig. 5 and Table S3). Interestingly, steady state levels of the p110β subunit were increased by the deletion of MT1. Collectively these data suggest that MT1 regulates PI3K- at least in part- via the transcriptional regulation of its catalytic and regulatory subunits.
Fig 5. Loss of MT1 Abolishes Daily Rhythms in PI3K Regulatory and Catalytic Subunits.
The daily rhythm of PI3K regulatory (Panel A) and catalytic (Panel B) subunits was assessed within the livers of WT and MT1 KO mice. Dark circles (●) correspond to WT mice and white circles (○) to MT1 KO mice. Results are expressed as mean ± SEM. (n=6) in relative units (ΔΔCt method).
The nocturnal rise in melatonin levels is necessary and sufficient for the modulation of insulin sensitivity during the day
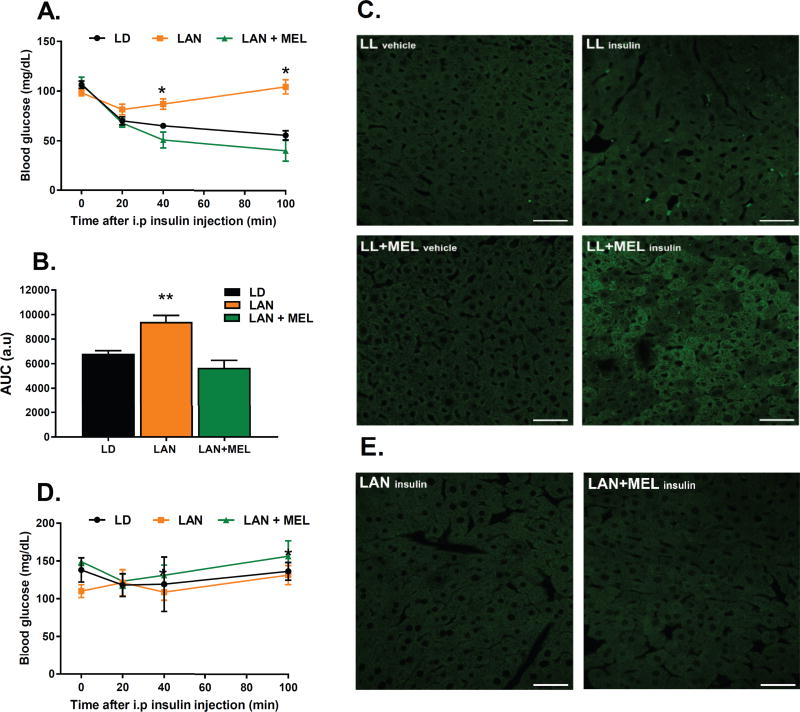
The fact that the insulin signaling is affected in MT1 KO mice during the light period, when melatonin levels in the blood are undetectable, prompted us to investigate whether the activation of MT1 signaling at night is required and sufficient to modulate insulin signaling during the day. To determine whether the presence of the nocturnal peak in melatonin level at night is required to modulate insulin sensitivity during the day, we exposed WT mice to light during the night (LAN) in order to inhibit nocturnal melatonin synthesis5, and then on the following day performed an IPITT at ZT 6. As shown in Fig. 6, WT mice exposed to LAN showed a significant decrease in insulin sensitivity that mimics what was observed in MT1 KO mice (Figs. 2B and 4). To determine if the activation of MT1 at night was sufficient to modulate insulin sensitivity during the day (i.e., to exclude that the exposure to light would have an effect on insulin sensitivity independently from melatonin), we exposed WT mice to LAN again, but this time we supplemented the drinking water with melatonin (20 µg/ml) during the night (from ZT12 to ZT0) to restore the nocturnal peak in melatonin levels. As shown in Figure 6, the supplementation with melatonin of mice exposed to constant light during the night restored insulin sensitivity, the next day at ZT6, to the same magnitude as WT mice exposed to a normal dark-light cycle.
Fig 6. The Nocturnal Rise in Melatonin is Sufficient and Necessary to Modulate Insulin Sensitivity during the Day.
WT mice were exposed to LD, LAN or LAN+MEL for 24 h. (A) IPITT test was performed on ZT 6 of the following day. Data obtained are expressed as mean ± SEM. (n=7–10). When significant (ANOVA p<0.05), differences among groups are indicated by an asterisk (Holm-Sidak test). (B) Calculated Area Under the Curve (AUC) for IPITT’s. (C) WT mice were injected with either vehicle or insulin (0.75 U/kg body weight) at ZT 6 and PIP3 formation was measured by IHC in livers obtained 15 min after the injection. (D) IPITT performed in MT1KO mice exposed to LD, LAN or LAN+MEL for 24 h. (E) MT1 KO mice injected with insulin (0.75 U/kg body weight) at ZT 6 and PIP3 formation was measured by IHC in livers obtained 15 min after the injection. (n=3–6 for each time point and genotype).
We then investigated whether the changes in insulin sensitivity were linked to changes in PI3K activity. As shown in Fig. 6C, insulin injection failed to increase PIP3 production in WT mice exposed to LAN; whereas insulin injection in WT mice exposed to LAN, with melatonin supplementation, induced an increase in the PIP3 production (Fig. 6C). Exposure to LAN and LAN plus melatonin in MT1 KO did not produce any changes in the IPITT or PI3K (Fig. 6D, 6E).
MTNR1A mRNA levels are reduced in the liver of diabetic patients
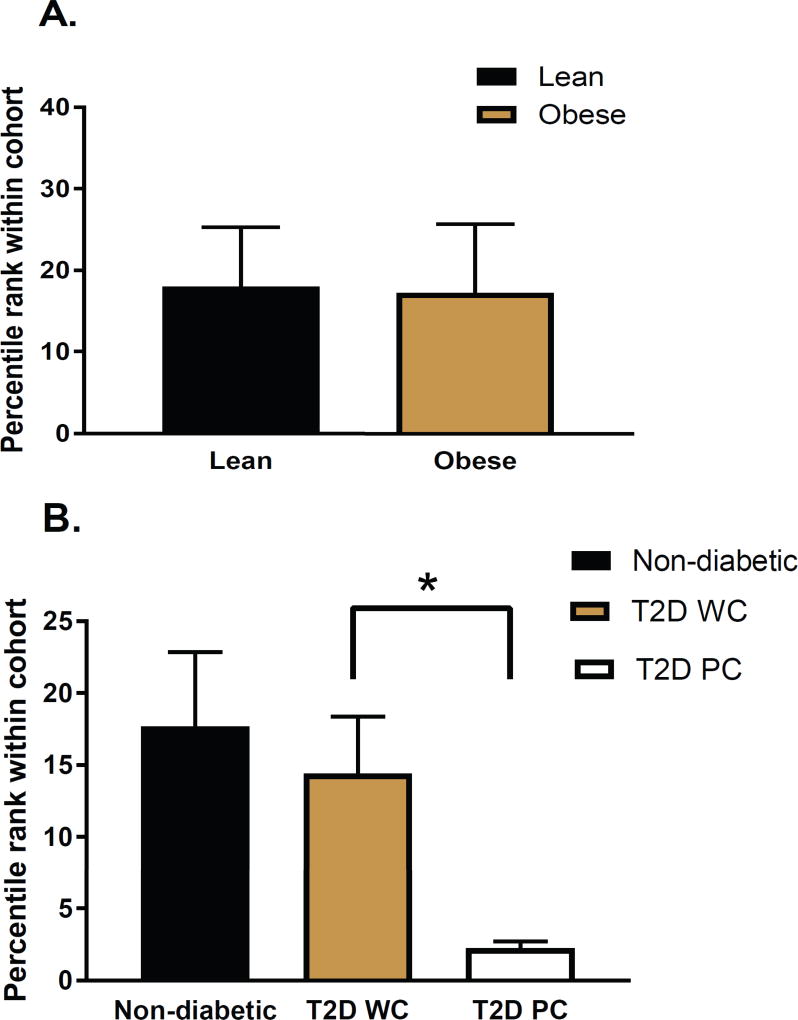
Lastly we investigated whether MT1 gene expression was affected in insulin resistant/T2D individuals. Using the GEO microarray dataset GDS387625, we were able to generate an expression profile for MTNR1A (MT1) in the liver of non-T2D and T2D individuals. The most striking finding from this analysis was that liver MTNR1A expression levels were significantly reduced in T2D patients with poorly controlled diabetes (HbA1c > 7.9; fasting glucose > 9 (mmol/liter), HOMA-IR > 20, see25 for details) (Fig 7B). Hence these data further suggest that the loss of MT1 signaling may also be involved in the regulation of glucose metabolism in humans.
Fig 7. MTNR1A mRNA is reduced in the liver of T2D patients with poorly controlled diabetes.
Microarray gene expression data were downloaded from the NCBI GEO database GDS3876. MTNR1A levels were assessed by comparing obesity (A) and disease state (B). T2D WC: T2D well controlled. T2D PC: T2D poorly controlled. *P<0.05, t-test (T2D WC vs. T2D PC). Lean (n=5), Obese (n=4), Non-diabetic (n=9), T2D WC (n=5), T2D PC (n=4)
Discussion
Type 2 diabetes is an endocrine disorder whose frequency has been increasing at alarming rates worldwide26. A number of studies have now linked melatonin receptors to the pathogenesis of T2D4,9–12,14, with the majority of these works identifying altered MT2 signaling as a significant risk factor for disease progression13. Currently, little is known about the role of MT1 in the regulation of glucose metabolism, or its direct involvement in the pathogenesis of T2D. To this end, we have previously reported that MT1 KO mice display impairments in glucose metabolism15,18, however the mechanisms underlying this phenotype remain poorly understood.
In the current study we sought to further dissect this phenotype by performing hyperinsulinemic-euglycemic clamp studies in WT and MT1 KO mice. Examination of tissue specific insulin action revealed that MT1 KO mice display systemic insulin resistance as demonstrated by a diminished insulin response in skeletal muscle, white adipose tissue, and the liver (Fig. 2). Notably the most striking effect was the inability of insulin to suppress hepatic glucose production (Fig. 2D). These changes in glucose metabolism were not accompanied by changes in fasting insulin or glucose levels (Table S2), suggesting a phenotype reflective of alterations in insulin sensitivity as opposed to insulin secretion.
Increased adipose mass affects insulin sensitivity by increasing free fatty acid flux to other metabolic organs thereby producing insulin resistance as a result of ‘lipotoxicity’27. Interestingly we observed a modest increase in weight and fat mass of MT1 KO mice. This result differs from earlier works which we and others reported no difference in weight among WT and MT1 KO mice15,16. The discrepancy appears to correlate with the age of the mice when the studies were conducted (3months vs. 5 months of age). Suggesting that the effect of MT1 on fat mass becomes more prominent as animals age. T2D has been associated with dyslipidemia marked by elevated free fatty acids and triglycerides, reduced HDL cholesterol, and an increased number of small dense LDL particles22. MT1 KO mice displayed significantly decreased levels of circulating triglycerides, phospholipids, and free fatty acids (Fig. 1). Therefore, although these mice exhibit clear alterations in their lipid profiles, it leans towards a more ‘beneficial’ lipid profile, and highlights a potential role for MT1 in lipoprotein metabolism. These results also indicate that insulin resistance in MT1 KO mice is not dependent on changes in lipid metabolism. Further studies would be needed to characterize the modest increase in LDL levels observed within MT1 KO mice.
AKT is a critical component of the insulin signaling pathway and as such is involved in the regulation of glucose metabolism28. Our data demonstrate that the loss of MT1 impairs the activation of AKT in key metabolic organs (i.e liver; Figure 3). Moreover, MT1 KO mice display stark impairments upstream of AKT at the level of PI3K activity and the transcriptional regulation of its subunits within the liver (Figs. 4 & 5). PI3K is composed of both regulatory (p85α, and p50α) and catalytic (p110α, p110β, and p100γ) subunits which combine to form a functional heterodimer. Within the body, the majority of tissues will express heterodimers composed of p85α and p110α22,24. A number of studies have now shed light on the relative importance of these subunits in the regulation of insulin sensitivity (24–26). Mice lacking p85α exhibit reduced PI3K activity in response to insulin19, whereas mice carrying a mutant copy of p110α (p110αD933A) are both insulin resistant and glucose intolerant29. Furthermore, when the gene encoding for p110α is conditionally inactivated within the liver, these mice display substantial impairment of AKT phosphorylation30. Subsequently, other studies have demonstrated that the lack of p110α in the liver had little effect on insulin sensitivity and glucose tolerance in mice31. Thus, our results demonstrating that the daily mRNA expression of p50α, p55α, p85α and p110α are no longer rhythmic and significantly down-regulated (Figure 5 and Table S3), establish that the lack of MT1 signaling affects the transcription of these subunits and may consequently lead to a non-optimal assembly of the PI3K complex.
Interestingly, the insulin resistant phenotype observed in MT1 KO mice was recapitulated in WT mice by inhibiting the nocturnal surge of melatonin through exposure to one night of LAN. This effect could subsequently be rescued by restoring nocturnal melatonin to physiological levels through melatonin supplementation in drinking water32. MT2 does not appear to be involved in this response, as MT2 KO mice do not show pronounced insulin resistance15. Collectively, these data indicate that the nocturnal surge of melatonin is both necessary and sufficient to modulate insulin sensitivity during the day. To date, only few studies have reported that melatonin is capable of providing a “dark priming” signal which can confer signaling outcomes long after melatonin is removed from circulation. Classical examples of this “dark priming mechanism” by melatonin are illustrated by the regulation of daily rhythms in disk shedding/phagocytosis within the retina33, and in the modulation of the daily rhythms in light-induced damage of retinal photoreceptors34. Moreover, within the pituitary, the nocturnal activation of MT1 receptors is necessary to sensitize the adenosine A2b receptor to effectively respond to adenosine during the day35. Our data for the first time highlight that such “dark priming mechanisms” may regulate insulin sensitivity, as all of the effects observed within MT1 KO mice occurred during the day in the absence of melatonin. This study also provides insight into a potential mechanism via which shift-work can result in the development of insulin resistance, obesity, and diabetes. Finally, our data demonstrate that a significant decrease in MTRN1A mRNA levels is present in diabetic patients with poor glucose control thus suggesting that human MT1 signaling may be involved in the control of glucose metabolism.
A recent human study observed that acute melatonin administration functions to worsen rather than improve glucose tolerance and insulin resistance36. This in contrast to what we observed in the current study, in which we found that in mice, nocturnal melatonin supplementation improved insulin sensitivity. We’ve demonstrated that melatonin likely imparts its effects on insulin sensitivity through a mechanism which involves nocturnal priming and long term transcriptional changes. Therefore, one may speculate that the immediate effects likely mediated by the direct activation of MT1 and MT2 receptors via melatonin may differ from transcriptional changes initiated long after receptor activation. Contrasting results from a number of studies comparing melatonin supplementation in humans vs. mice further serve to highlight the complexity of the melatonergic system. Indeed, it must be noted that in rodent’s melatonin secretion occurs during physical activity whereas in rodent’s it coincides with the sleep phase.
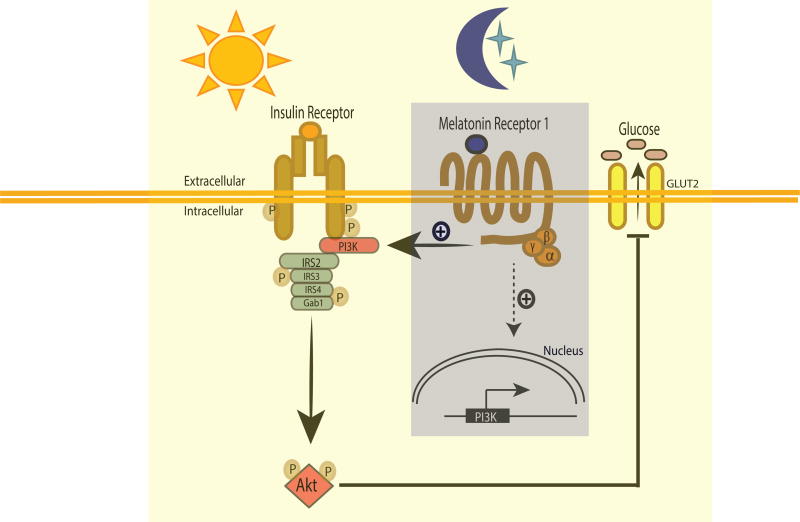
In conclusion, our data demonstrate that the nocturnal increase in melatonin levels and consequent activation of MT1 signaling modulate insulin sensitivity on the following day via the transcriptional regulation of PI3K subunits and thus PI3K activity (Fig 8). In addition, our studies underscore the complexity of the mammalian circadian system by demonstrating that dysfunction of the brain circadian system (i.e., the SCN, pineal, melatonin axis) is capable of producing significant effects in peripheral tissues even though circadian clocks within these tissues may appear to be unaffected.
Fig 8. Schematic model describing the possible pathway by which melatonin via MT1 modulates insulin sensitivity.
The nocturnal increases in melatonin levels during the night activated MT1 signaling which affect the transcription of the genes that are responsible for the assembly and the activity of P13K and thus glucose uptake.
Supplementary Material
Acknowledgments
This work was supported by: grants from the National Institutes of Health Grants EY022216, EY026291, T-32 HL103104 to G.T., SC2GM116760 to K.B. and by 5U54NS083932, S21MD000101, G12-RR03034, U54RR026137 to Morehouse School of Medicine; part of this study was performed at the National Mouse Metabolic Phenotyping Center at UMass and funded by an NIH grant (U2C-DK093000 to J.K.K.). This work was supported by the Agence Nationale de la Recherche (ANR-2011-BSV1-012-01 “MLT2D” and ANR-2011-META “MELA-BETES” to R.J.), the Fondation de la Recherche Médicale (Equipe FRM DEQ20130326503 to R.J.), Institut National de la Santé et de la Recherche Médicale (INSERM), Centre National de la Recherche Scientifique (CNRS) and the “Who am I?” laboratory of excellence No.ANR-11-LABX-0071 funded by the French Government through its “Investments for the Future” program operated by The French National Research Agency under grant No.ANR-11-IDEX-0005-01 (to J.D.).
Footnotes
Author Contributions
S.O. designed, performed experiments, analyzed data and wrote the paper, A.S-B. designed, performed experiments, analyzed data and wrote the paper; C.T. performed experiments, E.C. performed experiments, analyzed data and wrote the paper; A.K. designed, performed experiments, analyzed data and wrote the paper; J.D. designed, analyzed data and wrote the paper; R.J. designed experiments, analyzed data and wrote the paper; G.P. performed experiments, analyzed data and wrote the paper; H.LN. performed experiments and analyzed data; T.K. performed experiments and analyzed data; J.K.K. designed, analyzed data and wrote the paper; K.B. designed, performed experiments, analyzed data and wrote the paper; G.T. designed experiments, analyzed data and wrote the paper.
The authors declare that they do not have conflict of interest with the data presented in the manuscript.
References
- 1.Tosini G, Owino S, Guillaume JL, Jockers R. Understanding melatonin receptor pharmacology: latest insights from mouse models, and their relevance to human disease. Bioessays. 2014;36(8):778–787. doi: 10.1002/bies.201400017. [DOI] [PMC free article] [PubMed] [Google Scholar]
- 2.Dubocovich ML, Delagrange P, Krause DN, Sugden D, Cardinali DP, Olcese J. International Union of Basic and Clinical Pharmacology. LXXV. Nomenclature, classification, and pharmacology of G protein-coupled melatonin receptors. Pharmacol Rev. 2010;62(3):343–380. doi: 10.1124/pr.110.002832. [DOI] [PMC free article] [PubMed] [Google Scholar]
- 3.McMullan CJ, Curhan GC, Schernhammer ES, Forman JP. Association of nocturnal melatonin secretion with insulin resistance in nondiabetic young women. Am J Epidemiol. 2013;178(2):231–238. doi: 10.1093/aje/kws470. [DOI] [PMC free article] [PubMed] [Google Scholar]
- 4.McMullan CJ, Schernhammer ES, Rimm EB, Hu FB, Forman JP. Melatonin secretion and the incidence of type 2 diabetes. JAMA. 2013;309(13):1388–1396. doi: 10.1001/jama.2013.2710. [DOI] [PMC free article] [PubMed] [Google Scholar]
- 5.Gooley JJ, Chamberlain K, Smith KA, et al. Exposure to room light before bedtime suppresses melatonin onset and shortens melatonin duration in humans. J Clin Endocrinol Metab. 2011;96(3):E463–472. doi: 10.1210/jc.2010-2098. [DOI] [PMC free article] [PubMed] [Google Scholar]
- 6.Tan E, Scott EM. Circadian rhythms, insulin action, and glucose homeostasis. Curr Opin Clin Nutr Metab Care. 2014;17(4):343–348. doi: 10.1097/MCO.0000000000000061. [DOI] [PubMed] [Google Scholar]
- 7.Brydon L, Roka F, Petit L, et al. Dual signaling of human Mel1a melatonin receptors via G(i2), G(i3), and G(q/11) proteins. Mol Endocrinol. 1999;13(12):2025–2038. doi: 10.1210/mend.13.12.0390. [DOI] [PubMed] [Google Scholar]
- 8.Jockers R, Delagrange P, Dubocovich ML, et al. Update on melatonin receptors: IUPHAR Review 20. Br J Pharmacol. 2016;173(18):2702–2725. doi: 10.1111/bph.13536. [DOI] [PMC free article] [PubMed] [Google Scholar]
- 9.Bonnefond A, Clement N, Fawcett K, et al. Rare MTNR1B variants impairing melatonin receptor 1B function contribute to type 2 diabetes. Nat Genet. 2012;44(3):297–301. doi: 10.1038/ng.1053. [DOI] [PMC free article] [PubMed] [Google Scholar]
- 10.Bouatia-Naji N, Bonnefond A, Cavalcanti-Proenca C, et al. A variant near MTNR1B is associated with increased fasting plasma glucose levels and type 2 diabetes risk. Nat Genet. 2009;41(1):89–94. doi: 10.1038/ng.277. [DOI] [PubMed] [Google Scholar]
- 11.Li C, Shi Y, You L, Wang L, Chen ZJ. Melatonin receptor 1A gene polymorphism associated with polycystic ovary syndrome. Gynecol Obstet Invest. 2011;72(2):130–134. doi: 10.1159/000323542. [DOI] [PubMed] [Google Scholar]
- 12.Li C, Qiao B, Zhan Y, et al. Association between genetic variations in MTNR1A and MTNR1B genes and gestational diabetes mellitus in Han Chinese women. Gynecol Obstet Invest. 2013;76(4):221–227. doi: 10.1159/000355521. [DOI] [PubMed] [Google Scholar]
- 13.Bonnefond A, Karamitri A, Jockers R, Froguel P. The Difficult Journey from Genome-wide Association Studies to Pathophysiology: The Melatonin Receptor 1B (MT2) Paradigm. Cell Metab. 2016;24(3):345–347. doi: 10.1016/j.cmet.2016.08.015. [DOI] [PubMed] [Google Scholar]
- 14.Tuomi T, Nagorny CL, Singh P, et al. Increased Melatonin Signaling Is a Risk Factor for Type 2 Diabetes. Cell Metab. 2016;23(6):1067–1077. doi: 10.1016/j.cmet.2016.04.009. [DOI] [PubMed] [Google Scholar]
- 15.Contreras-Alcantara S, Baba K, Tosini G. Removal of melatonin receptor type 1 induces insulin resistance in the mouse. Obesity (Silver Spring) 2010;18(9):1861–1863. doi: 10.1038/oby.2010.24. [DOI] [PMC free article] [PubMed] [Google Scholar]
- 16.Muhlbauer E, Gross E, Labucay K, Wolgast S, Peschke E. Loss of melatonin signalling and its impact on circadian rhythms in mouse organs regulating blood glucose. Eur J Pharmacol. 2009;606(1–3):61–71. doi: 10.1016/j.ejphar.2009.01.029. [DOI] [PubMed] [Google Scholar]
- 17.Kim H-J, Higashimori T, Park S-Y, et al. Differential Effects of Interleukin-6 and -10 on Skeletal Muscle and Liver Insulin Action In Vivo. Diabetes. 2004;53(4):1060–1067. doi: 10.2337/diabetes.53.4.1060. [DOI] [PubMed] [Google Scholar]
- 18.Owino S, Contreras-Alcantara S, Baba K, Tosini G. Melatonin Signaling Controls the Daily Rhythm in Blood Glucose Levels Independent of Peripheral Clocks. PLoS One. 2016;11(1):e0148214. doi: 10.1371/journal.pone.0148214. [DOI] [PMC free article] [PubMed] [Google Scholar]
- 19.Winnay JN, Solheim MH, Dirice E, et al. PI3-kinase mutation linked to insulin and growth factor resistance in vivo. J Clin Invest. 2016;126(4):1401–1412. doi: 10.1172/JCI84005. [DOI] [PMC free article] [PubMed] [Google Scholar]
- 20.Fischer C, Mueller T, Pfeffer M, Wicht H, von Gall C, Korf HW. Melatonin Receptor 1-Deficiency Affects Feeding Dynamics and Pro-Opiomelanocortin Expression in the Arcuate Nucleus and Pituitary of Mice. Neuroendocrinology. 2016 doi: 10.1159/000448333. [DOI] [PubMed] [Google Scholar]
- 21.Krauss RM. Lipids and lipoproteins in patients with type 2 diabetes. Diabetes Care. 2004;27(6):1496–1504. doi: 10.2337/diacare.27.6.1496. [DOI] [PubMed] [Google Scholar]
- 22.Verges B. New insight into the pathophysiology of lipid abnormalities in type 2 diabetes. Diabetes Metab. 2005;31(5):429–439. doi: 10.1016/s1262-3636(07)70213-6. [DOI] [PubMed] [Google Scholar]
- 23.Muoio DM, Newgard CB. Mechanisms of disease:Molecular and metabolic mechanisms of insulin resistance and beta-cell failure in type 2 diabetes. Nat Rev Mol Cell Biol. 2008;9(3):193–205. doi: 10.1038/nrm2327. [DOI] [PubMed] [Google Scholar]
- 24.Vanhaesebroeck B, Stephens L, Hawkins P. PI3K signalling: the path to discovery and understanding. Nat Rev Mol Cell Biol. 2012;13(3):195–203. doi: 10.1038/nrm3290. [DOI] [PubMed] [Google Scholar]
- 25.Pihlajamaki J, Boes T, Kim EY, et al. Thyroid hormone-related regulation of gene expression in human fatty liver. J Clin Endocrinol Metab. 2009;94(9):3521–3529. doi: 10.1210/jc.2009-0212. [DOI] [PMC free article] [PubMed] [Google Scholar]
- 26.Hu FB. Globalization of diabetes: the role of diet, lifestyle, and genes. Diabetes Care. 2011;34(6):1249–1257. doi: 10.2337/dc11-0442. [DOI] [PMC free article] [PubMed] [Google Scholar]
- 27.Boden G. Obesity and free fatty acids. Endocrinol Metab Clin North Am. 2008;37(3):635–646. viii–ix. doi: 10.1016/j.ecl.2008.06.007. [DOI] [PMC free article] [PubMed] [Google Scholar]
- 28.Manning BD, Cantley LC. AKT/PKB signaling: navigating downstream. Cell. 2007;129(7):1261–1274. doi: 10.1016/j.cell.2007.06.009. [DOI] [PMC free article] [PubMed] [Google Scholar]
- 29.Foukas LC, Claret M, Pearce W, et al. Critical role for the p110alpha phosphoinositide-3-OH kinase in growth and metabolic regulation. Nature. 2006;441(7091):366–370. doi: 10.1038/nature04694. [DOI] [PubMed] [Google Scholar]
- 30.Sopasakis VR, Liu P, Suzuki R, et al. Specific roles of the p110alpha isoform of phosphatidylinsositol 3-kinase in hepatic insulin signaling and metabolic regulation. Cell Metab. 2010;11(3):220–230. doi: 10.1016/j.cmet.2010.02.002. [DOI] [PMC free article] [PubMed] [Google Scholar]
- 31.Jia S, Liu Z, Zhang S, et al. Essential roles of PI(3)K-p110beta in cell growth, metabolism and tumorigenesis. Nature. 2008;454(7205):776–779. doi: 10.1038/nature07091. [DOI] [PMC free article] [PubMed] [Google Scholar]
- 32.Grace MS, Chiba A, Menaker M. Circadian control of photoreceptor outer segment membrane turnover in mice genetically incapable of melatonin synthesis. Vis Neurosci. 1999;16(5):909–918. doi: 10.1017/s0952523899165106. [DOI] [PubMed] [Google Scholar]
- 33.Besharse JC, Dunis DA. Methoxyindoles and photoreceptor metabolism: activation of rod shedding. Science. 1983;219(4590):1341–1343. doi: 10.1126/science.6828862. [DOI] [PubMed] [Google Scholar]
- 34.Sugawara T, Sieving PA, Iuvone PM, Bush RA. The melatonin antagonist luzindole protects retinal photoreceptors from light damage in the rat. Invest Ophthalmol Vis Sci. 1998;39(12):2458–2465. [PubMed] [Google Scholar]
- 35.von Gall C, Garabette ML, Kell CA, et al. Rhythmic gene expression in pituitary depends on heterologous sensitization by the neurohormone melatonin. Nat Neurosci. 2002;5(3):234–238. doi: 10.1038/nn806. [DOI] [PubMed] [Google Scholar]
Associated Data
This section collects any data citations, data availability statements, or supplementary materials included in this article.


