Abstract
Purpose
The Cramér-Rao lower bound (CRLB) is widely used in the design of magnetic resonance experiments for parameter estimation. Previous work has considered only Gaussian or Rician noise distributions in this calculation. However, the noise distribution for multiple-coil acquisitions, such as in parallel imaging, obeys the noncentral χ-distribution under many circumstances. The purpose of this paper is to present the CRLB calculation for parameter estimation from multiple-coil acquisitions.
Theory and Methods
We perform explicit calculations of Fisher matrix elements and the associated CRLB for noise distributions following the noncentral χ-distribution. The special case of diffusion kurtosis is examined as an important example. For comparison with analytic results, Monte Carlo (MC) simulations were conducted to evaluate experimental minimum standard deviations (SDs) in the estimation of diffusion kurtosis model parameters. Results were obtained for a range of signal-to-noise ratios (SNRs), and for both the conventional case of Gaussian noise distribution and noncentral χ-distribution with different numbers of coils, m.
Results
At low-to-moderate SNR, the noncentral χ-distribution deviates substantially from the Gaussian distribution. Our results indicate that this departure is more pronounced for larger values of m. As expected, the minimum SDs (i.e. CRLB) in derived diffusion kurtosis model parameters assuming a noncentral χ-distribution provided a closer match to the MC simulations as compared to the Gaussian results.
Conclusion
Estimates of minimum variance for parameter estimation and experimental design provided by the CRLB must account for the noncentral χ-distribution of noise in multi-coil acquisitions, especially in the low-to-moderate SNR regime.
Keywords: Fisher Information, Cramér-Rao Lower Bound, Noncentral χ-distribution, Parallel imaging, Parameter estimation, Experimental design, Quantitative MRI
INTRODUCTION
Parameter estimation plays a fundamental role in quantitative magnetic resonance imaging (MRI) for the characterization of biological tissues. Accurate and precise determination of MR parameters, such as relaxation times and diffusion, from noisy datasets requires carful designs of the MR experiments. The Cramér-Rao lower bound (CRLB) is a standard tool that is widely used in the design of MR experiments for parameter estimation (1–16). CRLB defines the best achievable precision of any unbiased estimator for a deterministic parameter, given a data model (17, 18). Calculation of the CRLB requires inversion of the Fisher matrix and an estimate of the standard deviation (SD) of the noise, often considered as Gaussian distributed (1–5, 7–9, 12–16, 19).
While the noise in spectroscopic acquisitions can accurately be modeled as Gaussian, the noise distribution in magnitude MR images obtained with single coil acquisition is Rician; this approaches the Gaussian distribution only for high signal-to-noise ratio (SNR) (11, 20–22). Therefore, incorporation of Rician noise into CRLB analysis is especially important in settings of limited SNR, as is often the case in clinical imaging (11, 23–26).
Karlsen et al. (27) provided an analytic derivation of Fisher matrix elements for the case of Rician distributed noise, as appropriate for single coil acquisition. However, parallel imaging using multiple coils has become a standard technique in clinical MR research to enhance SNR or acquisition speed (28–30); in this setting, the noise in the reconstructed magnitude image fellows a generalized Rician distribution, known also as the noncentral χ-distribution (31–33).
Building on Karlsen’s work (27), we provide here a general analytic derivation of the Fisher matrix elements for the case of noncentral χ-distribution. Numerical analyses are then presented that demonstrate the importance of considering the noncentral χ-distribution in the CRLB calculation in multi-coil acquisitions, especially at low-to-moderate SNR regime. Finally, a diffusion kurtosis model is analyzed within this framework.
THEORY
Noncentral χ-distribution
If the variance of the noise at each coil in a parallel imaging configuration is the same, and not correlated between the coils, the probability density function (PDF) for signal intensity within a given voxel of the resulting magnitude image, reconstructed using for example the root of the sum of squares (SoS) method (32), follows a noncentral χ-distribution given by (31, 33, 34):
| [1] |
where A is the magnitude of the underlying noise-free signal, M is the magnitude of the observed signal, m is the number of coils, σ2 is the noise variance, and Im is the modified mth order Bessel function of the first kind.
Cramér-Rao lower bound (CRLB) for the noncentral χ-distribution
Calculation of the CRLB requires inversion of the Fisher matrix defined as follows. For N measured data values fit to a parameterized signal model defined by a parameter vector β, and with the assumption of equal σ at each data point, the elements of the Fisher matrix for the noncentral χ-distribution are given by:
| [2] |
where E stands for the expectation value, and log (Lχ(M. A. σ, m)) is the log-likelihood function of noncentral χ-distribution:
| [3] |
The index n indicates, for example, different image weightings or multiple acquisitions with the same weightings.
Then, the CRLB for the standard deviation (SD) of an unbiased parameter estimate, β̂i, of the parameter βi is given by:
| [4] |
The calculation of the Fisher’s matrix elements requires the calculation of the partial derivatives of the log-likelihood function, as seen from Eq. 2. Writing zn = MnAn/σ2, and with the following equality (27, 35):
| [5] |
the first partial derivative, , in Eq. 2 is given by
| [6] |
Hence, Eq. 2 can be rewritten as follow
| [7] |
Using the following equality (36):
| [8] |
the expectation value of the first term in Eq. 7 is given by:
| [9] |
Hence, Eq. 7 becomes:
| [10] |
In addition (35),
| [11] |
so that Eq. 10 is now given by:
| [12] |
Using for the noncentral χ-distribution and again using Eq. 8, we find
| [13] |
Finally, Eq. 12 is reduced to
| [14] |
where the factor R is given by
| [15] |
The integral in Eq. 15 cannot be solved analytically, so that Rn must be calculated by numerical integration for different values of SNR (i.e. An/σ).
METHODS
PDF and correction factor as a function of SNR and number of coils
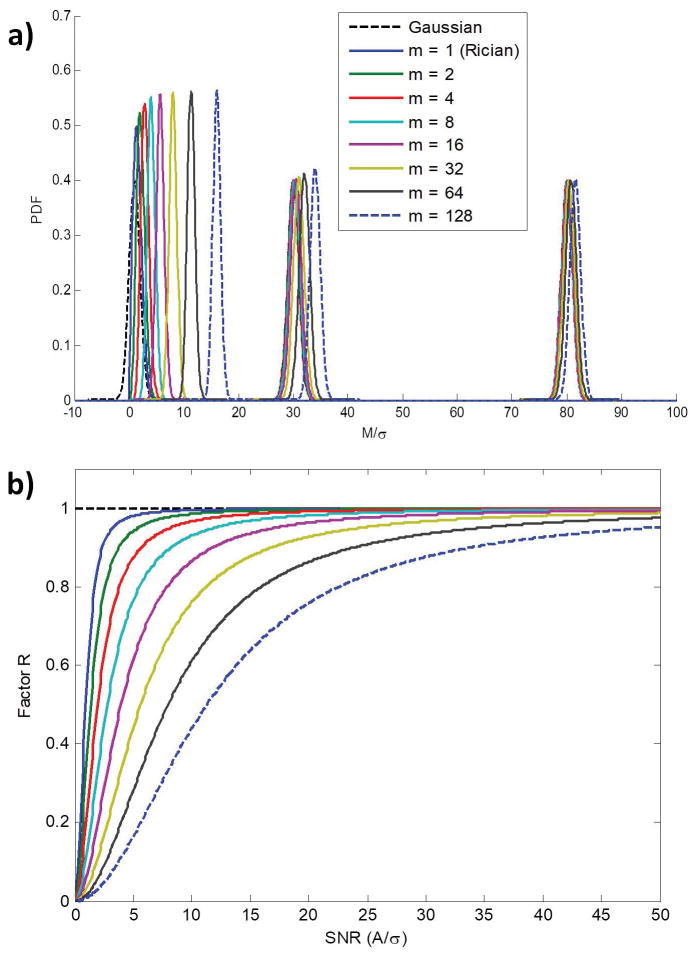
The PDF of voxel intensity, given by Eq. 1, was calculated for different numbers of coils, m = 1, 2, 4, 8, 16, 32, 64 and 128, as a function of M/σ and for different values of A = 1, 40 and 80, corresponding to low, moderate, and high SNR, respectively. Results were also obtained using a Gaussian PDF for comparison. For all cases, σ was fixed to 1. In addition, the correction factor given by Eq. 15 was calculated as a function of SNR = A0/σ over the above range of m.
CRLB of diffusion kurtosis signal model
We consider a model, A(β.b), describing diffusion kurtosis as a function of b-value and parameter set β = (A0,Dapp,Kapp)
| [16] |
where Dapp and Kapp are the apparent diffusion coefficient and kurtosis along a certain diffusion direction, and is the non-diffusion weighted signal obtained at b = 0 s/mm2, with ρ proportional to proton density and a function of relaxation times and machine factors, and where is the signal amplification factor due to multi-coil acquisition and SoS reconstruction.
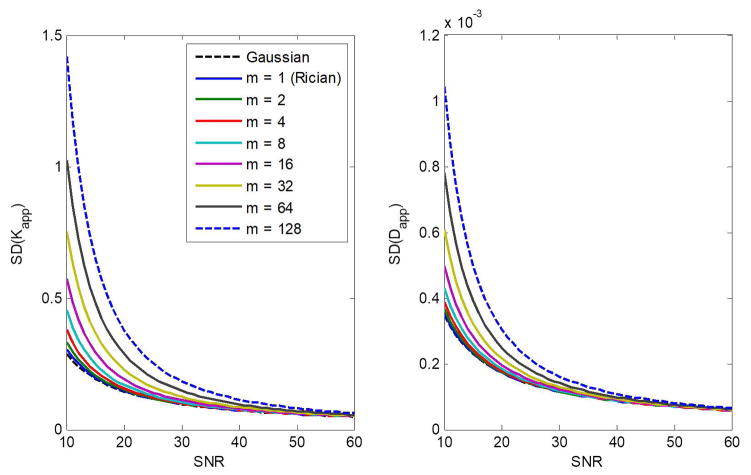
The first analysis consisted of evaluating the minimum SD (i.e. CRLB) in the estimation of Dapp and Kapp as a function of SNR = A0/σ. Analysis was performed for SNR varying from 10 to 60 in steps of 1, and for different numbers of coils, m, as above. Results for the special case of a Gaussian distribution, that is, Rn = 1 (Eqs. 14–15), were also calculated. Four b-values of 0, 1000, 2000, and 3000 s/mm2 were considered.
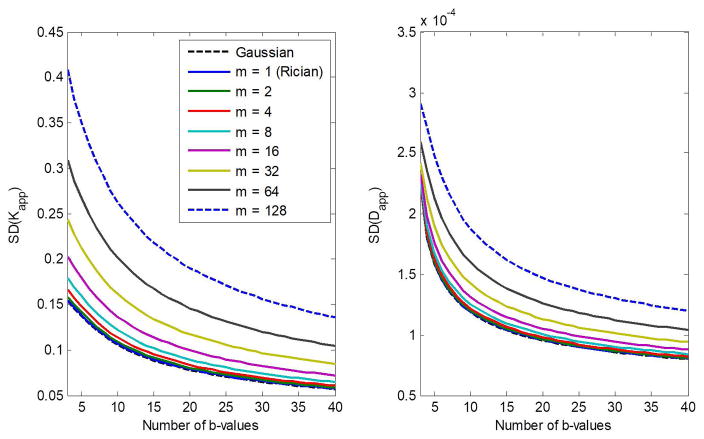
The second analysis consisted of evaluating the minimum SD (i.e. CRLB) in the estimation of Dapp and Kapp as a function of the number of b-values. Analysis was performed for b-values varying linearly from 500 to 3000 s/mm2, with b = 0 s/mm2 systematically included, and for different numbers of coils, m. Results for the special case of the Gaussian distribution were also obtained. Here, the SNR was fixed to 20.
For both analyses, input values for Dapp and Kapp were fixed to 1 μm2/ms and 1, respectively, corresponding to values obtained for human brain (37). The partial derivatives required for the CRLB calculation (Eq. 14) are given by:
| [17] |
Monte Carlo simulation
Monte Carlo (MC) simulations were used to assess the SDs in the estimation of Dapp and Kapp as a function of SNR and the number of b-values. Input parameters were similar to those used above, with analysis restricted to m = 32. For each SNR or number of b-values, 10000 noisy signals were created and reconstructed using the SoS method and fit to the expectation value of the noncentral χ-distribution given by (38–40):
| [18] |
where 1F1 is a confluent hypergeometric function. The SDs of Dapp and Kapp, were calculated over the 10000 noise realizations after removal of outliers using Tukey’s method (20, 41), and compared to the minimal SDs obtained using the CRLB analysis outlined above.
RESULTS
Figure 1a shows the noncentral χ- (Eq. 1) and Gaussian- distributions as a function of M/σ and number of coils, m. Results are shown for values of A = 1, 30 and 80, corresponding to low, moderate, and high SNR, respectively. While at high SNR the noncentral χ-distribution approaches the Gaussian distribution, at low-to-moderate SNR the noncentral χ-distribution deviates substantially from the Gaussian distribution. Our results indicate that this departure from the Gaussian case is more pronounced for larger values of m. Figure 1b shows the correction factor, R, of the Fisher matrix, given by Eq. 15, as a function of SNR, for different numbers of coils, m. For A ≫ σ, that is, high SNR, the value of R approaches 1, in which case the Fisher matrix for the noncentral χ-distribution becomes identical to that of the Gaussian distribution for any m. At low-to-moderate SNR, we see that the deviation from R = 1 increases as the number of coils increases. It is clear from these results that at low-to-moderate SNR, the Fisher matrix for the noncentral χ-distribution cannot be approximated by the Gaussian distribution in the setting of parallel imaging, for which m ≥ 2.
Figure 1.
Figure 1a. The noncentral χ- (Eq. 1) and Gaussian- probability density functions (PDF) as a function of M/σ for different numbers of coils, m. Results are shown for three different values of A of 1, 30 and 80, corresponding to low, moderate, and high SNR, respectively. Figure 1b: Correction factor, R, of the Fisher matrix given by Eq. 15, calculated as a function of SNR, and for different numbers of coils (i.e. m).
Figure 2 shows the CRLB for the estimation of Kapp and Dapp as a function of SNR in the diffusion kurtosis model. Results are shown for different numbers of coils, m, as well as for the Gaussian distribution. For all m, the SDs in the estimation of Kapp and Dapp decrease roughly exponentially with increasing SNR, so that improvements in precision are only marginal for SNR > 30. Furthermore, for a given SNR, the SDs increase with increasing m, indicating that the Gaussian approximation in the CRLB calculation is overly optimistic, especially at low-to-moderate SNR (i.e. SNR ≤ 30). At high SNRs, SDs in derived parameter estimates from both Gaussian- and noncentral χ-distributions converge, as expected, to the same values.
Figure 2.
The CRLB for the estimation of Kapp and Dapp as a function of SNR in a diffusion kurtosis model. Results are obtained for different numbers of coils, m, and for the case of a Gaussian distribution. Analysis was performed assuming four b-values of 0, 1000, 2000, and 3000 s/mm2. The input parameter values for Dapp and Kapp were fixed to 1 μm2/ms and 1, respectively.
Figure 3 shows the CRLB for the estimation of of Kapp and Dapp as a function of the number of b-values. Results are again shown for different numbers of coils, m, as well as for a Gaussian noise distribution. All results were obtained for SNR = 20. For all m, the SDs in the estimation of Kapp and Dapp decrease roughly exponentially with increasing number of b-values. Again, the SDs increase with increasing m, indicating that the Gaussian approximation in the CRLB calculation is overly optimistic, particularly for m > 2.
Figure 3.
The CRLB for the estimation of Kapp and Dapp as a function of the number of b-value in a diffusion kurtosis model. Results are obtained for different numbers of coils, m, and for the case of Gaussian distribution. Analysis was performed for SNR = 20. The input parameter values for Dapp and Kapp were fixed to 1 μm2/ms and 1, respectively.
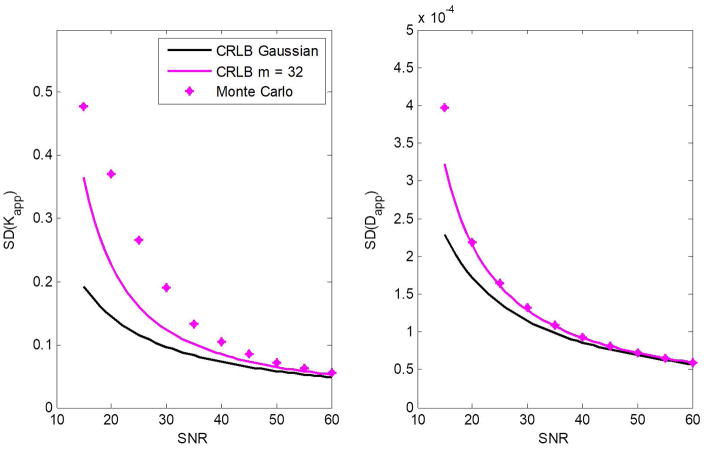
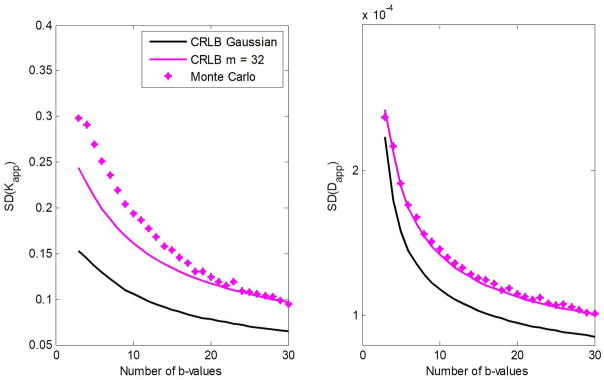
Figures 4 and 5 show the calculated SDs in the estimation of Kapp and Dapp obtained from the MC simulations, outlined above, as a function of SNR and the number of b-values, respectively. Further, the CRLB results of the SDs in the estimation of Kapp and Dapp for both the noncentral χ- and Gaussian-distributions are displayed. The results show that minimal theoretical SDs as defined by the CRLB can be achieved at moderate-to-high SNR or for relatively large number of b-values. Most importantly, the CRLB assuming a noncentral χ-distribution for noise provided a closer match to the MC simulations as compared to the Gaussian CRLB results, as expected.
Figure 4.
Simulation results showing dispersion, that is, the standard deviation (SD) in the estimation of Kapp and Dapp as a function of SNR. The CRLB results for both the noncentral χ- and Gaussian-distributions are presented. Results are obtained for m = 32. The input parameter values for Dapp and Kapp were fixed to 1 μm2/ms and 1, respectively.
Figure 5.
Simulation results showing Monte Carlo calculations of dispersion, that is, the standard deviation (SD), in the estimation of Kapp and Dapp as a function of the number of b-values. The CRLB for both the noncentral χ- and Gaussian-distributions are presented for comparison. Results are shown for m = 32. The input parameter values for Dapp and Kapp were fixed to 1 μm2/ms and 1, respectively.
DISCUSSION
We have presented a general expression for the Fisher matrix for the noncentral χ-distribution and from this, defined the associated CRLB. This expression incorporates a correction factor that accounts for the departure from the Gaussian distribution for noise in composite MR images obtained with multi-coil acquisitions (Eqs. 14–15), such as in parallel imaging. Our results show that the Gaussian approximation for CRLB calculations, as often adopted in the literature (1–6, 8, 19), is not appropriate, especially at low-to-moderate SNR or for a large number of coils. Indeed, CRLB calculations of derived parameter estimates for the diffusion kurtosis signal model indicated that the Gaussian approximation was, as expected, appropriate only at high SNR (Figs. 1–3); in this limit, the noncentral χ-distribution converges to a Gaussian distribution (Fig. 1a). MC simulations were in good agreement and support these conclusions (Figs. 4–5).
We note that the CRLB results showed lower SD values as compared to those obtained from the MC simulations, especially at low SNR (Figs. 4–5). This is due to the fact that the CRLB provides a lower bound, while MC simulates an actual experiment. Further, the kurtosis parameter, Kapp, is less precisely estimated than is the apparent diffusion coefficient, Dapp. An eigenvalue analysis of the Hessian matrix for the kurtosis signal model shows that the structure of the kurtosis model itself dictates that Kapp will be less reliably defined than Dapp, that is, a wider range of Kapp values will provide a good fit to the data as compared to Dapp, which is more tightly controlled (23, 42–44).
While the factor describing the departure of the Fisher matrix from the Gaussian case, as given by the Eq. 15, is straightforward to implement, we have provided a lookup table (Supporting Table S1), with calculated values as a function of SNR and for different numbers of coils, m. Our analysis (data not shown) showed that spline interpolation can be used, based on those values, to accurately recover similar results to those obtained using direct numerical integration in the Eq. 15. This allows rapid computation and, therefore, may help in experimental designs requiring extensive CRLB calculations, such as selection of an optimal set of b-values as a function of underlying values of Kapp and Dapp for the kurtosis model studied in this work.
It must be noted that the assumption of noncentral χ-distributed noise in the composite magnitude image is valid only under certain circumstances, including equal variance of noise for all coils, and absence of noise correlation between them (31, 33). It is well known that in phased array systems noise correlations do exist (31, 33, 45); however, other studies showed that this effect is minimal so that the noncentral χ-distribution remains a good approximation (46). Even if correlations do exist between different coils, the noncentral χ-distribution can still be assumed, using pre-calculated effective values for the number of coils and noise SD, as described in (31).
In conclusion, we have provided a general expression for the Fisher matrix, as used in the CRLB calculation, for imaging data described by noncentral χ-distributions, and demonstrated that the Gaussian assumption in the CRLB calculations may not hold in the setting of low-to-moderate SNR regime.
Supplementary Material
Supporting Table S1. Values of the factor R describing the departure of the Fisher matrix from the Gaussian case, as given by the Eq. 15, as a function of SNR and for different numbers of coils, m.
Acknowledgments
This work was supported by the Intramural Research Program of the NIH, National Institute on Aging.
REFEENCES
- 1.Jones JA, Hodgkinson P, Barker AL, Hore PJ. Optimal Sampling Strategies for the Measurement of Spin–Spin Relaxation Times. Journal of Magnetic Resonance, Series B. 1996;113(1):25–34. [Google Scholar]
- 2.Cavassila S, Deval S, Huegen C, van Ormondt D, Graveron-Demilly D. Cramér–Rao bounds: an evaluation tool for quantitation. NMR in biomedicine. 2001;14(4):278–83. doi: 10.1002/nbm.701. [DOI] [PubMed] [Google Scholar]
- 3.Zhang Y, Yeung HN, O’Donnell M, Carson PL. Determination of sample time for T1 measurement. Journal of magnetic resonance imaging : JMRI. 1998;8(3):675–81. doi: 10.1002/jmri.1880080324. [DOI] [PubMed] [Google Scholar]
- 4.Anastasiou A, Hall LD. Optimisation of T2 and M0 measurements of bi-exponential systems. Magnetic resonance imaging. 2004;22(1):67–80. doi: 10.1016/j.mri.2003.05.005. [DOI] [PubMed] [Google Scholar]
- 5.Bonny JM, Zanca M, Boire JY, Veyre A. T2 maximum likelihood estimation from multiple spin-echo magnitude images. Magnetic resonance in medicine. 1996;36(2):287–93. doi: 10.1002/mrm.1910360216. [DOI] [PubMed] [Google Scholar]
- 6.Alexander DC. A general framework for experiment design in diffusion MRI and its application in measuring direct tissue-microstructure features. Magnetic resonance in medicine. 2008;60(2):439–48. doi: 10.1002/mrm.21646. [DOI] [PubMed] [Google Scholar]
- 7.Celik H, Bouhrara M, Reiter DA, Fishbein KW, Spencer RG. Stabilization of the inverse Laplace transform of multiexponential decay through introduction of a second dimension. Journal of magnetic resonance (San Diego, Calif : 1997) 2013;236:134–9. doi: 10.1016/j.jmr.2013.07.008. [DOI] [PMC free article] [PubMed] [Google Scholar]
- 8.Dula AN, Gochberg DF, Does MD. Optimal Echo Spacing for Multi-Echo Imaging measurements of Bi-exponential T(2) relaxation. Journal of magnetic resonance (San Diego, Calif : 1997) 2009;196(2):149–56. doi: 10.1016/j.jmr.2008.11.002. [DOI] [PMC free article] [PubMed] [Google Scholar]
- 9.Poot DH, den Dekker AJ, Achten E, Verhoye M, Sijbers J. Optimal experimental design for diffusion kurtosis imaging. IEEE transactions on medical imaging. 2010;29(3):819–29. doi: 10.1109/TMI.2009.2037915. [DOI] [PubMed] [Google Scholar]
- 10.Bouhrara M, Spencer RG. Incorporation of nonzero echo times in the SPGR and bSSFP signal models used in mcDESPOT. Magnetic resonance in medicine. 2015;74(5):1227–35. doi: 10.1002/mrm.25984. [DOI] [PMC free article] [PubMed] [Google Scholar]
- 11.Raya JG, Dietrich O, Horng A, Weber J, Reiser MF, Glaser C. T2 measurement in articular cartilage: impact of the fitting method on accuracy and precision at low SNR. Magnetic resonance in medicine. 2010;63(1):181–93. doi: 10.1002/mrm.22178. [DOI] [PubMed] [Google Scholar]
- 12.Brihuega-Moreno O, Heese FP, Hall LD. Optimization of diffusion measurements using Cramer-Rao lower bound theory and its application to articular cartilage. Magnetic resonance in medicine. 2003;50(5):1069–76. doi: 10.1002/mrm.10628. [DOI] [PubMed] [Google Scholar]
- 13.Wyatt C, Soher BJ, Arunachalam K, MacFall J. Comprehensive analysis of the Cramer–Rao bounds for magnetic resonance temperature change measurement in fat–water voxels using multi-echo imaging. Magma (New York, NY) 2012;25(1):49–61. doi: 10.1007/s10334-011-0247-x. [DOI] [PMC free article] [PubMed] [Google Scholar]
- 14.Liu Y, Buck JR, Ikonomidou VN. Generalized min-max bound-based MRI pulse sequence design framework for wide-range T(1) relaxometry: A case study on the tissue specific imaging sequence. PloS one. 2017;12(2):e0172573. doi: 10.1371/journal.pone.0172573. [DOI] [PMC free article] [PubMed] [Google Scholar]
- 15.De Naeyer D, De Deene Y, Ceelen WP, Segers P, Verdonck P. Precision analysis of kinetic modelling estimates in dynamic contrast enhanced MRI. Magnetic Resonance Materials in Physics, Biology and Medicine. 2011;24(2):51–66. doi: 10.1007/s10334-010-0235-6. [DOI] [PubMed] [Google Scholar]
- 16.Lankford CL, Does MD. On the inherent precision of mcDESPOT. Magnetic resonance in medicine. 2013;69(1):127–36. doi: 10.1002/mrm.24241. [DOI] [PMC free article] [PubMed] [Google Scholar]
- 17.Rao CR. Information and the Accuracy Attainable in the Estimation of Statistical Parameters. In: Kotz S, Johnson NL, editors. Breakthroughs in Statistics: Foundations and Basic Theory. New York, NY: Springer New York; 1992. pp. 235–47. [Google Scholar]
- 18.Cramér H. Mathematical methods of statistics. Princeton University Princeton; NJ: Princeton University Press; 1946. [Google Scholar]
- 19.Gilani N, Malcolm PN, Johnson G. Parameter Estimation Error Dependency on the Acquisition Protocol in Diffusion Kurtosis Imaging. Applied Magnetic Resonance. 2016;47(11):1229–38. doi: 10.1007/s00723-016-0829-x. [DOI] [PMC free article] [PubMed] [Google Scholar]
- 20.Bouhrara M, Reiter DA, Celik H, Bonny JM, Lukas V, Fishbein KW, et al. Incorporation of rician noise in the analysis of biexponential transverse relaxation in cartilage using a multiple gradient echo sequence at 3 and 7 tesla. Magnetic resonance in medicine. 2015;73(1):352–66. doi: 10.1002/mrm.25111. [DOI] [PMC free article] [PubMed] [Google Scholar]
- 21.Bernstein MA, Thomasson DM, Perman WH. Improved detectability in low signal-to-noise ratio magnetic resonance images by means of a phase-corrected real reconstruction. Medical physics. 1989;16(5):813–7. doi: 10.1118/1.596304. [DOI] [PubMed] [Google Scholar]
- 22.Rice S. In: Mathematical analysis of random noise. Wax N, editor. New York: Dover Publications Inc; Selected papers on noise and stochastic processes. [Google Scholar]
- 23.Bouhrara M, Reiter DA, Celik H, Fishbein KW, Kijowski R, Spencer RG. Analysis of mcDESPOT- and CPMG-derived parameter estimates for two-component nonexchanging systems. Magnetic resonance in medicine. 2015 doi: 10.1002/mrm.25801. [DOI] [PMC free article] [PubMed] [Google Scholar]
- 24.Bouhrara M, Spencer RG. Rapid Simultaneous High-resolution Mapping of Myelin Water Fraction and Relaxation Times in Human Brain using BMC-mcDESPOT. NeuroImage. doi: 10.1016/j.neuroimage.2016.09.064. [DOI] [PMC free article] [PubMed] [Google Scholar]
- 25.Bouhrara M, Spencer RG. Improved determination of the myelin water fraction in human brain using magnetic resonance imaging through Bayesian analysis of mcDESPOT. NeuroImage. 2016;127:456–71. doi: 10.1016/j.neuroimage.2015.10.034. [DOI] [PMC free article] [PubMed] [Google Scholar]
- 26.Liu F, Kijowski R. Assessment of different fitting methods for in-vivo bi-component T2(*) analysis of human patellar tendon in magnetic resonance imaging. Muscles, Ligaments and Tendons Journal. 2017;7(1):163–72. doi: 10.11138/mltj/2017.7.1.163. [DOI] [PMC free article] [PubMed] [Google Scholar]
- 27.Karlsen OT, Verhagen R, Bovee WM. Parameter estimation from Rician-distributed data sets using a maximum likelihood estimator: application to T1 and perfusion measurements. Magnetic resonance in medicine. 1999;41(3):614–23. doi: 10.1002/(sici)1522-2594(199903)41:3<614::aid-mrm26>3.0.co;2-1. [DOI] [PubMed] [Google Scholar]
- 28.Deshmane A, Gulani V, Griswold MA, Seiberlich N. Parallel MR Imaging. Journal of magnetic resonance imaging : JMRI. 2012;36(1):55–72. doi: 10.1002/jmri.23639. [DOI] [PMC free article] [PubMed] [Google Scholar]
- 29.Heidemann RM, Özsarlak Ö, Parizel PM, Michiels J, Kiefer B, Jellus V, et al. A brief review of parallel magnetic resonance imaging. European radiology. 2003;13(10):2323–37. doi: 10.1007/s00330-003-1992-7. [DOI] [PubMed] [Google Scholar]
- 30.Pruessmann KP. Encoding and reconstruction in parallel MRI. NMR in biomedicine. 2006;19(3):288–99. doi: 10.1002/nbm.1042. [DOI] [PubMed] [Google Scholar]
- 31.Aja-Fernández S, Vegas-Sánchez-Ferrero G. Statistical Analysis of Noise in MRI. Springer International Publishing; 2016. [Google Scholar]
- 32.Larsson EG, Erdogmus D, Yan R, Principe JC, Fitzsimmons JR. SNR-optimality of sum-of-squares reconstruction for phased-array magnetic resonance imaging. Journal of magnetic resonance (San Diego, Calif : 1997) 2003;163(1):121–3. doi: 10.1016/s1090-7807(03)00132-0. [DOI] [PubMed] [Google Scholar]
- 33.den Dekker AJ, Sijbers J. Data distributions in magnetic resonance images: A review. Physica Medica. 2014;30(7):725–41. doi: 10.1016/j.ejmp.2014.05.002. [DOI] [PubMed] [Google Scholar]
- 34.Miller K. Multidimensional Gaussian distributions. New York: New York: John Wiley and Sons Inc; 1964. [Google Scholar]
- 35.Abramowitz M, Stegun I. Handbook of mathematical functions. New York: New York: Dover Publications, Inc; 1965. [Google Scholar]
- 36.Geller MN, Edward W. A Table of Integrals of the Exponential Integral. JOURNAL OF RESEARCH of the National Bureau af Standards - B Mathematics and Mathematical Science. 1969;73B(3):191–210. [Google Scholar]
- 37.Jensen JH, Helpern JA. MRI quantification of non-Gaussian water diffusion by kurtosis analysis. NMR in biomedicine. 2010;23(7):698–710. doi: 10.1002/nbm.1518. [DOI] [PMC free article] [PubMed] [Google Scholar]
- 38.Koay CG, Basser PJ. Analytically exact correction scheme for signal extraction from noisy magnitude MR signals. Journal of magnetic resonance (San Diego, Calif : 1997) 2006;179(2):317–22. doi: 10.1016/j.jmr.2006.01.016. [DOI] [PubMed] [Google Scholar]
- 39.Wang C, He T, Liu X, Zhong S, Chen W, Feng Y. Rapid look-up table method for noise-corrected curve fitting in the r2* mapping of iron loaded liver. Magnetic resonance in medicine. 2015;73(2):865–71. doi: 10.1002/mrm.25184. [DOI] [PubMed] [Google Scholar]
- 40.Koay CG, Özarslan E, Basser PJ. A Signal-Transformational Framework for Breaking the Noise Floor and Its Applications in MRI. Journal of magnetic resonance (San Diego, Calif : 1997) 2009;197(2):108–19. doi: 10.1016/j.jmr.2008.11.015. [DOI] [PMC free article] [PubMed] [Google Scholar]
- 41.Hoaglin D, Mosteller F, Tukey J. Understanding robust and exploratory data analysis. New York: New York: John Wiley and Sons; 1983. [Google Scholar]
- 42.Gutenkunst RN, Waterfall JJ, Casey FP, Brown KS, Myers CR, Sethna JP. Universally Sloppy Parameter Sensitivities in Systems Biology Models. PLOS Computational Biology. 2007;3(10):e189. doi: 10.1371/journal.pcbi.0030189. [DOI] [PMC free article] [PubMed] [Google Scholar]
- 43.Waterfall JJ, Casey FP, Gutenkunst RN, Brown KS, Myers CR, Brouwer PW, et al. Sloppy-model universality class and the Vandermonde matrix. Physical review letters. 2006;97(15):150601. doi: 10.1103/PhysRevLett.97.150601. [DOI] [PubMed] [Google Scholar]
- 44.White A, Tolman M, Thames HD, Withers HR, Mason KA, Transtrum MK. The Limitations of Model-Based Experimental Design and Parameter Estimation in Sloppy Systems. PLOS Computational Biology. 2016;12(12):e1005227. doi: 10.1371/journal.pcbi.1005227. [DOI] [PMC free article] [PubMed] [Google Scholar]
- 45.Aja-Fernandez S, Vegas-Sanchez-Ferrero G, Tristan-Vega A. Noise estimation in parallel MRI: GRAPPA and SENSE. Magnetic resonance imaging. 2014;32(3):281–90. doi: 10.1016/j.mri.2013.12.001. [DOI] [PubMed] [Google Scholar]
- 46.Constantinides CD, Atalar E, McVeigh ER. Signal-to-Noise Measurements in Magnitude Images from NMR Phased Arrays. Magnetic resonance in medicine : official journal of the Society of Magnetic Resonance in Medicine/Society of Magnetic Resonance in Medicine. 1997;38(5):852–7. doi: 10.1002/mrm.1910380524. [DOI] [PMC free article] [PubMed] [Google Scholar]
Associated Data
This section collects any data citations, data availability statements, or supplementary materials included in this article.
Supplementary Materials
Supporting Table S1. Values of the factor R describing the departure of the Fisher matrix from the Gaussian case, as given by the Eq. 15, as a function of SNR and for different numbers of coils, m.


