Abstract
Background
Quantitative suspension arrays are powerful immunoassays to measure antibodies against multiple antigens in large numbers of samples in a short time and using few microliters. To identify antigen targets of immunity for vaccine development against complex microbes like malaria, such technology allows the characterization of the magnitude and antigenic specificity of Ig isotypes and subclasses that are important for functional responses. However, standardized assays are not widely available.
Methods
We developed six quantitative suspension array assays for IgG1, IgG2, IgG3, IgG4, IgM and IgE specific to multiple P. falciparum antigens. Among commercially available sources, secondary and tertiary antibodies, as well as human purified antibodies for standard curves, were tested. Positive and negative controls included plasmas from malaria hyper-immune African adults and from malaria-naïve European adults, respectively. Reagents were selected and optimal antibody and test sample dilutions established according to sensitivity, specificity and performance of the standard curves. The variability between replicates and plates was assessed with 30 test samples and controls.
Results
Assays were able to detect P. falciparum antigen-specific antibodies for all isotypes and subclasses in samples from malaria-exposed individuals, with low background signal in blank wells. Levels detected in malaria-naïve individuals were overall low except for IgM. For the IgG2 and IgE assays, a triple sandwich was required for sensitivityStandard curves with 5-parameter logistic fit were successfully obtained in all assays. The coefficients of variation for measurements performed in different days were all < 30%, and < 5% when comparing duplicates from the same plate.
Conclusion
The isotype/subclass assays developed here were sensitive, specific, reproducible and of adequate quantification dynamic range. They allow performing detailed immuno-profiling to large panels of P. falciparum antigens to address naturally- and vaccine-induced Ig responses and elucidate correlates of malaria protection, and could also be applied to other antigen panels.
Keywords: IgG, subclasses, IgM, IgE, multiplexed antigens, Plasmodium falciparum
1. Introduction
In the assessment of humoral immunity against complex infections such as Plasmodium parasites, still affecting 95 countries and with 3.2 billion people at risk in 20151, it is key to have immunoassays that can reliably measure multiple immunoglobulins (Ig) and antigens in a mid-high throughput miniaturized manner. Antigen and isotype/subclass targets of naturally-acquired immunity2, 3 need to be identified to characterize mechanisms of protection and find ways to induce them through vaccination.
Most malaria sero-epidemiological and vaccine studies only measure antigen-specific IgG4, 5, since in the 60’s it was established that transfer of purified IgG can control P. falciparum infection6. Nevertheless, antigenic targets of protection are unknown, and diverse Ig isotypes and subclasses are generated in response to malaria infection7–10. These various isotypes could be differentially elicited by antigens and have different effector functions, some of them being protective while others not11–13. It is generally known that IgG1 and IgG3, both considered cytophilic antibodies, are the main subclasses generated against P. falciparum antigens14–16, but their relevance and function needs to be better studied. The most accepted mechanism by which IgG1 and IgG3 may protect against P. falciparum infection is through their ability to fix complement and mediate opsonizing phagocytosis17, 18. However, it needs to be better established whether non-cytophilic IgG2 and IgG4 antibodies, despite being present at low levels in exposed individuals, could be induced in detriment of cytophilic subclasses considered as protective, and to what extent their increase could be associated with risk of malaria. Furthermore, the role of IgM and IgE in malaria immunity has been less studied and merits more attention according to recent data associating those responses to protection19 or risk20–22, respectively. Therefore, an appropriate understanding of the magnitude and antigenic specificity of each of the Ig isotypes and subclasses is very important for the development of a new generation of effective vaccines.
Traditionally, the measurement of specific antibodies has been done by the enzyme-linked immunosorbent assay (ELISA)23–25. Although this classical technique has been very useful over the years, it demands significant amount of time, the use of relatively large sample volumes and, importantly, only allows quantifying antibodies against a single antigen at a time. A mid-high throughput multiplex alternative technique is the quantitative suspension array technology (qSAT), particularly suited for large parasites like P. falciparum that is estimated to contain around 5,000 proteins, many of which are polymorphic and/or variant, and stage-specific. qSAT has several advantages compared to ELISA already demonstrated in many studies in diverse research areas26–29. For example, qSAT allows working with 5 or less microliters of plasma, serum or saliva, and simultaneously quantify up to 500 different proteins/antibodies, peptides, RNA or DNA fragments in a single well. In addition the qSAT is a very flexible platform that allows different antibody sandwiches, representing a perfect tool to assess the levels of different Ig isotypes and subclasses in large numbers of samples.
In this study, we have developed 6 different qSAT assays to measure antigen-specific IgG subclasses (1 to 4), IgM, and IgE using several panels of minimum 6 to 10 P. falciparum antigens. For this purpose, several antibody sandwiches were tested to choose the optimal combination for each isotype/subclass assay. In addition, isotype/subclass specific singleplex standard curves were developed to select sample dilutions for data analysis and to calibrate the assay. The variability of the assays between replicates and plates was also evaluated.
2. Material and methods
2.1. Human samples
A plasma pool made of 22 samples from malaria hyper-immune adults from Manhiça, Mozambique30, was used as positive control. Fourteen individual plasma samples from European adults never exposed to malaria were used as negative controls. Test samples from 30 malaria-exposed individuals, adults and children, collected in the context of different immunological studies31–33, were assayed in the setting up and assessment of the different assays.
Written informed consent was obtained from participants before sample collection; in the case of children the informed consent was obtained from parents or guardians.
Approval for the protocols was obtained from the Hospital Clínic of Barcelona Ethics Review Committee and the National Mozambican Ethics Review Committee.
2.2. P. falciparum recombinant antigens
A primary multiplex panel including 10 recombinant proteins with a broad range of immunogenicities was initially established to set up the IgG1-4 and IgM assays using the Luminex xMAP™ technology (Luminex Corp., Austin, Texas)32. The antigens were selected based on their important role as candidate vaccines, and for being representative of the different phases of the parasite life cycle. The panel included 4 pre-erythrocytic antigens: cell-traversal protein for ookinetes and sporozoites (CelTOS)34, liver-stage antigen 1 (LSA-1)35, sporozoite surface protein 2 (SSP2, also known as TRAP)36 and circumsporozoite surface protein (CSP)37; and 6 erythrocytic antigens: apical membrane antigen 1 (AMA-1) from 3D7 and FVO strains38–40, merozoite surface protein 1 (MSP-142) from 3D7 and FVO strains41, 42, fragment II of region II of the 175 kDa erythrocyte binding protein (EBA-175 or PfF2)43, and Duffy binding-like alpha (DBL-α) domain of PfEMP-144. P. falciparum AMA- and MSP-1 are polymorphic proteins, and the two most studied strains are 3D7 and FVO. Antigens based on primary sequences from both strains have been developed as vaccine candidates because of the strain-specific nature of antibody responses to many malarial antigens. Experimental vaccines based on only one genotype of these proteins have been tested in field trials showing different degree of protection depending on the circulating strain45, 46. As antibody responses to polymorphic proteins may vary in different populations, we included AMA-1 and MSP-1 from both strains in the panel to have a broader repertoire and check whether they elicited different IgM and IgG subclass responses. A bovine serine albumin (BSA)-coupled bead was also included in the multiplex for background determination. The pre-erythrocytic antigens were expressed in Pichia Pastoris and provided by Protein Potential, LLC (Rockville, Maryland, USA). AMA-1 3D7, EBA-175 and DBLα were provided by the International Centre for Genetic Engineering and Biotechnology (ICGEB). AMA-1 FVO and MSP-142 3D7 and FVO were provided by the Walter Reed Army Institute of Research (WRAIR). The BSA was purchased to Sigma-Aldrich.
A secondary panel was used to set up an antigen-specific IgE assay, including those antigens showing some IgE reactivity in previous tests using a positive pool (data not shown). The antigens included in the IgE panel were: the Exported Protein 1 (EXP-1, Protein Potential), Merozoite Surface Protein 3 (MSP-3 3D7, ICGEB), Merozoite Surface Protein 2 3D7 strain type CH150 (MSP-2 3D7 CH150, Edinburgh University), CSP full length (Protein Potential), NANP repeat region (NANP, WRAIR) and C-term region (C-term, WRAIR).
2.3. Coupling of recombinant antigens to microspheres
MAGPLEX 6.5μm COOH-microspheres were purchased from Luminex Corporation (Austin, TX). The bead stock was gently resuspended on a rotary shaker for 30 min, followed by soft vortexing for 1 min and sonicated for 30 sec. The amount of beads to be coupled to each antigen was calculated assuming the use of 1,000 beads per region and per sample, and a maximum of 2.5 106 beads in 250μl reaction volume. The beads were washed twice with 250μl of distilled water in a concentration of 10,000 beads/μL by short vortex and sonication for 20 sec, and using a magnetic separator (Life Technologies, ref. 12321d). Next, the beads were resuspended in 80μl of activation buffer, 100mM monobasic sodium phosphate (Sigma, S2554), pH 6.2 by vortex and sonication for 20 sec. To activate the beads for cross-linking to proteins, 10μl of 50mg/ml Sulfo-N-hydroxysulfosuccinimide (Thermo Fisher Scientific, ref. 24525) and 10μl of 50mg/ml 1-Ethyl-3-[3-dimethylaminopropyl]-carbodiimidehydrochloride (Thermo Fisher Scientific, ref. 22981) were simultaneously added to the reaction tubes, mixed gently by vortexing and incubated for 20 min, at room temperature (RT), in a rotary shaker and protected from light. Microspheres were washed twice with 250μl 50mM morpholineethane sulfonic acid (MES) (Sigma ref. M1317) pH 5.0, or with phosphate buffered saline (Sigma ref. BE17-512F) pH 7.4 (Table 1), in a 10,000 beads/μL concentration by vortex and sonication for approximately 20 sec.
Table 1.
Panel of Plasmodium falciparum and control antigens with their corresponding coupling concentration and the optimal coupling buffer.
| Antigen | Coupling concentration | Buffer |
|---|---|---|
| AMA-1 3D7 | 20 μg/mL | MES |
| AMA-1 FVO | 20 μg/mL | MES |
| MSP-142 3D7 | 20 μg/mL | MES |
| MSP-142 FVO | 20 μg/mL | MES |
| EBA-175 | 20 μg/mL | PBS |
| CelTOS | 50 μg/mL | PBS |
| LSA-1 | 20 μg/mL | PBS |
| SSP2 | 10 μg/mL | PBS |
| DBL-α | 30 μg/mL | PBS |
| CSP | 10 μg/mL | MES |
| MSP-3 3D7 | 30 μg/mL | MES |
| MSP-2 3D7 CH150 | 30 μg/mL | MES |
| CSP C-term | 30 μg/mL | MES |
| CSP NANP | 30 μg/mL | MES |
| EXP-1 | 30 μg/mL | MES |
| BSA | PBS-BSA1% | PBS |
Beads were first conjugated to the different antigens in a range of concentrations between 10–50 μg/mL to choose the optimal one for couplings. Then, the appropriate amount of each antigen per million beads (Table 1) was added to each reaction tube in 500μl MES or PBS (10,000 beads/uL), and they were left on a rotary shaker overnight at 4°C, protected from light. Next day, beads were brought to RT in agitation for 20 min, and were blocked with 500μl PBS-BN (PBS with 1% BSA (Santa Cruz, SC-2323A) and 0.05% sodium azide (Sigma ref. S8032)) in agitation during 30 min at RT and protected from light. Beads were washed twice with PBS-BN by short vortex and sonication for 20 sec and using the magnetic separator. To determine the percentage recovery after the coupling procedure, coupled beads were resuspended in 500μl PBS-BN and counted on a Guava PCA desktop cytometer (Guava Technologies, Automated cell counter, PC550IG-C4C/0746-2747).
Antigen-coupled beads were validated in singleplex and multiplexed by measuring total IgG in serial dilutions of the positive control. Coupled beads were stored multiplexed at 1,000 beads/μl/region at 4°C and protected from light.
2.4. Coupling of anti-IgM, anti-IgG and anti-IgE antibodies to microspheres for the standard curves
Anti-human IgM (KPL, ref.201-1003), anti-human Fab-IgG (Jackson Immunoresearch, ref. 109-006-097) and anti-human IgE (Abcam, ref. ab99834) antibodies were separately coupled to microspheres at 50 μg/mL following the coupling procedure above indicated. Antibody-coupled beads were tested in singleplex with serial dilutions of the corresponding human purified immunoglobulin: IgM (Sigma-Aldrich, ref. I8260), IgG1 (Abcam, ref. ab90283), IgG2 (Abcam, ref. ab90284), IgG3 (Abcam, ref. ab138703), IgG4 (Abcam, ref. ab90286) and IgE (Abcam, ref. ab65866). Antibody-coupled beads for the standard curves were stored at 2,000 beads/μl at 4°C and protected from light. Anti-human IgE coupled beads were also used to measure total IgE in the test samples.
2.5. General assay procedures
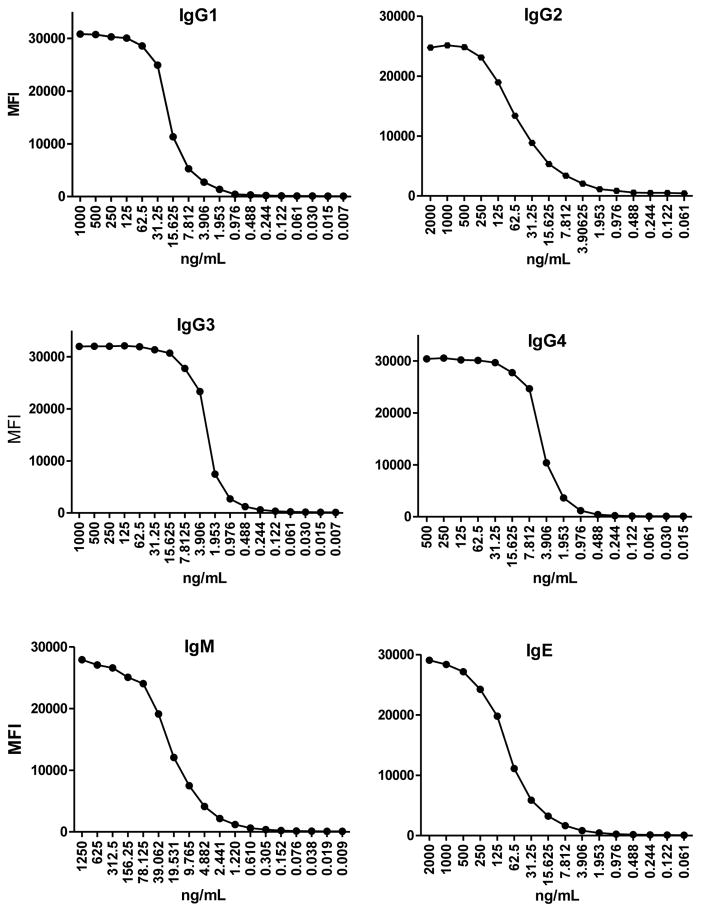
Several biotinilated secondary antibodies were tested against the positive and negative controls to assess their ability to detect IgM, IgG1, IgG2, IgG3, IgG4, and IgE in plasma samples. In parallel, for each specific assay we evaluated the best combination of primary and secondary antibody pairs to create a standard curve of serial dilutions of the corresponding human purified isotype/subclass (Fig. 1). Standard curves of antibody concentrations versus MFIs were fitted using a 5-parameter (5PL) or a 4-parameter (4PL) logistic equation depending on the best yield (superior fit to antibody data). If 5-PL regression model did not converge, then a 4-PL method without asymmetry factor was fitted instead, following the formula MFI=Emax+((Emin-Emax)/((1+((Conc/EC50)^Hill))^Asym)), where EC50 is the half maximal effective concentration, Emin is the minimum response, Emax is the maximum response, Asym is the asymmetry factor and Hill is the slope factor. Titration of antibodies and optimal sample dilutions were assessed through several tests.
Fig. 1.
Examples of IgG1, IgG2, IgG3, IgG4, IgM and IgE standard curves prepared with serial dilutions of the corresponding human purified isotype/subclass.
Regarding the general assay procedures, we followed the previously described total IgG protocol with some modifications32, 47. First, antigen-coupled microspheres were added to a 96-well μClear® flat bottom plate (Greiner Bio-One, ref. 655096) in multiplex (1,000 microspheres per analyte per well)48 in a volume of 50μL of PBS-BN and incubated with 50μL of serial dilutions of the positive control (usually between the range 1/10–1/400,000) and the negative controls (at the first dilution of the positive control). A couple of wells per plate were designated to blanks where beads were incubated with PBS-BN to measure background signal. As standard curve, anti-IgM, anti-IgG or anti-IgE coupled microspheres were added in singleplex (2,000 microspheres per well) in a volume of 50μL of PBS-BN and incubated with 50μl of 2-fold serial dilutions of the corresponding purified human IgM, IgG1, IgG2, IgG3, IgG4 or IgE. Next, plates were incubated during 1h at 600 rpm in a microplate shaker (Corning, LSE Digital Microplate Shaker ref. CLS67814-1EA) at RT and protected from light. After the incubation, plates were washed manually three times with 200μl/well of wash buffer (PBS-Tween20 0.05%) on a magnetic washer (Millipore, ref. 40–285). A hundred microliters of biotinilated secondary antibody (anti-human IgM, IgG1, IgG2, IgG3, IgG4 or IgE) diluted in PBS-BN were added to all wells and incubated 45 min at 600rpm, RT and protected from light. The plate was washed as before and 100μl of streptavidin-R-phycoerythrin (Sigma, ref. 42250) diluted 1:1,000 in PBS-BN were added to all wells and incubated 30 min at 600rpm, RT and protected from light. Plates were washed three times as before, and beads resuspended in 100μl of PBS-BN and immediately read using the Luminex xMAP® 100/200 analyzer. At least 50 beads per analyte were acquired per sample. Crude median fluorescent intensity (MFI) and background fluorescence from blank wells were exported.
2.6. Use of a tertiary antibody in the antigen-specific IgG2 and IgE assays
The double antibody sandwiches tested for the antigen-specific IgG2 and IgE assays did not render enough signal for the measurement of these two antibodies. To increase the sensitivity of the assays we added a tertiary antibody. For these triple sandwiches, the secondary antibodies used were unconjugated mouse anti-human IgG2 and anti-human IgE diluted 1/500 in PBS-BN. The secondary antibody was incubated 60 min, followed by an incubation with anti-mouse IgG-Biotin diluted 1/1,000 in PBS-BN for 60 min, and a last incubation with streptavidin-R-phycoerythrin diluted 1:1,000 in PBS-BN 30 min. Incubations and washes in-between were as indicated in the previous section.
2.7. Assay reproducibility
For each isotype and IgG subclass, the coefficient of variation (CV%) was assessed for the duplicates and for the repeated measurements of the positive control in different plates. Means of CV% of duplicates per antigen and isotype-subclass were calculated.
3. Results
In the optimization of the IgGs and IgE assays, many different reagents and antibody sandwiches were tested, some of them discarded because there was no recognition of their expected target, or due to unspecific binding to other IgG subclasses or even to the antigen-coupled beads. Here we present the antibody combinations that better detected antigen-specific antibodies in human plasma or serum samples and that better worked for the development of the corresponding standard curves.
3.1. Standard curves
The primary human purified Ig used for the development of the standard curves are shown in Table 2, where serial dilutions are detailed. Figure 1 shows examples of the performance of each standard curve.
Table 2.
Details of primary antibody dilutions used for the development of the standard curves.
| Human purified Ig isotype/subclass | Fold dilution | Starting concentration (ng/ml) | Final concentration (ng/ml) | Serial dilutions |
|---|---|---|---|---|
| IgM (Sigma-Aldrich, I8260) | 2 | 1250 | 0.009536743 | 18 |
| IgG1 (Abcam, ab90283) | 2 | 1000 | 0.00762939 | 18 |
| IgG2 (Abcam, ab90284) | 2 | 2000 | 0.06103516 | 16 |
| IgG3 (Abcam, ab138703) | 2 | 1000 | 0.00762939 | 18 |
| IgG4 (Abcam, ab90286) | 2 | 500 | 0.01525879 | 16 |
| IgE (Abcam, ab65866) | 2 | 2000 | 0.06103516 | 16 |
3.2. Optimal antibody sandwiches and dilutions for each Ig isotype/subclass assay
The primary antibodies used for the optimization of the assays were the same used for the standard curves (Table 2). For the selection of the secondary and tertiary antibodies, the main criterion used was the generation of good standard curves. Antibodies selected were titrated to find optimal assay dilutions (Table 3).
Table 3.
Details of secondary-tertiary antibodies and Streptavidin-Phycoerythrin (SA-PE) reagents.
| Ig | Secondary antibody | Tertiary antibody | SA-PE |
|---|---|---|---|
| IgG1 | anti-IgG1-Biotin (Abcam, ab99775) 1:4000 | - | Streptavidin-R-phycoerythrin (Sigma, 42250) 1:1000 |
| IgG2 | mouse anti-human IgG2 (Thermo Fisher, MA1-34755) 1:500 | goat anti-mouse IgG-Biotin (Sigma, B7401-1ML) 1:1000 | |
| IgG3 | anti-IgG3-Biotin (Sigma, B3523) 1:1000 | - | |
| IgG4 | anti- IgG4-Biotin (Sigma, B3648) 1:8000 | - | |
| IgM | anti-IgM-Biotin (Sigma, B1265) 1:1000 | - | |
| Antigen-specific IgE | Mouse anti-human IgE (Abcam, ab99834) 1:250 | goat anti-mouse IgG-Biotin (Sigma, B7401-1ML) 1:125 | |
| Total IgE | anti-IgE-Biotin (Thermo Fisher, A18803) 1:2000 | - |
The human purified IgM captured by anti-IgM-coupled beads was detected by anti-IgM-Biotin (Sigma, B1265) diluted 1:1000. The human purified IgG1, 3 and 4 subclasses separately captured by anti-IgG-coupled beads were detected by anti-human IgG1-Biotin (Abcam, ab99775) at dilution 1:4,000, anti-human IgG3-Biotin (Sigma, B3523) at dilution 1:1,000 and anti-human IgG4-Biotin (Sigma, B3648) at dilution 1:8,000, respectively. For the IgG2 assay, after testing many different reagents, suppliers and incubation times, we did not find any biotinilated secondary antibody that performed properly. We solved the problem by using a triple sandwich including a secondary plus a tertiary biotinilated antibody: an unconjugated mouse anti-human IgG2 (Thermo Fisher, MA1-34755) diluted 1:500 and a goat anti-mouse IgG-Biotin (Sigma, B7401-1ML) diluted 1:1,000. The same situation happened for the antigen-specific IgE assay, therefore we chose as secondary antibody an unconjugated mouse anti-human IgE (Abcam, ab99834) diluted 1:250 and a goat anti-mouse IgG-Biotin (Sigma, B7401-1ML) diluted 1:125 as tertiary antibody. Separately, for an assay measuring total IgE, the primary antibody was captured by anti-IgE coupled beads and detected by anti-human IgE-Biotin (Thermo Fisher, A18803) diluted 1:2000. For all of the assays, the streptavidin-PE incubation was optimal at a 1:1000 dilution. Once all assays were developed, we decided to also test a triple sandwich for IgG4 to make it more comparable to IgG2, the other minority non-cytophilic subclass. The IgG4 triple sandwich was successfully developed, and antibodies and dilutions finally selected were: a mouse anti-human IgG4 (Thermo Fisher, MA1-80332) diluted 1:8,000 and the goat anti-mouse IgG-Biotin (Sigma, B7401-1ML) diluted 1:1,000.
3.3. Optimal plasma dilutions for each isotype/subclass assay
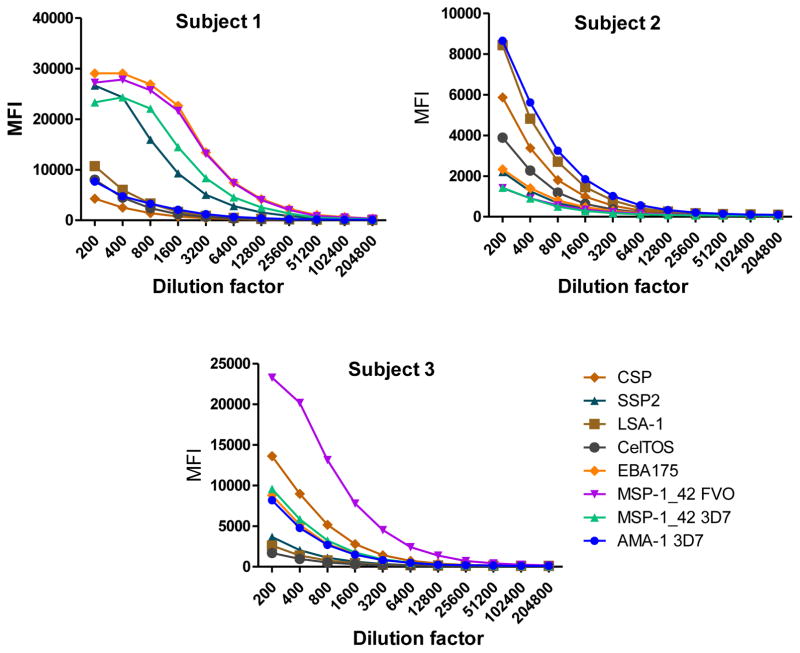
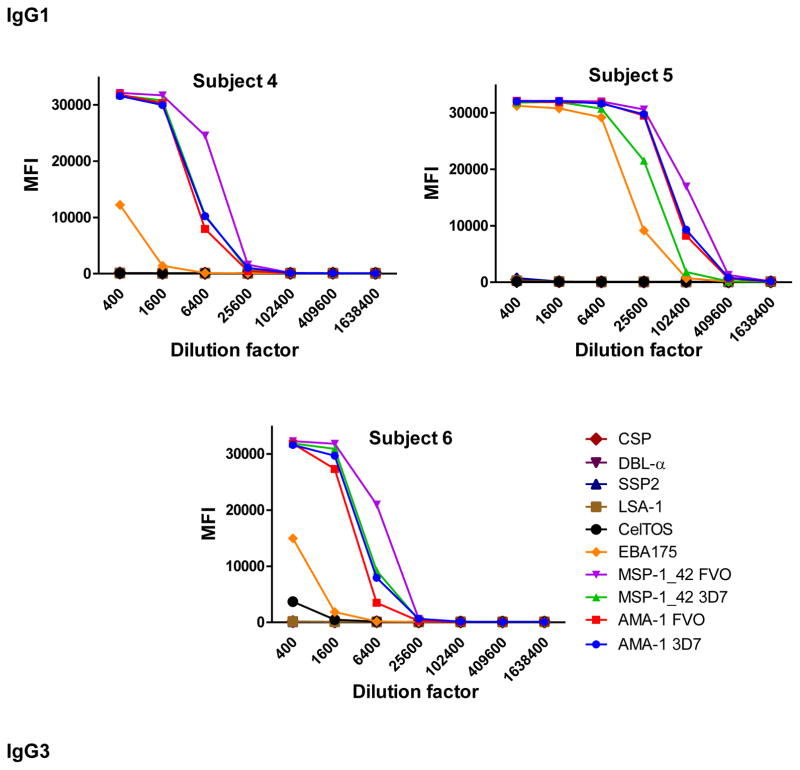
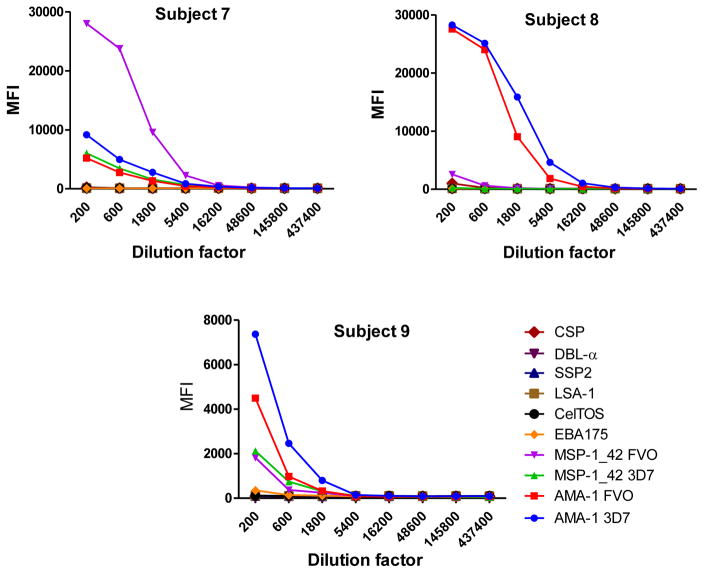
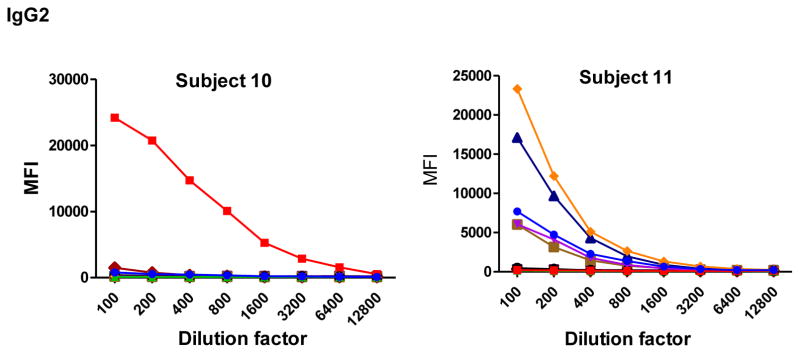
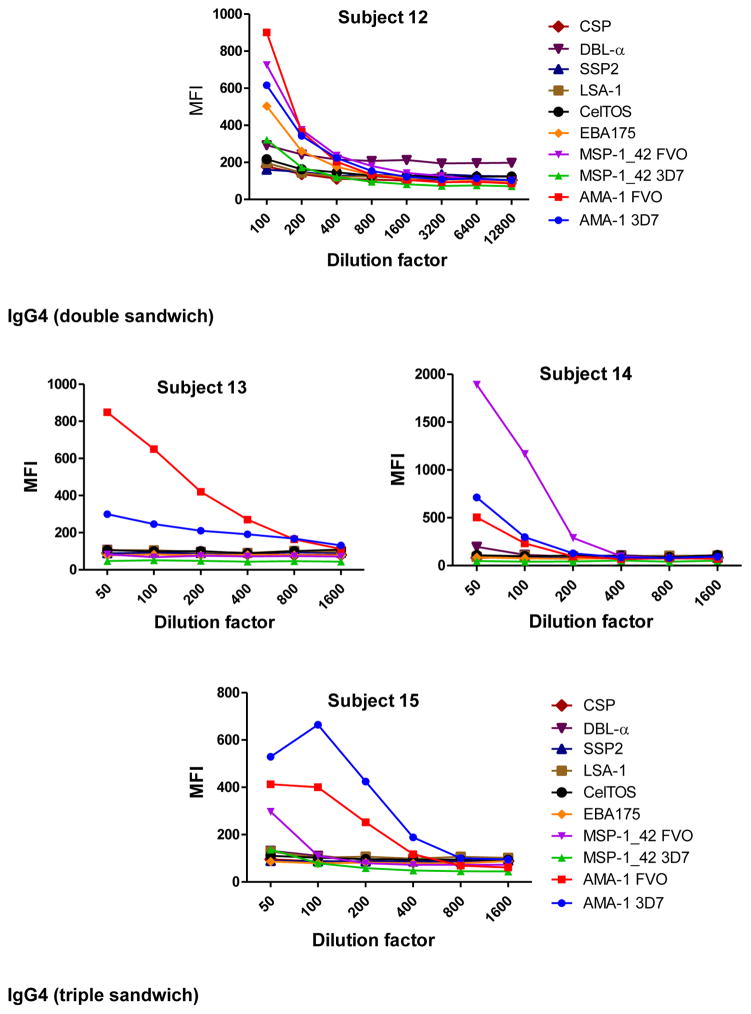
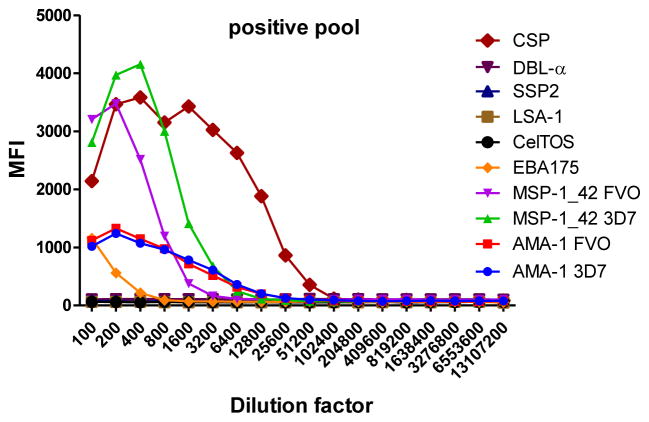
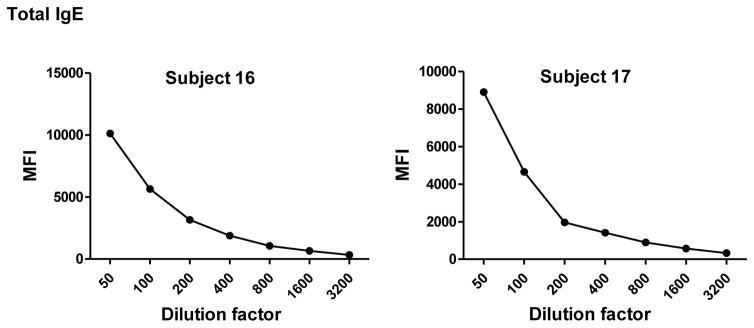
To determine the optimal sample dilutions, plasmas from 30 Mozambican individuals were tested in serial dilutions chosen depending on the expected levels for each Ig against P. falciparum antigens. Samples were diluted from 1:200 to 1:204,800 for IgM (Fig. 2), 1:400 to 1:1,638,400 for IgG1, 1:200 to 1:437,400 for IgG3 (Fig. 3), 1:50 to 1:12,800 for IgG2 and IgG4 (Fig. 4), and 1:10 to 1:1,771,470 for antigen-specific IgE and 1:50 to 1:25,600 for the total IgE assays (Fig. 5). To test the triple sandwich IgG4 assay, serial dilutions (1:100 to 1:13,107,200) of a pool of plasmas from hyperimmune adults were tested (Fig. 4).
Fig. 2.
Example of IgM levels measured in serial dilutions of plasma samples from 3 Mozambican adults against a panel of 8 Plasmodium falciparum antigens using anti-IgM-Biotin diluted 1:1,000 and streptavidin-PE at 1:1,000.
Fig. 3.
Examples of IgG1 (subjects 4,5 and 6) and IgG3 (subjects 7, 8 and 9) levels measured in serial dilutions of plasma samples from 6 Mozambican adults against a panel of 10 Plasmodium falciparum antigens using anti-human IgG1-Biotin at 1:4,000 and anti-human IgG3-Biotin at 1:1,000, respectively, and streptavidin-PE at 1:1,000.
Fig. 4.
Examples of IgG2 (subjects 10, 11 and 12) and IgG4 (subjects 13, 14 and 15) levels measured in serial dilutions of plasma samples from 6 Mozambican adults against a panel of 10 Plasmodium falciparum antigens using a triple (mouse anti-human IgG2 at 1:500 plus goat anti-mouse IgG-Biotin at 1:1,000) and double sandwich (anti-human IgG4-Biotin at 1:8,000), respectively, and incubated with streptavidin-PE at 1:1,000. Data obtained using a triple sandwich (mouse anti-human at 1:8,000 plus goat anti-mouse IgG-Biotin at 1:1,000) to measure IgG4 in a pool of plasmas from hyperimmune adults are also shown.
Fig. 5.
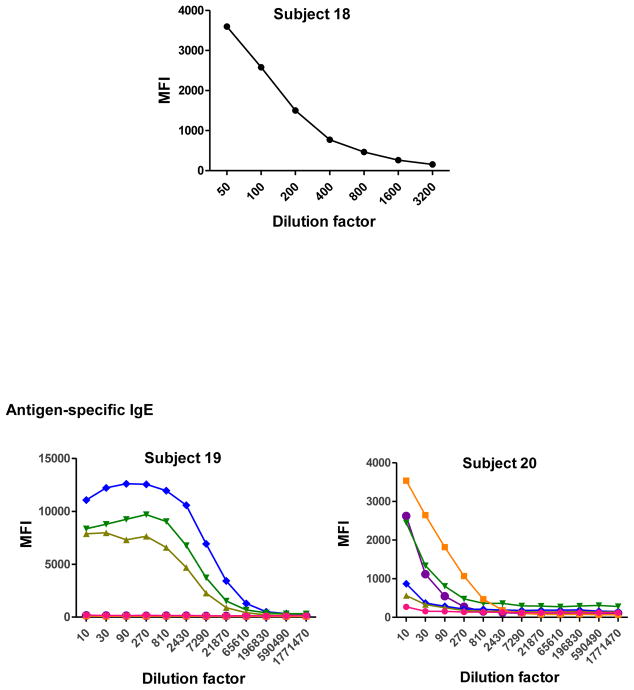
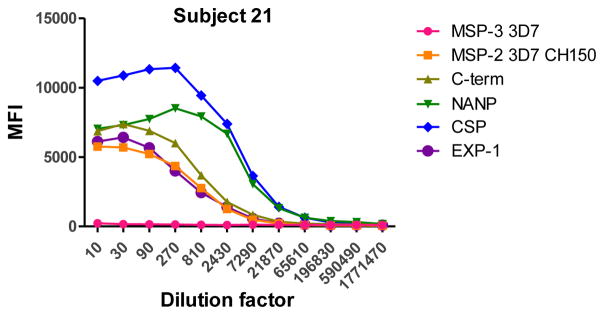
Total (subjects 16, 17 and 18) and antigen-specific (subjects 19, 20 and 21) IgE levels measured in serial dilutions of plasma samples from 6 Mozambican children. Total IgE has been measured using an anti-human IgE-Biotin diluted 1:2,000. IgE antigen-specific levels have been measured against a panel of 6 Plasmodium falciparum antigens using an unconjugated mouse anti-human IgE diluted 1:250 and a goat anti-mouse IgG-Biotin diluted 1:125. Streptavidin-PE was incubated at a 1:1,000.
IgM, IgG1 and IgG3 individual responses to the different antigens were of very different magnitudes (Fig. 2 and 3). IgG2, IgG4 and IgE responses in almost all the tested individuals were overall weak (Fig. 4 and 5). Accordingly to these results, for IgM, IgG1 and IgG3 we concluded to work with at least two dilutions per sample to increase the chances of one falling in the linear part of the standard curve, assuring reliable measurements. On the other hand, for IgG2, IgG4 and total IgE, we concluded that only one plasma dilution was needed because of the low signals observed. For the antigen-specific IgE assay, we decided to use 4 serial dilutions, being an almost unexplored isotype in the malaria field. Therefore, we chose 1:200 and 1:20,000 sample dilutions for IgM assay; 1:400 and 1:12,000 for IgG1; 1:200 and 1:1,000 for IgG3; 1:50 for IgG2, IgG4 and total IgE; and 1:30, 1:270, 1:2,430 and 1:21,870 for specific IgE.
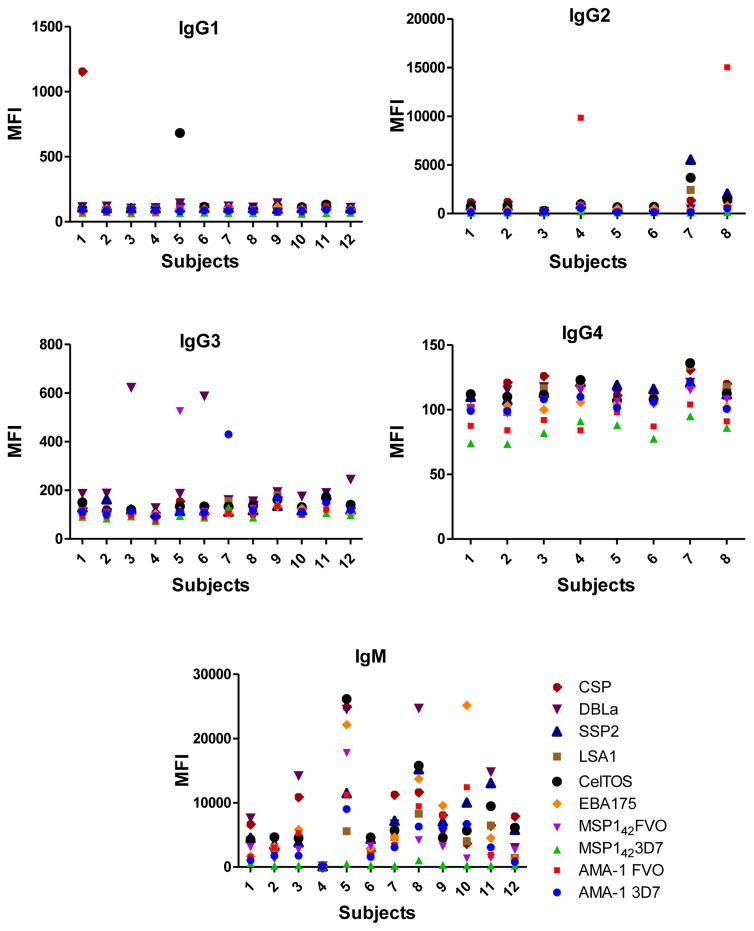
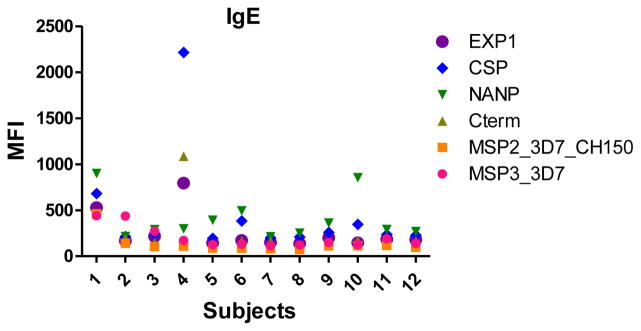
The positive control was assayed in the same dilutions as the samples. For the negative controls (European naïve individuals) the dilution chosen was the samples’ most concentrated for each isotype/subclass. Figure 6 shows examples of antibody levels in plasma samples from negative controls. Some malaria naïve individuals had a signal against some P. falciparum antigens, probably because of cross-reactivity of non-specific antibodies. For IgM, unspecific responses of negative controls were higher than for the other antibodies.
Fig. 6.
Example of levels of antigen-specific IgG1, IgG2, IgG3, IgG4, IgM and IgE measured in plasma from European naïve individuals, at the dilutions 1:400, 1:50, 1:200, 1:50, 1:200 and 1:30, respectively.
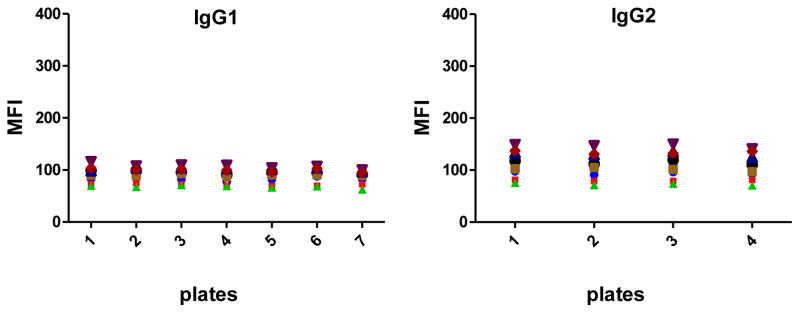
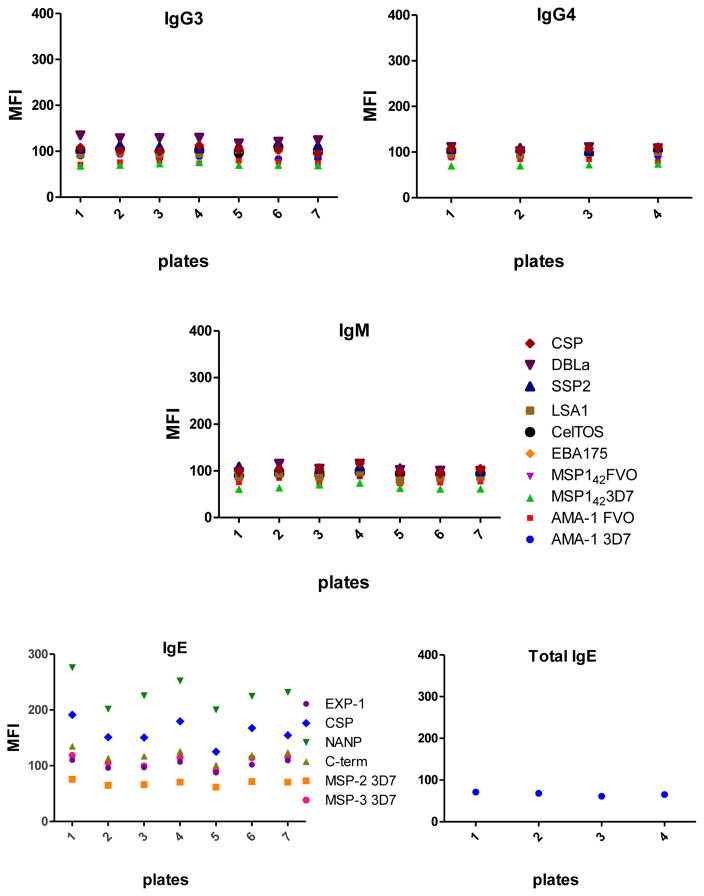
All 6 antigen-specific Ig assays showed very low background signals measured in blank wells (Fig. 7), being the antigen-specific IgE assay the one with higher MFIs when no sample was incubated.
Fig. 7.
Levels of background signal in each antigen-specific isotype/subclass assay.
3.4. Reproducibility intra- and inter-plate
Data from the positive controls (two dilutions for IgM, IgG1 and IgG3, one dilution for IgG2 and IgG4, and 4 dilutions for IgE) were tested in duplicates during 2 consecutive days in 7 different plates to assess the reproducibility of the assay between duplicates and plates. CVs between duplicates were 3.32% (1.13–5.09) for IgM, 3.27% (0.32–6.08) for IgG1, 3.98% (1.6–7.61) for IgG2, 3.72% (0.41–6.65) for IgG3, 3.66% (1.03–5.73) for IgG4, 4.45% (3.14–5.44) for specific IgE and 2.86% (2.26–3.47) for total IgE. The overall CV was 3.47%, indicating that the measurements were consistent. The CVs between different plates are shown in Table 4 (IgG1, IgG2, IgG3, IgG4 and IgM) and Table 5 (IgE) with CVs ranging from 1.55% to 27.58%.
Table 4.
Coefficients of variability of repeated measurements of Plasmodium antigen-specific IgG1, IgG2, IgG3, IgG4 and IgM assayed in the positive control.
| Ig | Dilution | AMA-1 3D7 | AMA-1 FVO | MSP-142 3D7 | MSP-142 FVO | EBA-175 | CelTOS | LSA-1 | SSP2 | DBL-α | CSP |
|---|---|---|---|---|---|---|---|---|---|---|---|
| IgG1 | 1 | 1.75 | 1.55 | 5.16 | 2.3 | 20.02 | 6.58 | 11.76 | 6.34 | 10.12 | 12.64 |
| 2 | 5.01 | 7.22 | 9.75 | 15.01 | 4.49 | 3.33 | 3.2 | 3.13 | 3.68 | 3 | |
| IgG2 | 1 | 8.93 | 7.33 | 9.65 | 13.33 | 4.9 | 8.24 | 12.6 | 8.56 | 9.67 | 9.31 |
| IgG3 | 1 | 1.59 | 1.7 | 11.53 | 3.14 | 7.65 | 12.45 | 19.68 | 27.4 | 15.12 | 26.41 |
| 2 | 14.54 | 11.03 | 20.33 | 18.68 | 21.09 | 5.42 | 7.64 | 19.55 | 4.69 | 18.75 | |
| IgG4 | 1 | 4.68 | 7.08 | 4.02 | 2.96 | 6.21 | 2.8 | 5.21 | 5.05 | 5.75 | 2.42 |
| IgM | 1 | 21.78 | 19.86 | 18.27 | 7.69 | 18.75 | 16.32 | 13.14 | 18.95 | 16.9 | 13.22 |
| 2 | 20.62 | 22.63 | 19.44 | 27.58 | 24.71 | 19.5 | 16.42 | 21.23 | 24.36 | 21.57 |
Table 5.
Coefficients of variation. 5A. Repeated measurements of antigen-specific IgE assayed with the positive control pool. 5B. Repeated measurements of total IgE.
| A.
| |||||||
|---|---|---|---|---|---|---|---|
| Ig | Dilution | MSP-3 3D7 | MSP-2 3D7 CH150 | C-term | NANP | CSP | EXP-1 |
| Antigen-specific IgE | 1 | 16.4 | 13.51 | 14.43 | 16.15 | 17.38 | 16.27 |
| 2 | 11.06 | 5.99 | 9.79 | 8.52 | 7.35 | 10.45 | |
| 3 | 11.92 | 17.03 | 9.89 | 8.06 | 6.97 | 18.38 | |
| 4 | 9.55 | 13.71 | 17.15 | 14.16 | 13.28 | 18.47 | |
| B.
| |
|---|---|
| Ig | CV% |
| Total IgE | 5.24 |
4. Discussion
The identification of the antibodies generated after infection or vaccination, their magnitude, and their antigen specificity, are essential to improve the development of more efficient vaccines against malaria. With this purpose, we have developed six qSAT protocols to measure antigen-specific IgM, IgG1, IgG2, IgG3, IgG4 and IgGE against P. falciparum antigens.
Many studies in the field of human humoral response to P. falciparum have been conducted using the ELISA24, 33, 49, 50 or qSAT48,5, 51. However, to our knowledge, this is the first time that the qSAT has been adapted to measure different antigen-specific Ig isotypes and subclasses, specifically IgM, IgG1, IgG2, IgG3, IgG4 and IgE using a multiplex panel of P. falciparum pre-erythrocytic and blood stage antigens.
The most difficult part during the development of the assays was finding the right combination of antibody pairs able to detect both the human purified Ig used in the standard curves and the natural Ig present in plasma samples. There are many commercial sources with a large catalogue of biotinylated secondary antibodies available and it is difficult to know where to start. Even with reagents referenced in published studies, we did not always get acceptable results. For some antibody combinations, we did not get any signal. For others, we got signals in the standard curves but not in the samples, or vice versa; others showed high background signals. Another challenge we faced was that some secondary antibodies had very variable bath-to-batch activity, forcing us to titrate each new lot and always test for background signal. In the case of IgG2 and IgE assays, where we finally decided to use of a triple sandwich, a double titration was required including secondary and tertiary antibodies. All these requirements made the optimization of these assays a labor-intense and long process.
The use of a triple sandwich for IgG2 and IgE was chosen to increase the sensibility of the assays because the double sandwich yielded very poor signals. In addition, despite having developed a successful IgG4 assay using a double sandwich, the use of a triple sandwich also increased the sensibility, thus being adopted for subsequent studies.
Regarding assay reproducibility, the CVs between plates never reached 30% for any isotype/subclass, however it was between 20–30% for some antigens. To decrease the variability and increase the accuracy of the assays, future optimization efforts will explore modifying samples incubation times and temperatures.
Concerning assay specificity, the anti-P. falciparum-Ig signal detected in negative controls was overall low except in few subjects for IgG2, and especially for IgM, reaching high MFIs in some individuals. IgM has as a natural quality to be highly polyreactive against foreign and self-antigens, and it is thought to aid in the neutralization of pathogens prior to the development of high affinity, antigen-specific antibodies; it may also facilitate the clearance of apoptotic cells and/or autoantigen-immunocomplexes52. The possibility that this polyreactivity could provide some protection against pathogens that have not yet ben “seen” by the immune system of the host has been proposed53, 54. Thus, even in the naïve population (as are our negative controls) unexpected elevated levels of IgM with these characteristics can be detected. A cross-reactivity of IgM with antigens from other pathogens to which the negative controls have been exposed is another plausible explanation. Nevertheless, other negative controls will be tested in future IgM assays to find out if this was a problem with these specific negative controls or if it is something generalized. In parallel, other reagents, such as the biotinylated detection antibody, and other assay conditions like the temperature of samples incubation, will be assessed to try to reduce the background signal and improve the assay performance. Nevertheless, the rest of assay background signals were low, between 61 and 276 MFI overall. All secondary and tertiary antibodies were selected because they showed levels below 300 MFI. Some reagents were discarded for having higher than expected background. The IgE-specific assay was the one with higher values but still considered in a good range.
The inclusion of a standard curve55 in the assay is important as a quality control tool and applicable to choose the adequate sample dilution closer to EC50, to be used in data preprocessing. The standard curve may also be used for the normalization of the data to correct the variability between plates. This can be done by using a dilution point in the linear part of the curve to calculate a correction factor as the ratio between the median of this point from all plates divided by the same point in the specific plate. The normalization factor is then isotype-specific. In addition, the standard curve can also be used to calculate concentrations in arbitrary units, as was done for IgG and IgM assays in prior studies32, 47.
Regarding the selection of the sample dilutions optimal for each isotype/subclass assay, the choice will always depend on several factors: i) the demographic and clinical characteristics of the study population, (i.e. age, level of malaria exposure, pregnancy, treatment), ii) the objective of the study (i.e. to explore natural or artificially-acquired immunity through vaccination), and iii) the immunogenicity of the antigens in the study panel. In the case of P. falciparum immunoassays, and to assure that at least one sample dilution will always fall on the linear (quantifiable) part of the standard curve, we recommend to test them in at least two dilutions for IgM, IgG1 and IgG3, while only one dilution may be required for IgG2 and IgG4. Regarding total and antigen-specific IgE assays, we suggest 1 dilution for total IgE and 4 dilutions for antigen-specific IgE, since little is known about this isotype in malaria immunity. Nevertheless, we reiterate that depending on the characteristics of the study population and the immunogenicity of the antigens included in the panel, several serial dilution(s) of a representative set of samples have to be previously tested to guarantee an optimal choice and avoid out-of-range MFI values in the qSAT, or other difficulties like the prozone or hook effect56.
Beyond malaria, a great advantage of the qSAT is the possibility to optimize the measurement of different antibody isotypes and subclasses against all kinds of antigens from all kind of pathogens or conditions. This is a very powerful tool to address co-infections, a common situation in malaria endemic countries but often ignored when immune responses are explored and addressed individually.
5. Conclusion
A better characterization of the human immune response against P. falciparum is key to understand the mechanisms underlying protection, which in turn will allow the design of more effective vaccines. The 6 assays developed in this study demonstrate that the qSAT is a powerful mid-high throughput approach to evaluate antigen-specific responses of different Ig isotype/subclasses against multiplexed P. falciparum antigens. These 6 assays will allow performing detailed immuno-profilings against antigens from P. falciparum and other pathogens to better address natural and vaccine-induced humoral immune responses.
Acknowledgments
We would like to thank all the participants who donated samples for the study. We are grateful to Laura Puyol and Diana Barrios for lab logistics support, Alfons Jimenez for Luminex support, and Sheetij Dutta, Evelina Angov, David Cavanagh, Alfredo Mayor, Chetan E. Chitnis and Virander S Chauhan for provision of recombinant antigens.
Funding
This work received support from the Instituto de Salud Carlos III (grant numbers PS11/00423, PI14/01422), NIH-NIAID (grant number R01AI095789), PATH Malaria Vaccine Initiative, EU FP6 (grant number 18902), The Sidra Medical and Research Center, and the Agency for Management of University and Research Grants (AGAUR grant number 2014SGR991). ISGlobal is a member of the CERCA Programme, Generalitat de Catalunya.
Footnotes
Competing interests
The authors declare that they have no competing interests.
Availability of data and materials
Data obtained in this study and more details are available from the corresponding author on reasonable request.
Ethics approval
Approval for the protocols was obtained from the Hospital Clínic of Barcelona Ethics Review Committee and the National Mozambican Ethics Review Committee.
Publisher's Disclaimer: This is a PDF file of an unedited manuscript that has been accepted for publication. As a service to our customers we are providing this early version of the manuscript. The manuscript will undergo copyediting, typesetting, and review of the resulting proof before it is published in its final citable form. Please note that during the production process errors may be discovered which could affect the content, and all legal disclaimers that apply to the journal pertain.
References
- 1.WHO. World Malaria Report 2015. 2015 http://wwwwhoint/malaria/publications/world-malaria-report-2015/report/en/
- 2.Doolan DL, Dobano C, Baird JK. Acquired immunity to malaria. Clin Microbiol Rev. 2009;22(1):13–36. doi: 10.1128/CMR.00025-08. Table of Contents. [DOI] [PMC free article] [PubMed] [Google Scholar]
- 3.Moncunill G, Mayor A, Bardaji A, Puyol L, Nhabomba A, Barrios D, et al. Cytokine profiling in immigrants with clinical malaria after extended periods of interrupted exposure to Plasmodium falciparum. PLoS One. 2013;8(8):e73360. doi: 10.1371/journal.pone.0073360. [DOI] [PMC free article] [PubMed] [Google Scholar]
- 4.Rogier E, Moss DM, Chard AN, Trinies V, Doumbia S, Freeman MC, et al. Evaluation of Immunoglobulin G Responses to Plasmodium falciparum and Plasmodium vivax in Malian School Children Using Multiplex Bead Assay. Am J Trop Med Hyg. 2017;96(2):312–8. doi: 10.4269/ajtmh.16-0476. [DOI] [PMC free article] [PubMed] [Google Scholar]
- 5.Fouda GG, Leke RF, Long C, Druilhe P, Zhou A, Taylor DW, et al. Multiplex assay for simultaneous measurement of antibodies to multiple Plasmodium falciparum antigens. Clin Vaccine Immunol. 2006;13(12):1307–13. doi: 10.1128/CVI.00183-06. [DOI] [PMC free article] [PubMed] [Google Scholar]
- 6.Cohen S, Mc GI, Carrington S. Gamma-globulin and acquired immunity to human malaria. Nature. 1961;192:733–7. doi: 10.1038/192733a0. [DOI] [PubMed] [Google Scholar]
- 7.Tongren JE, Drakeley CJ, McDonald SL, Reyburn HG, Manjurano A, Nkya WM, et al. Target antigen, age, and duration of antigen exposure independently regulate immunoglobulin G subclass switching in malaria. Infect Immun. 2006;74(1):257–64. doi: 10.1128/IAI.74.1.257-264.2006. [DOI] [PMC free article] [PubMed] [Google Scholar]
- 8.Scopel KK, Fontes CJ, Ferreira MU, Braga EM. Factors associated with immunoglobulin G subclass polarization in naturally acquired antibodies to Plasmodium falciparum merozoite surface proteins: a cross-sectional survey in Brazilian Amazonia. Clin Vaccine Immunol. 2006;13(7):810–3. doi: 10.1128/CVI.00095-06. [DOI] [PMC free article] [PubMed] [Google Scholar]
- 9.Branch OH, Udhayakumar V, Hightower AW, Oloo AJ, Hawley WA, Nahlen BL, et al. A longitudinal investigation of IgG and IgM antibody responses to the merozoite surface protein-1 19-kiloDalton domain of Plasmodium falciparum in pregnant women and infants: associations with febrile illness, parasitemia, and anemia. Am J Trop Med Hyg. 1998;58(2):211–9. doi: 10.4269/ajtmh.1998.58.211. [DOI] [PubMed] [Google Scholar]
- 10.Perlmann P, Perlmann H, Flyg BW, Hagstedt M, Elghazali G, Worku S, et al. Immunoglobulin E, a pathogenic factor in Plasmodium falciparum malaria. Infect Immun. 1997;65(1):116–21. doi: 10.1128/iai.65.1.116-121.1997. [DOI] [PMC free article] [PubMed] [Google Scholar]
- 11.Gunn BM, Alter G. Modulating Antibody Functionality in Infectious Disease and Vaccination. Trends Mol Med. 2016;22(11):969–82. doi: 10.1016/j.molmed.2016.09.002. [DOI] [PMC free article] [PubMed] [Google Scholar]
- 12.Chung AW, Kumar MP, Arnold KB, Yu WH, Schoen MK, Dunphy LJ, et al. Dissecting Polyclonal Vaccine-Induced Humoral Immunity against HIV Using Systems Serology. Cell. 2015;163(4):988–98. doi: 10.1016/j.cell.2015.10.027. [DOI] [PMC free article] [PubMed] [Google Scholar]
- 13.Ackerman ME, Mikhailova A, Brown EP, Dowell KG, Walker BD, Bailey-Kellogg C, et al. Polyfunctional HIV-Specific Antibody Responses Are Associated with Spontaneous HIV Control. PLoS Pathog. 2016;12(1):e1005315. doi: 10.1371/journal.ppat.1005315. [DOI] [PMC free article] [PubMed] [Google Scholar]
- 14.Bouharoun-Tayoun H, Druilhe P. Plasmodium falciparum malaria: evidence for an isotype imbalance which may be responsible for delayed acquisition of protective immunity. Infect Immun. 1992;60(4):1473–81. doi: 10.1128/iai.60.4.1473-1481.1992. [DOI] [PMC free article] [PubMed] [Google Scholar]
- 15.Bouharoun-Tayoun H, Oeuvray C, Lunel F, Druilhe P. Mechanisms underlying the monocyte-mediated antibody-dependent killing of Plasmodium falciparum asexual blood stages. J Exp Med. 1995;182(2):409–18. doi: 10.1084/jem.182.2.409. [DOI] [PMC free article] [PubMed] [Google Scholar]
- 16.Cavanagh DR, Dobano C, Elhassan IM, Marsh K, Elhassan A, Hviid L, et al. Differential patterns of human immunoglobulin G subclass responses to distinct regions of a single protein, the merozoite surface protein 1 of Plasmodium falciparum. Infect Immun. 2001;69(2):1207–11. doi: 10.1128/IAI.69.2.1207-1211.2001. [DOI] [PMC free article] [PubMed] [Google Scholar]
- 17.Boyle MJ, Reiling L, Feng G, Langer C, Osier FH, Aspeling-Jones H, et al. Human antibodies fix complement to inhibit Plasmodium falciparum invasion of erythrocytes and are associated with protection against malaria. Immunity. 2015;42(3):580–90. doi: 10.1016/j.immuni.2015.02.012. S1074-7613(15)00087-4 [pii] [DOI] [PMC free article] [PubMed] [Google Scholar]
- 18.Osier FH, Feng G, Boyle MJ, Langer C, Zhou J, Richards JS, et al. Opsonic phagocytosis of Plasmodium falciparum merozoites: mechanism in human immunity and a correlate of protection against malaria. BMC Med. 2014;12:108. doi: 10.1186/1741-7015-12-1081741-7015-12-108. [pii] [DOI] [PMC free article] [PubMed] [Google Scholar]
- 19.Arama C, Skinner J, Doumtabe D, Portugal S, Tran TM, Jain A, et al. Genetic Resistance to Malaria Is Associated With Greater Enhancement of Immunoglobulin (Ig)M Than IgG Responses to a Broad Array of Plasmodium falciparum Antigens. Open Forum Infect Dis. 2015;2(3):ofv118. doi: 10.1093/ofid/ofv118. ofv118 [pii] [DOI] [PMC free article] [PubMed] [Google Scholar]
- 20.Rinchai D, Presnell S, Vidal M, Dutta S, Chauhan V, Cavanagh D, et al. Blood Interferon Signatures Putatively Link Lack of Protection Conferred by the RTS, S Recombinant Malaria Vaccine to an Antigen-specific IgE Response. F1000Res. 2015;4:919. doi: 10.12688/f1000research.7093.2. [DOI] [PMC free article] [PubMed] [Google Scholar]
- 21.Calissano C, Modiano D, Sirima BS, Konate A, Sanou I, Sawadogo A, et al. IgE antibodies to Plasmodium falciparum and severity of malaria in children of one ethnic group living in Burkina Faso. Am J Trop Med Hyg. 2003;69(1):31–5. [PubMed] [Google Scholar]
- 22.Perlmann P, Perlmann H, Looareesuwan S, Krudsood S, Kano S, Matsumoto Y, et al. Contrasting functions of IgG and IgE antimalarial antibodies in uncomplicated and severe Plasmodium falciparum malaria. Am J Trop Med Hyg. 2000;62(3):373–7. doi: 10.4269/ajtmh.2000.62.373. [DOI] [PubMed] [Google Scholar]
- 23.Israelsson E, Balogun H, Vasconcelos NM, Beser J, Roussilhon C, Rogier C, et al. Antibody responses to a C-terminal fragment of the Plasmodium falciparum blood-stage antigen Pf332 in Senegalese individuals naturally primed to the parasite. Clin Exp Immunol. 2008;152(1):64–71. doi: 10.1111/j.1365-2249.2008.03607.x. [DOI] [PMC free article] [PubMed] [Google Scholar]
- 24.Ahmed Ismail H, Tijani MK, Langer C, Reiling L, White MT, Beeson JG, et al. Subclass responses and their half-lives for antibodies against EBA175 and PfRh2 in naturally acquired immunity against Plasmodium falciparum malaria. Malar J. 2014;13:425. doi: 10.1186/1475-2875-13-425. [DOI] [PMC free article] [PubMed] [Google Scholar]
- 25.Medeiros MM, Fotoran WL, dalla Martha RC, Katsuragawa TH, Pereira da Silva LH, Wunderlich G. Natural antibody response to Plasmodium falciparum merozoite antigens MSP5, MSP9 and EBA175 is associated to clinical protection in the Brazilian Amazon. BMC Infect Dis. 2013;13:608. doi: 10.1186/1471-2334-13-608. [DOI] [PMC free article] [PubMed] [Google Scholar]
- 26.Brown EP, Licht AF, Dugast AS, Choi I, Bailey-Kellogg C, Alter G, et al. High-throughput, multiplexed IgG subclassing of antigen-specific antibodies from clinical samples. J Immunol Methods. 2012;386(1–2):117–23. doi: 10.1016/j.jim.2012.09.007. [DOI] [PMC free article] [PubMed] [Google Scholar]
- 27.Smits GP, van Gageldonk PG, Schouls LM, van der Klis FR, Berbers GA. Development of a bead-based multiplex immunoassay for simultaneous quantitative detection of IgG serum antibodies against measles, mumps, rubella, and varicella-zoster virus. Clin Vaccine Immunol. 2012;19(3):396–400. doi: 10.1128/CVI.05537-11. [DOI] [PMC free article] [PubMed] [Google Scholar]
- 28.Perraut R, Richard V, Varela ML, Trape JF, Guillotte M, Tall A, et al. Comparative analysis of IgG responses to Plasmodium falciparum MSP1p19 and PF13-DBL1alpha1 using ELISA and a magnetic bead-based duplex assay (MAGPIX(R)-Luminex) in a Senegalese meso-endemic community. Malar J. 2014;13:410. doi: 10.1186/1475-2875-13-410. [DOI] [PMC free article] [PubMed] [Google Scholar]
- 29.Basile AJ, Horiuchi K, Panella AJ, Laven J, Kosoy O, Lanciotti RS, et al. Multiplex microsphere immunoassays for the detection of IgM and IgG to arboviral diseases. PLoS One. 2013;8(9):e75670. doi: 10.1371/journal.pone.0075670. [DOI] [PMC free article] [PubMed] [Google Scholar]
- 30.Aranda C, Aponte JJ, Saute F, Casimiro S, Pinto J, Sousa C, et al. Entomological characteristics of malaria transmission in Manhica, a rural area in southern Mozambique. J Med Entomol. 2005;42(2):180–6. doi: 10.1093/jmedent/42.2.180. [DOI] [PubMed] [Google Scholar]
- 31.Aguilar R, Machevo S, Menendez C, Bardaji A, Nhabomba A, Alonso PL, et al. Comparison of placental blood microscopy and the ICT HRP2 rapid diagnostic test to detect placental malaria. Trans R Soc Trop Med Hyg. 2012;106(9):573–5. doi: 10.1016/j.trstmh.2012.05.001. [DOI] [PubMed] [Google Scholar]
- 32.Campo JJ, Dobano C, Sacarlal J, Guinovart C, Mayor A, Angov E, et al. Impact of the RTS, S malaria vaccine candidate on naturally acquired antibody responses to multiple asexual blood stage antigens. PLoS One. 2011;6(10):e25779. doi: 10.1371/journal.pone.0025779. [DOI] [PMC free article] [PubMed] [Google Scholar]
- 33.Nhabomba AJ, Guinovart C, Jimenez A, Manaca MN, Quinto L, Cistero P, et al. Impact of age of first exposure to Plasmodium falciparum on antibody responses to malaria in children: a randomized, controlled trial in Mozambique. Malar J. 2014;13:121. doi: 10.1186/1475-2875-13-121. [DOI] [PMC free article] [PubMed] [Google Scholar]
- 34.Kariu T, Ishino T, Yano K, Chinzei Y, Yuda M. CelTOS, a novel malarial protein that mediates transmission to mosquito and vertebrate hosts. Mol Microbiol. 2006;59(5):1369–79. doi: 10.1111/j.1365-2958.2005.05024.x. [DOI] [PubMed] [Google Scholar]
- 35.Hillier CJ, Ware LA, Barbosa A, Angov E, Lyon JA, Heppner DG, et al. Process development and analysis of liver-stage antigen 1, a preerythrocyte-stage protein-based vaccine for Plasmodium falciparum. Infect Immun. 2005;73(4):2109–15. doi: 10.1128/IAI.73.4.2109-2115.2005. [DOI] [PMC free article] [PubMed] [Google Scholar]
- 36.Rogers WO, Malik A, Mellouk S, Nakamura K, Rogers MD, Szarfman A, et al. Characterization of Plasmodium falciparum sporozoite surface protein 2. Proc Natl Acad Sci U S A. 1992;89(19):9176–80. doi: 10.1073/pnas.89.19.9176. [DOI] [PMC free article] [PubMed] [Google Scholar]
- 37.Plassmeyer ML, Reiter K, Shimp RL, Jr, Kotova S, Smith PD, Hurt DE, et al. Structure of the Plasmodium falciparum circumsporozoite protein, a leading malaria vaccine candidate. J Biol Chem. 2009;284(39):26951–63. doi: 10.1074/jbc.M109.013706. [DOI] [PMC free article] [PubMed] [Google Scholar]
- 38.Kocken CH, Withers-Martinez C, Dubbeld MA, van der Wel A, Hackett F, Valderrama A, et al. High-level expression of the malaria blood-stage vaccine candidate Plasmodium falciparum apical membrane antigen 1 and induction of antibodies that inhibit erythrocyte invasion. Infect Immun. 2002;70(8):4471–6. doi: 10.1128/IAI.70.8.4471-4476.2002. [DOI] [PMC free article] [PubMed] [Google Scholar]
- 39.Reddy KS, Amlabu E, Pandey AK, Mitra P, Chauhan VS, Gaur D. Multiprotein complex between the GPI-anchored CyRPA with PfRH5 and PfRipr is crucial for Plasmodium falciparum erythrocyte invasion. Proc Natl Acad Sci U S A. 2015;112(4):1179–84. doi: 10.1073/pnas.1415466112. [DOI] [PMC free article] [PubMed] [Google Scholar]
- 40.Dutta S, Lee SY, Batchelor AH, Lanar DE. Structural basis of antigenic escape of a malaria vaccine candidate. Proc Natl Acad Sci U S A. 2007;104(30):12488–93. doi: 10.1073/pnas.0701464104. [DOI] [PMC free article] [PubMed] [Google Scholar]
- 41.Angov E, Aufiero BM, Turgeon AM, Van Handenhove M, Ockenhouse CF, Kester KE, et al. Development and pre-clinical analysis of a Plasmodium falciparum Merozoite Surface Protein-1(42) malaria vaccine. Mol Biochem Parasitol. 2003;128(2):195–204. doi: 10.1016/s0166-6851(03)00077-x. S016668510300077X. [DOI] [PubMed] [Google Scholar]
- 42.Angov E, Hillier CJ, Kincaid RL, Lyon JA. Heterologous protein expression is enhanced by harmonizing the codon usage frequencies of the target gene with those of the expression host. PLoS One. 2008;3(5):e2189. doi: 10.1371/journal.pone.0002189. [DOI] [PMC free article] [PubMed] [Google Scholar]
- 43.Pandey KC, Singh S, Pattnaik P, Pillai CR, Pillai U, Lynn A, et al. Bacterially expressed and refolded receptor binding domain of Plasmodium falciparum EBA-175 elicits invasion inhibitory antibodies. Mol Biochem Parasitol. 2002;123(1):23–33. doi: 10.1016/s0166-6851(02)00122-6. S0166685102001226. [DOI] [PubMed] [Google Scholar]
- 44.Mayor A, Rovira-Vallbona E, Srivastava A, Sharma SK, Pati SS, Puyol L, et al. Functional and immunological characterization of a Duffy binding-like alpha domain from Plasmodium falciparum erythrocyte membrane protein 1 that mediates rosetting. Infect Immun. 2009;77(9):3857–63. doi: 10.1128/IAI.00049-09. [DOI] [PMC free article] [PubMed] [Google Scholar]
- 45.Laurens MB, Thera MA, Coulibaly D, Ouattara A, Kone AK, Guindo AB, et al. Extended safety, immunogenicity and efficacy of a blood-stage malaria vaccine in malian children: 24-month follow-up of a randomized, double-blinded phase 2 trial. PLoS One. 2013;8(11):e79323. doi: 10.1371/journal.pone.0079323. PONE-D-13-16558 [pii] [DOI] [PMC free article] [PubMed] [Google Scholar]
- 46.Otsyula N, Angov E, Bergmann-Leitner E, Koech M, Khan F, Bennett J, et al. Results from tandem Phase 1 studies evaluating the safety, reactogenicity and immunogenicity of the vaccine candidate antigen Plasmodium falciparum FVO merozoite surface protein-1 (MSP1(42)) administered intramuscularly with adjuvant system AS01. Malar J. 2013;12:29. doi: 10.1186/1475-2875-12-291475-2875-12-29. [pii] [DOI] [PMC free article] [PubMed] [Google Scholar]
- 47.Aguilar R, Casabonne D, O’Callaghan-Gordo C, Vidal M, Campo JJ, Mutalima N, et al. Assessment of the combined effect of Epstein-Barr virus and Plasmodium falciparum infections on endemic Burkitt lymphoma using a multiplex serological approach. Frontiers in Immunology. 2017 doi: 10.3389/fimmu.2017.01284. Provissionally accepted. [DOI] [PMC free article] [PubMed] [Google Scholar]
- 48.Ondigo BN, Park GS, Gose SO, Ho BM, Ochola LA, Ayodo GO, et al. Standardization and validation of a cytometric bead assay to assess antibodies to multiple Plasmodium falciparum recombinant antigens. Malar J. 2012;11:427. doi: 10.1186/1475-2875-11-427. [DOI] [PMC free article] [PubMed] [Google Scholar]
- 49.Mbengue B, Niang B, Niang MS, Varela ML, Fall B, Fall MM, et al. Inflammatory cytokine and humoral responses to Plasmodium falciparum glycosylphosphatidylinositols correlates with malaria immunity and pathogenesis. Immun Inflamm Dis. 2016;4(1):24–34. doi: 10.1002/iid3.89. [DOI] [PMC free article] [PubMed] [Google Scholar]
- 50.Wang Q, Zhao Z, Zhang X, Li X, Zhu M, Li P, et al. Naturally Acquired Antibody Responses to Plasmodium vivax and Plasmodium falciparum Merozoite Surface Protein 1 (MSP1) C-Terminal 19 kDa Domains in an Area of Unstable Malaria Transmission in Southeast Asia. PLoS One. 2016;11(3):e0151900. doi: 10.1371/journal.pone.0151900. [DOI] [PMC free article] [PubMed] [Google Scholar]
- 51.Cham GK, Kurtis J, Lusingu J, Theander TG, Jensen AT, Turner L. A semi-automated multiplex high-throughput assay for measuring IgG antibodies against Plasmodium falciparum erythrocyte membrane protein 1 (PfEMP1) domains in small volumes of plasma. Malar J. 2008;7:108. doi: 10.1186/1475-2875-7-108. [DOI] [PMC free article] [PubMed] [Google Scholar]
- 52.Jones DD, DeIulio GA, Winslow GM. Antigen-driven induction of polyreactive IgM during intracellular bacterial infection. J Immunol. 2012;189(3):1440–7. doi: 10.4049/jimmunol.1200878. [DOI] [PMC free article] [PubMed] [Google Scholar]
- 53.Eisen HN, Chakraborty AK. Evolving concepts of specificity in immune reactions. Proc Natl Acad Sci U S A. 2010;107(52):22373–80. doi: 10.1073/pnas.10120511081012051108. [pii] [DOI] [PMC free article] [PubMed] [Google Scholar]
- 54.Ochsenbein AF, Fehr T, Lutz C, Suter M, Brombacher F, Hengartner H, et al. Control of early viral and bacterial distribution and disease by natural antibodies. Science. 1999;286(5447):2156–9. 8051. doi: 10.1126/science.286.5447.2156. [pii] [DOI] [PubMed] [Google Scholar]
- 55.Gottschalk PG, Dunn JR. The five-parameter logistic: a characterization and comparison with the four-parameter logistic. Anal Biochem. 2005;343(1):54–65. doi: 10.1016/j.ab.2005.04.035. [DOI] [PubMed] [Google Scholar]
- 56.Dodig S. Interferences in quantitative immunochemical methods. Biochemia Medica. 2009;19(1):50–62. [Google Scholar]


