

Abstract
Numerous universities and colleges offer coursework approved by the Behavior Analyst Certification Board. Despite uniform requirements for approval, many differences exist among programs. To provide the field of behavior analysis with information about these differences, we conducted an initial analysis of programmatic variables and their relationship to pass rates on the Board Certified Behavior Analyst examination.
Given the variety of preparation programs currently approved by the certification board, behavior analysts from different programs will likely differ with regard to their training and experiences.
It is imperative that graduates from programs preparing behavior analysts are passing the examination to become board certified to fill specified jobs.
Statistically significant variables associated with increased examination pass rates for programs include on-campus course delivery and accreditation by the Association for Behavior Analysis International.
Variables lacking statistical significance with regard to impact on examination pass rates include the provision of supervision experience and the number of individuals from a program sitting for an exam.
Keywords: Examination, Pass rates, Programs, Behavior analysis, Regression
Towards a Meaningful Examination of Behavior Analyst Preparation Programs
In 1998, the Behavior Analyst Certification Board (BACB®) was created to “meet professional credentialing needs identified by behavior analysts, governments, and consumers of behavior analysis services” (About the BACB, n.d., para 1). In the years since the creation of the BACB®, the field of behavior analysis, particularly applied behavior analysis (ABA), has grown at a rapid pace. Recent reports from the BACB® indicate that the number of Board Certified Behavior Analysts (BCBA®) increased from approximately 1500 in 2003 to nearly 11,000 in 2013 (BACB, 2013). Dorsey, Weinberg, Zane, and Guidi (2009) attributed this growth to the demand for ABA-based interventions in the wake of increasing autism prevalence rates, resulting in the “evolution of the field of applied behavior analysis to a practice-oriented profession” (p. 53). Evidence for this claim comes from an analysis of the demand for behavior analysts identifying experience with autism as the most requested skill by employers (Burning Glass Technologies, 2015). In addition, results from the BACB® Job Task Analysis indicated that the primary population served by BCBA®s was individuals with autism (BACB, 2011a).
To support the demand for practitioners with autism experience, the Institute of Education Sciences and the Office of Special Education provided funding for universities to prepare future special education teachers and related service providers (e.g., speech language pathologists, occupational therapists, behavior support personnel) to work with students with autism and provide evidence-based practices, such as those derived from the principles of ABA (Institute of Education Sciences Funding Opportunities, n.d.). In order to have their graduates sit for a BCBA® examination, a requirement for becoming a certified behavior analyst, many universities sought approval for their course sequences from the BACB® (Shook & Johnston, 2011).
Despite uniform requirements that all university programs must meet for BACB® approval, a review of approved course sequences indicated many differences among university programs, including (a) departments affiliation, (b) course delivery methods, (c) additional program accreditations, (d) provision of supervision experience, and (e) ABA-related course topics (Shepley et al., 2017). These differences highlight the current heterogeneity of programs preparing BCBA®s and suggest that different programs may provide graduates with vastly different training experiences. Given these differences in preparation alongside the widespread demand for BCBA®s with experience in autism, it is imperative that programs recognize how their different training experiences affect their graduates’ abilities to provide services in positions that fall within and outside of their “boundaries of competence” (BACB, 2016, p. 4). This is a timely consideration given the federal Office of Special Education Program’s (2015) recent policy letter stressing that ABA therapists working with students with autism recognize the limitations of their technology in regards to determining special education eligibility, evaluating across domains (e.g., hearing, vision), and collaborating with school personnel. Although this letter does not serve as a formal accusation of ethical misconduct by BCBA®s, it warrants attention from the field to better understand the effects of differing preparation programs.
It should be noted that differences among programs are altogether not unintentional. The BACB® allows university programs from various departments to include required content (i.e., BACB® Task List Items) across a variety of course topics (Shook & Johnston, 2011). This flexibility promotes the study of behavior analysis as program agnostic, with behavior analysis impacting all fields in which behavior is relevant. In addition, given that the demand for BCBA®s increased by 116% from 2012 to 2014 across all industries collectively (Burning Glass Technologies, 2015), additional programs preparing BCBA®s are needed. Despite the well-intentioned flexibility allotted by the BACB®, the board has needed to respond to many concerns and misconceptions from the field regarding certification and approved course sequences (BACB, 2012). One frequent topic of discussion relates to how differences among programs affect BCBA® examination pass rates (BACB, 2011b). Questions regarding examination pass rates are of particular importance given that an individual must pass the exam to become certified; therefore, if certain types of programs are graduating few individuals that can pass the BCBA® exam, there will be fewer behavior analysts to fill the jobs for which those types of programs are training individuals. For example, data indicate that approved course sequences within special education programs are more likely to include explicit instruction on consultation than course sequences within psychology departments (Shepley et al., 2017). If individuals completing course sequences within special education programs are failing to pass the BCBA® exam, then there may be fewer individuals with an understanding of how to provide ABA services through a consultative service delivery model; a needed skill for individuals working in school-based settings. Given recent data indicating many differences between approved programs, additional insight into the relationship between programmatic variables and examination pass rates may help identify how different programs are performing with regard to producing BCBA®s. Therefore, the purpose of this review is to provide the field with an initial analysis of programmatic variables and their impact on BCBA® examination pass rates.
Method
Variables included in this review were previously coded and defined in a review of BACB® approved programs (Shepley et al., 2017). These variables included behavior analyst preparation programs, 2014 program pass rates, and variables associated with each program (i.e., provision of supervision experience, Association of Behavior Analysis International [ABAI] accreditation, departmental affiliation, course delivery methods, course topics, and number of individuals sitting for the 2014 BCBA® examination). It should be noted that ABAI accreditation has changed names since these data were gathered and is currently referred to as Behavior Analysis Accreditation Board (BAAB) accreditation. The term ABAI accreditation is used throughout this review as it corresponds to the accreditation standards at the time data were collected. We performed additional coding related to course delivery methods and departmental affiliations. Any program previously coded as offering courses through more than one delivery method was recoded into the category titled Multiple. This allowed for each course delivery category to be mutually exclusive (i.e., no program could be coded within multiple categories for that variable).
Coded departmental affiliations were categorized as General Exclusive, Specific Exclusive, and Specific Inclusive. Within General Exclusive, each program was coded as belonging exclusively to an education related, psychology related, or other department; a program could only be coded for one department type (i.e., codes were mutually exclusive). Within Specific Exclusive, each program was coded as belonging exclusively to a behavior analysis, special education, or other department; and again, each program could only be coded for one department type (i.e., codes were mutually exclusive). For Specific Inclusive, programs were coded as belonging to a special education, school psychology, educational psychology, or counseling department; and programs could be coded across multiple departments. We coded new departmental affiliations to provide more precise affiliations of programs. These departmental affiliation categories were selected based on anecdotal data from the initial coding indicating multiple programs were housed within and across these categories. The first and third author independently coded all additional variables resulting in 96.7% agreement. Disagreements were resolved between the coders.
Data Analysis
Following completion of coding and combining new data into a Microsoft Excel spreadsheet with data from the previous review, the first author input all data into SPSS version 23. Descriptive statistics were initially used to analyze all variables. Using SPSS, we output frequencies and proportions for categorical variables (e.g., provision of supervision experience, departmental affiliation), and the mean, standard deviation, median, minimum value, and maximum value for examination pass rates of programs reporting pass rate data.
To analyze the impact of programmatic variables, we modeled our results using ordinary least squares regression analyses. In contrast to t test and z tests, regression analyses allow for examination of the relationship between more than two variables. In addition, rather than only indicating if a relationship between variables is statically significant, regression provides an estimate of the impact of the relationship. Programs served as the unit of analysis with 2014 program pass rates functioning as the outcome variable. Predictor variables used to build models were (a) course delivery methods, (b) departmental affiliation, (c) ABAI accreditation, (d) provision of supervision experience, (e) inclusion of a consultation course, and (f) number of examinees sitting for a 2014 BCBA® exam. Indicator variables were selected based on our analysis of descriptive statistics. Indicator variables used in the models were (a) courses provided on-campus, (b) courses affiliated with psychology department, (c) program accredited by ABAI, (d) program provided supervised experience, and (e) program included a BACB®-approved course on consultation. It should be noted that the program pass rate data represent the population of programs with at least six individuals sitting for a 2014 BCBA® examination in the USA and that had a BACB® approved course sequence that was established for at least 4 years. We caution generalizations to programs not meeting these qualifications.
Results
Examinees and Pass Rates
Of the 187 programs included in the initial review, the BACB reported pass rates on the 2014 BCBA examinations for 76 programs, with a mean of 46 individuals per program sitting for the exam. Most programs (n = 43) reported between 6 and 19 individuals sitting for the exam with the fewest being 6 individuals and the most being 951. Regarding pass rates on the 2014 BCBA® exams, the most common pass rate for programs was between 50 and 60% with the distribution of all programs approaching normal. The lowest program pass rate was 11% and the highest was 100%.
Course Delivery Methods
The majority of programs (54%) provided courses through an On-Campus delivery method (see Table 1). The remaining 46% of programs provided courses through Distance Education, Hybrid, Multiple, or Distance/Campus methods. Programs providing courses through On-Campus methods reported the highest mean pass rate with Distance/Education programs reporting the lowest (see Table 2).
Table 1.
Number and percentage of programs by course delivery method and departmental affiliation
| Course delivery method | Number | Percentagea |
| On-campus | 101 | 54.0 |
| Distance education | 31 | 16.6 |
| Hybrid | 27 | 14.4 |
| Multiple | 17 | 9.1 |
| Distance/campus | 11 | 5.9 |
| Department | ||
| General exclusive | ||
| Education | 98 | 52.4 |
| Psychology | 66 | 35.3 |
| Other | 22 | 11.8 |
| Specific exclusive | ||
| Special education | 34 | 18.2 |
| Behavior analysis | 13 | 7.0 |
| Specific inclusive | ||
| Special education | 46 | 24.6 |
| Educational psychology | 14 | 7.5 |
| Counseling | 14 | 7.5 |
| School psychology | 8 | 4.3 |
aRefers to percentage of all programs (e.g., 14.4% of all programs offered courses through a hybrid delivery method)
Table 2.
Descriptive statistics for Board Certified Behavior Analyst examination pass rates by programmatic variable
| Variable | Mean | Std. dev. | Minimum | Median | Maximum | n a |
|---|---|---|---|---|---|---|
| Course delivery method | ||||||
| On-campus | 64.98 | 23.51 | 14 | 64 | 100 | 41 |
| Distance education | 46.11 | 15.00 | 18 | 54 | 89 | 9 |
| Hybrid | 60.71 | 12.42 | 45 | 65 | 79 | 7 |
| Multiple | 53.80 | 17.81 | 11 | 57 | 70 | 10 |
| Distance/campus | 56.56 | 22.89 | 18 | 54 | 89 | 9 |
| Departmental affiliation | ||||||
| General exclusive | ||||||
| Education | 53.70 | 21.96 | 11 | 55 | 88 | 30 |
| Psychology | 65.79 | 20.42 | 29 | 61 | 100 | 34 |
| Other | 56.50 | 22.85 | 30 | 50 | 93 | 12 |
| Specific exclusive | ||||||
| Special education | 54.33 | 23.12 | 14 | 58 | 88 | 12 |
| Behavior analysis | 67.00 | 17.27 | 48 | 62 | 100 | 9 |
| Specific inclusive | ||||||
| Special education | 54.21 | 21.31 | 14 | 56 | 88 | 14 |
| School psychology | 44.50 | 47.38 | 11 | 45 | 78 | 2 |
| Educational psychology | 45.00 | 24.65 | 11 | 47 | 78 | 5 |
| Counseling | 42.00 | 28.61 | 11 | 40 | 79 | 4 |
| ABAI accredited | ||||||
| No | 56.56 | 21.20 | 11 | 54 | 100 | 59 |
| Yes | 71.41 | 19.60 | 33 | 74 | 100 | 17 |
| Supervision experience | ||||||
| No | 59.56 | 23.24 | 13 | 57 | 100 | 32 |
| Yes | 60.11 | 20.68 | 11 | 56 | 100 | 44 |
Std. dev standard deviation
aRefers to the number of programs for each programmatic variable reporting a 2014 pass rate
Departmental Affiliation
General Exclusive
The majority of behavior analyst preparation programs were housed in education-related departments, and the fewest were housed in other departments (e.g., Child and Family Studies, Criminal Justice and Public Safety; see Table 1). Regarding pass rates, programs in psychology departments reported a higher mean pass rate than programs in Education and other departments (see Table 2).
Specific Exclusive
More programs were housed exclusively in special education departments than in behavior analysis departments (see Table 1), though behavior analysis departments reported higher mean pass rates than programs in special education departments (see Table 2).
Specific Inclusive
Most programs with inclusive departmental affiliations included an affiliation with a special education department (see Table 1). In addition, programs affiliated with special education departments reported higher mean pass rates on examinations than programs affiliated with other departments (see Table 2).
ABAI and Supervision
Programs with ABAI accreditation accounted for 10.16% (n = 19; Shepley et al., 2017) of all programs and reported a higher mean pass rate than programs that did not (see Table 2). Programs providing supervision experience represented 48.66% (n = 91; Shepley et al.) of all programs. The mean pass rate on BCBA® examinations from programs providing and not providing supervision approximated one another.
Regression Models
The first regression model examined the relationship between programs providing coursework through on-campus methods and examination pass rates at the program level. Data indicate that on average, providing courses through on-campus methods resulted in an increase of 11.06 percentage points (PP) on a program’s pass rate; this was a statistically significant estimate (p < .05). Controlling for departmental affiliation in the second model provided a more precise estimate of the effect of on-campus courses as evidenced by a decrease in the standard error of the slope estimate. In addition, the estimates provided by both variables were statically significant (p < .05). In the third model, the inclusion of a program having ABAI accreditation produced the lowest standard error of regression (SER) and the lowest standard errors for On-Campus and ABAI Accreditation variables. In models 4, 5, and 6, the standard errors of the estimates increased along with the SER, and the On-Campus slope estimate lost statistical significance in models 5 and 6. Given decreased performance in later models and more precise standard errors while retaining statistical significance (p < 0.05) for On-Campus and ABAI Accreditation estimates, we identified model 3 as the best performing and recommended model.
Using model 3, a program providing courses on-campus yielded results similar to those discussed in model 1. A program with courses affiliated with psychology departments saw an increase on program pass rates by 7.39 PP when controlling for course delivery methods and ABAI accreditation; although, this result was not statistically significant. Being accredited by ABAI on average resulted in an increase of 12.54 PP on program pass rate when controlling for course delivery methods and departmental affiliation. A program providing courses through methods other than on-campus, with approved courses unaffiliated with psychology-related departments, and lacking ABAI accreditation reported on average a program pass rate 30.85 PP lower than a program with on-campus courses, affiliated with a psychology department and accredited by ABAI.
Discussion
This review provides an initial analysis of the relationship between programmatic variables and BCBA® examination pass rates. We identified multiple notable findings. First, regarding the heterogeneity of BCBA programs, we identified multiple new affiliations between BCBA programs and departments (e.g., approved course sequences housed in counseling departments). Second, our data indicate that programs providing BACB® approved courses through on-campus methods reported a mean program pass rate nearly 20 PP higher than programs providing courses through distance education methods (see Table 2). This finding differs from previous years with BACB® reports indicating that pass rates from programs providing courses through on-campus and distance education methods approximated one another (BACB, 2011b). Third, data suggest that a program’s provision of supervision experience was not associated with significantly better outcomes on BCBA® exams. Furthermore, adding interaction terms (e.g., Supervision*On Campus) did not produce any statistically significant differential effects. This is an unexpected finding given the value placed on supervision within related fields (e.g., school psychology; Meyers, 2002). Fourth, the inclusion of a consultation course by a program was associated on average with a 5.52 PP decrease in program pass rates when controlling for other predictors in model 5. Although this negative association aligns with prior descriptive results (Shepley et al., 2017), our current findings failed to reach statistical significance within the models. It should be noted that when entered as a single predictor in a regression analysis, the inclusion of a consultation course approached statistical significance (p ≤ 0.10), potentially indicating that greater power may be needed to detect effects when combined with covariates. Fifth, the number of individuals from a program sitting for an exam resulted in nearly no effect on a program’s pass rate. In model 6 of Table 3, for each additional person sitting for an exam, the program pass rate decreased on average by 0.01 PP when controlling for the other variables. Therefore, for every 100 individuals sitting for an exam, a program could on average expect to see a decrease in their pass rate by only 1.00 PP. In addition, this variable was not a statistically significant predictor. Lastly, both On-Campus and ABAI Accreditation variables were statistically significant indicators of a program’s pass rate. Given that the On-Campus indicator was created from five different categorical variables, additional analysis is needed to determine how the effects of on-campus methods differ from other specific course delivery methods. The effects of ABAI accreditation on pass rates may be explained by the mission of the accreditation board to “recognize exemplary training of behavior scientists” (Behavior Analysis Accreditation Board, 2016, p. 4). A further examination of the accreditation requirements and their potential effects on program pass rates is warranted.
Table 3.
Regression models estimating the impact of programmatic variables on Board Certified Behavior Analyst program pass rates reported as percentages
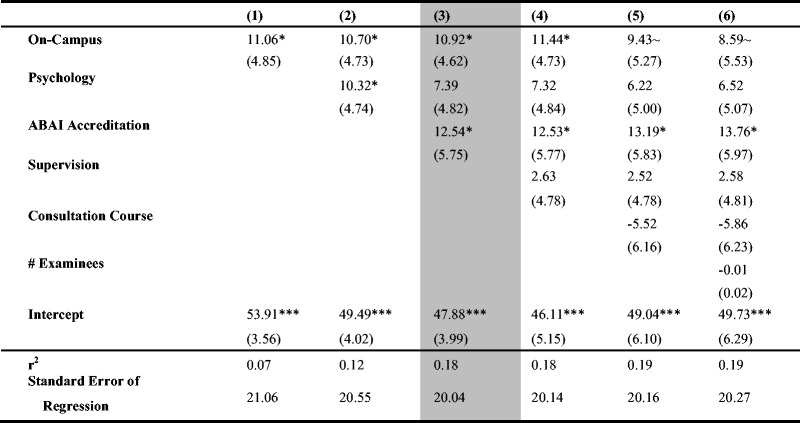
Standard errors are in parentheses. Shaded area indicates best performing model. Unit of analysis is programs. Slope estimates reflected as percentage points
~p ≤ 0.100
*p < 0.050 **p < 0.010 ***p ≤ 0.001
Although some variables did not reach statistical significance within the regression models, these data represent the population of programs reported by the BACB® in 2014. Therefore, when examining the results regarding programs reported in 2014 by the BACB, the data reflect what occurred that year.
Limitations
As previously mentioned, readers should be cautious given that program pass rates were limited to 1 year of data, 2014 examinations as reported by the BACB®. In addition, readers should not overgeneralize our results and use these data to attempt to answer questions such as what type of programs are better? or what types of programs produce better behavior analysts? As stressed in a past review, programs should be evaluated per their purpose (i.e., according to the jobs for which programs are preparing future behavior analysts; Shepley et al., 2017). Furthermore, the data in this review do not allow for an examination of causal relations between the predictor and outcome variables; rather, these data provide information on associations between these variables. Different types of analytical methods (e.g., difference-in-difference estimate, instrumental variables) are needed to estimate the causal impact of the variables. Lastly, the limitations of the data collection methods reported in the previous review on which the current results were based, are still present and should be considered when interpreting these findings (Shepley et al.).
Conclusions
This review highlights initial programmatic variables associated and not associated with BCBA® program examination pass rates. As the field adds new programs, affiliated with new departments, and providing courses on differing topics through varying methods, we encourage the field to further this line of research to better understand how certain programs can more effectively prepare BCBA®s. In addition, as programs prepare BCBA®s for specific jobs, the necessity for graduates to pass the BCBA examination is exacerbated. Otherwise, the field risks further issues related to BCBA®s providing services outside of their abilities (Office of Special Education and Rehabilitative Services, 2015). We offer our coded data in Excel and SPSS format to support this endeavor (contact the first author) and pose future research questions to the field: (a) How does the amount of time between graduation and sitting for an exam affect pass rates? (b) What are the differential effects of synchronous versus asynchronous distance education courses? (c) What are the effects of different types of course instructors, such as adjunct lecturers and graduate assistants? (d) How do our data and findings compare across years? (e) How do the associations between variables in the review impact pass rates for newer programs and programs with fewer than six individuals sitting for an exam? (f) How satisfied are consumers of behavior analysis services with regard to the services provided by BCBA®s from different educational backgrounds?
Acknowledgements
We would like to thank Danielle Crawford, Rachel Pence, Madison Johnson, Olivia Winstead, and Charity Watson for their assistance with coding.
Compliance with Ethical Standards
Funding Source
No funding was secured for this study.
Financial Disclosure
We have no financial conflicts to disclose.
Conflict of Interest
The authors declare that they have no conflict of interest.
Ethical Approval
This study does not contain any studies with human participants performed by any of the authors.
Contributor Information
Collin Shepley, Email: collinshepley@uky.edu.
R. Allan Allday, Email: allan.allday@uky.edu
Sally B. Shepley, Email: sally.shepley@uky.edu
References
- About the BACB (n.d.). Retrieved July 18, 2016, from bacb.com/about-the-bacb/.
- Behavior Analysis Certification Board (2011a). A special thank you to our dedicated certificants and subject matter experts. BACB Newsletter. Retrieved from http://bacb.com/wp-content/uploads/2015/07/BACB_Newsletter_05_2011.pdf011.
- Behavior Analysis Certification Board (2011b). How do distance education programs measure up? A comparison of distance and on-campus course sequences. BACB Newsletter. Retrieved from http://bacb.com/wp-content/uploads/2015/07/BACB_Newsletter_9-9-11.pdf.
- Behavior Analysis Certification Board (2012). Setting the record straight: 6 common misconceptions about the BACB. BACB Newsletter. Retrieved from http://bacb.com/wp-content/uploads/2015/07/BACB_Newsletter_1_12.pdf.
- Behavior Analysis Certification Board (2013). BACB certificants now exceed 13,000 worldwide! BACB Newsletter. Retrieved from http://www.bacb.com/newsletter/BACB_Newsletter_5-13.pdf.
- Behavior Analyst Certification Board (2016). Responsible conduct of behavior analysts. Professional and Ethical Compliance Code for Behavior Analysts. Retrieved from http://bacb.com/wp-content/uploads/2016/03/160321-compliance-code-english.pdf.
- Burning Glass Technologies (2015). US Behavior Analyst Workforce: Understanding the National Demand for Behavior Analysts. Retrieved from http://www.oit.edu/docs/default-source/humanities-social-sciences-documents/behavior-analyst-workforce-demand.pdf?sfvrsn=0.
- Dorsey MF, Weinberg M, Zane T, Guidi MM. The case for licensure of applied behavior analysts. Behavior Analysis in Practice. 2009;2:53–58. doi: 10.1007/BF03391738. [DOI] [PMC free article] [PubMed] [Google Scholar]
- Institute of Education Sciences Funding Opportunities (n.d.). Retrieved July 18, 2016, from http://ies.ed.gov/funding/.
- Meyers J. A 30 year perspective on best practices for consultation training. Journal of Educational and Psychological Consultation. 2002;13:35–54. doi: 10.1080/10474412.2002.9669452. [DOI] [Google Scholar]
- Shepley, C., Allday, R. A., Crawford, D., Pence, R., Johnson, M., & Winstead, O. (2017). Examining the emphasis on consultation in behavior analyst preparation programs. Behavior Analysis: Research and Practice. doi:10.1037/bar0000064Advance online publication.
- Shook GL, Johnston JM. Training in professional certification in applied behavior analysis. In: Fisher W, Pizaa C, Roane H, editors. Handbook of applied behavior analysis. New York: Guilford; 2011. pp. 498–510. [Google Scholar]
- United States Department of Education Office of Special Education and Rehabilitative Services (2015). OSEP Dear Colleague Letter on Speech Language Services for Students with Autism Spectrum Disorder. Retrieved from http://www2.ed.gov/policy/speced/guid/idea/memosdcltrs/dclspeechlanguageautism0706153q2015.pdf.