

Abstract
The MS2-MCP system allows imaging multiple steps of the mRNA life cycle with high temporal and spatial resolution. However for short-lived mRNAs, the tight binding of the MS2 coat protein (MCP) to the MS2 binding sites (MBS) protects the RNA from being efficiently degraded, confounding the study of mRNA regulation. Here, we describe a reporter system (MBSV6) with reduced affinity for the MCP, allowing mRNA degradation while preserving single molecule detection determined by smFISH or live imaging. Constitutive mRNAs (MDN1 and DOA1) or highly-regulated mRNAs (GAL1 and ASH1) endogenously tagged with MBSV6 in S. cerevisiae degrade normally. As a result, rapidly turning over mRNAs were imaged throughout their complete life cycle. MBSV6 provided single molecule detection in live mammalian cells. The MBSV6 reporter revealed that coordinated recruitment of mRNAs at specialized structures such as P-bodies during stress did not occur and that degradation was heterogeneously distributed in the cytoplasm.
Keywords: MS2-MCP system, single mRNA detection, single molecule FISH, mRNA decay, mRNA localization, RNA granules
Introduction
Imaging single molecules in intact cells reveals the process of gene expression from transcription to translation with high temporal and spatial resolution1. The method to visualize single mRNAs in living cells utilizes RNA loops derived from the bacteriophage MS2 co-expressed with its coat protein (MCP)2. For mRNA detection, 24 MBS are inserted in the 3′UTR of an mRNA of interest and co-expression of MCP fused with fluorescent proteins renders single mRNAs visible using wide-field epi-fluorescence microscopy. This approach has been used in living eukaryotic cells to image single mRNAs from transcription to translation3–10.
Recent work revealed that MCP binding to MBS impaired mRNA degradation in S. cerevisiae leading to 3′ decay fragments containing MS2 arrays11–14. Because the MS2 system has been used to study various aspects of cytoplasmic mRNA regulation15–17, the uncertainty as to whether the MBS signal represented full-length mRNAs raised the concern that the current MS2-MCP system could yield spurious results. To address this problem, the MS2 system was re-engineered so that it mimicked the expression of the endogenous mRNA. The new system can be used to visualize highly regulated mRNA in S. cerevisiae, where mRNAs have short half-lives, as well as mRNA in mammalian cells.
Results
Characterization of the expression of mRNAs tagged with the MS2-MCP system
The degradation of mRNAs tagged with the MS2-MCP system was characterized using biochemical methods (e.g. northern blot, qPCR)11,13,14, which did not provide information on the number of cells affected or the amount of degradation in each cell. We used a single-cell approach12 to measure whether MS2-MCP tagged mRNAs accumulated 3′ decay fragments in S. cerevisiae. Two genes were analyzed: ASH1, a cell cycle regulated mRNA with a rapid turnover, that localizes to the bud tip during anaphase3,18, and MDN1, a consitutively expressed mRNA19,20. Both were endogenously tagged with 24xMBS in the 3′UTR. The latest MBS versions, MBSV5, containing non-repetitive stem loops arrays21, was used for ASH1 (Fig. 1a) and MBSORF, with repetitive stem loops without stop codons20, was used for MDN1 (Fig. 1b). ASH1 mRNAs endogenously tagged with 24xMBSV5 properly localized to the bud tip during mitosis (Fig. 1c). Cells expressed the coat protein fused to two GFP molecules from the constitutive Cytochrome C1 promoter (CYC1p), for homogenous expression among cells.
Figure 1. Current MBS systems resist degradation in yeast.

(a, b) Scheme of ASH1 and MDN1 loci tagged currently used MBS. (a) 24xMBSV5 inserted in the 3′UTR of endogenous ASH1 gene. Purple boxes = localization sequences of ASH1 mRNA. (b) 24xMBSORF inserted in the 3`UTR of the endogenous MDN1 gene. (a, b) Dotted lines designate smFISH probe positions recognizing the CDS (green) or MBS sequences (red).
(c, d) Two color smFISH for (c) ASH1 mRNA tagged with 24xMBSV5 and (d) MDN1 mRNA tagged with 24xMBSORF, in cells expressing MCP (YcpLac111 CYC1p-MCP-NLS-2xyeGFP) or the vector alone (YcpLac111). (c) DIC/MERGE shows the overlap of the DAPI signal in the nucleus (blue), smFISH for the ASH1 CDS (green) and the MBS (red) with the differential interference contrast (DIC) image. (d) MERGE shows the overlap of the DAPI (blue), smFISH for the MDN1 CDS (green) and the MBS (red). Yellow lines define the shape of a single cell (the bud position is indicated for the ASH1 expressing cells). For each cell is indicated the stage of the cell cycle (G1, S, G2 and M phase). White arrows =single mRNAs, green arrows = transcription sites, yellow arrows = MBS aggregates. Scale bar = 5μm.
(e,f) Quantification of smFISH represented in 1c and 1d with CDS probes (green plots) or MBS probes (red plots) reported as frequency distribution of mature (e) ASH1 and (f) MDN1 mRNAs per cell. Mean and SD of two independent cell cultures, n = ~500 cells per experiment, distribution of the mRNAs was generated using the same binning.
(g) MBS aggregates in the cytoplasm are detected as bright fluorescent spots by smFISH. The percentage indicates cells positive for MBS aggregates. Yellow arrows = MBS aggregates. Scale bar = 5μm.
(h) MBS aggregates are detected in the cytoplasm of living cells co-expressing MCP. (White arrows = single ASH1 (left) and MDN1 (right) mRNAs. Yellow arrows = MBS aggregates. Scale bar = 5μm.
To determine whether each mRNA molecule was intact, the mRNA was probed by two color smFISH to identify the coding sequence, CDS (ASH1 or MDN1) and the MBS sequence (MBSV5 or MBSORF) (Fig. 1a–d). Quantification of ASH1 mRNAs with FISH-quant22 using CDS probes showed comparable expression levels whether the mRNA was MS2-tagged, with or without MCP (Fig. 1e and Supplementary Figure 1a). Cells expressing MCP revealed an increased number of MBS molecules without corresponding signal for ASH1 CDS (3′ decay fragments, Fig. 1c and 1e). The number of MBS fragments varied among cells (2.3 times higher than the full length ASH1 mRNA), thereby providing an erroneous frequency distribution (Fig. 1e), similar to MDN1 mRNAs tagged with 24xMBSORF (Fig. 1d and 1f). The expression of endogenous MDN1 was constitutive (a Gaussian distribution that ranges from 0 to ~15 mRNAs per cell)19; Supplementary Figure 1b). The number of MBS spots doubled in the presence of the MCP relative to the mRNAs quantified with the CDS probes (Fig. 1f). In about 20% of both ASH1 and MDN1 tagged yeast strains expressing MCP, bright aggregates were seen. These aggregates, containing only the MBS sequence, resulted from the accumulation of single MBS fragments bound by MCP and were present even when reducing the number of MBSV5 stem loops to twelve (Fig. 1g and Supplementary Figure 1c–d and Supplementary Note 1).
Live imaging was consistent with the smFISH results. Strains expressing MCP with tagged ASH1 or MDN1 revealed that 20% of the cells contained 1 to 2 MBS aggregates/cell that were less mobile and brighter than single molecules (Fig. 1h, Supplementary Table 1). These aggregates were absent in cells expressing MCP alone, indicating that the formation of aggregates required both MBS and MCP (Supplementary Figure 1e). The binding of the MCP to the MBS allowed proper expression and localization of ASH1 mRNA at the bud tip but delayed degradation of the MBS, which accumulated as aggregates (Supplementary Figure 1f and Supplementary Note 2 regarding previous ASH1 publications3). MBS fragments accumulation was accentuated for highly regulated and short-lived mRNAs, like ASH1, more than constitutively expressed and stable mRNAs like MDN1, since fewer molecules at any one time are degrading. Hence, the use of the available MS2-MCP systems in living yeast can lead to incorrect conclusions about mRNA expression and localization. Consequently, mRNA tagging must be validated by two color smFISH or by other approaches.
Design of a degradable MS2-MCP system faithfully recapitulating mRNA kinetics
The original work on the wild type bacteriophage MS2 identified a uridine at position -5 (U-variant) of the loop (Supplementary Figure 2a) that when substituted by a cytosine (C-variant) increased the affinity of the MCP tenfold (Kd from 10nM to 1nM) and decreased the dissociation kinetics about 90 fold23,24. We reproduced these results with the MCP used for imaging by electrophoretic mobility shift assay (EMSA) (Supplementary Figures 2d–f). Because the higher affinity of the C-variant would retain the tag on the mRNA longer, it was used originally to image single mRNA molecules in living eukaryotic cells3,4. Because the current MBSV5 and MBSORF versions contain the C-variant20,21 (Supplementary Figures 2b–c), we posited that the lower affinity U-variant would facilitate degradation.
Since the MBS-MCP complex inhibited degradation of the stem loops, we tested the effect of both the stems and the loops independently by EMSA. The current MS2 arrays contain synonymized loop sequences to avoid recombination. We tested whether changing the stem sequence affected the affinity for MCP. We compared two different stems of 7 bp (Stem1 and Stem2) each with a U or C-variant in the loop (Fig. 2a). Apparent equilibrium dissociation constants (Kd) were extracted from plots of MCP bound versus free (Fig. 2b–c and Supplementary Figures 2g–h). For Stem1 and Stem2, the C to U mutation was sufficient to reduce ten times the affinity of the MCP for the MBS independently of the stem sequence (Fig. 2b–c). Two other strategies were attempted to increase the degradation of the MBS-MCP arrays in living cells. The lengths of the linkers were increased from 30 nt to 50 (MBSV6) or 40 nt (MBSV7), possibly allowing better access of nucleases to the mRNA, and the stem-loops were reduced to 12 from 24, providing less substrate for degradation (Supplementary Figure 3a–c and Material and Methods).
Figure 2. Design and characterization of a new MS2-MCP system.
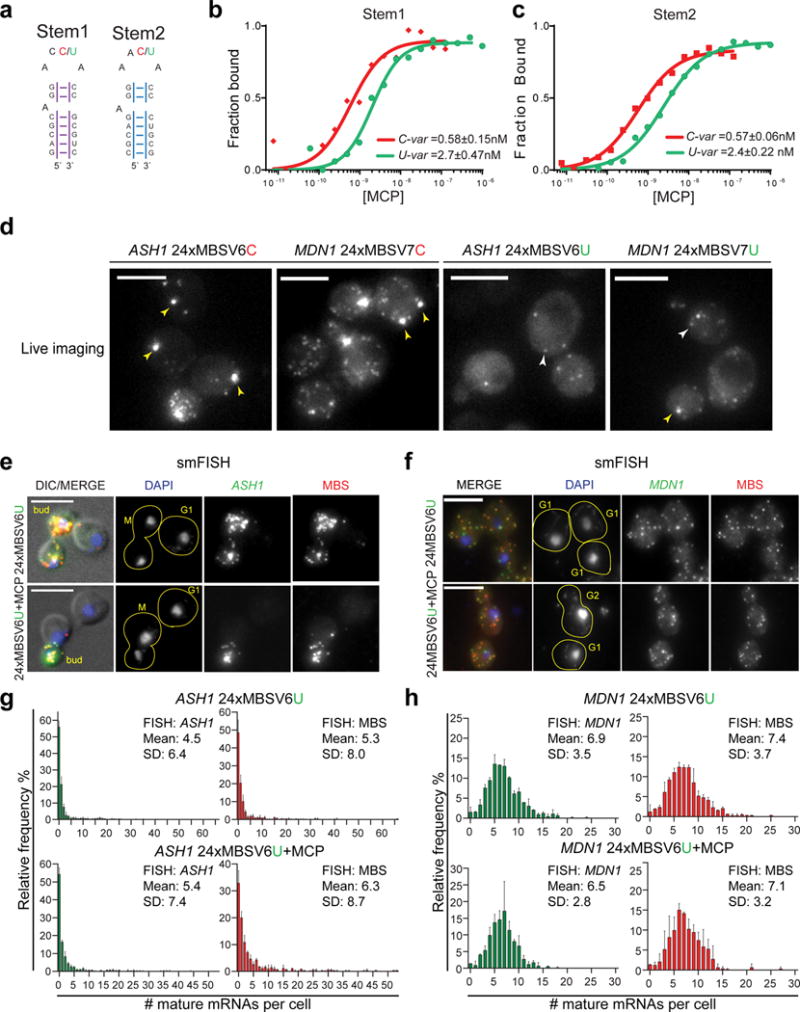
(a) RNA stem loop sequences used for EMSA assays. Stem1 and Stem2 have randomized stem sequence of 7 nts. The two loops were synthetized either as an U-variant or C-variant at position −5. The affinity of MCP for the two stem loops was tested by EMSA.
(b, c) Binding affinity of MCP for the MBS C-variants and U-variants. The Kd from three independent measurements (Figure Supplementary 2f-g) is indicated on the plots for (b) Stem1 and (c) the Stem2, either U or C-variant.
(d) Image of living cells co-expressing MCP. (Left) ASH1 24xMBSV6 C-variant or MDN1 24xMBSV7 C-variant. (Right) ASH1 24xMBSV6 U-variant or MDN1 24xMBSV7 U-variant. Yellow arrows = MBS aggregates. White arrows = single mRNAs. Scale bar = 5μm.
(e, f) Two color smFISH for (e) ASH1 mRNAs and (f) MDN1 mRNAs tagged with 24xMBSV6, in cells expressing MCP or the vector alone. (e) DIC/MERGE shows the overlap of the DAPI (blue), smFISH for the ASH1 CDS (green) and the MBSV6 (red) with the DIC image. (f) MERGE shows the overlap of the DAPI signal (blue), smFISH for the MDN1 CDS (green) and the MBSV6 (red). Yellow lines define the shape of a single cell. For each cell is indicated the cell cycle stage. Scale bar = 5μm.
(g, h) Quantification of smFISH represented in 2e and 2f with CDS probes (green plots) or MBS probes (red plots) reported as frequency distribution of mature (g) ASH1 and (h) MDN1 mRNAs per cell. Mean and SD of independent cell cultures, n =~500 cells per experiment.
Live imaging of cells expressing MCP with C-variants of either ASH1 24xMBSV6 or MDN1 24xMBSV7 revealed MBS aggregates in the cytoplasm (Fig. 2d, left). Hence, increasing the length of the linkers did not prevent the formation of large MBS aggregates. In contrast, these large MBS aggregates, as defined by a spectral overlap (“bleed through”) criterion, were not observed in cells with the lower affinity U-variants (Fig. 2d, right). Importantly, single mRNA molecules could be detected in vivo. However, since the detection during live imaging is only by the MBS-MCP it was not clear that the full mRNAs were observed.
smFISH of endogenous mRNAs tagged with U-variants MBSV6 and MBSV7
To determine whether the tagged mRNAs were full length or if they accumulated as MBS fragments, U-variants of MBSV6 or MBSV7 were tested by two-color smFISH. Characterization of the expression of mRNAs tagged with MBSV7 still showed cells with fragments and small MBS aggregates (Supplementary Figure 3d–e and Supplementary Note 3). In contrast, tagging with 24xMBSV6, avoid the formation of MBS-MCP aggregates and had few fragments. Moreover, the distributions and the mean of mRNAs, whether using probes to the CDS or MBS were similar (Fig. 2e–h), as revealed by the correlation analysis (Supplementary Figures 3f–g). Reducing the number of stem loops from 24 to 12 further improved the degradation of MBSV6 (Supplementary Figures 4a–b). Quantification with either MBS or CDS probes in cells expressing MCP gave the same results (non-parametric T test, Mann Whitney test) (Supplementary Figures 4c–e).
To confirm that mRNAs tagged with the new MSB-MCP systems were full length, northern blot analysis was performed using a probe hybridizing to the ASH1 mRNA after the site of MBS integration (Supplementary Figure 5a–b). Consistent with previous observations11,13,14, ASH1 mRNAs tagged with C-variant 24xMBSV5 and co-expressed with MCP showed the accumulation of MBS fragments (Supplementary Figures 5a–b). In contrast, ASH1 mRNAs tagged with U-variants MBSV7 and MBSV6, either 24 or 12 MBS showed reduced accumulation of MBS fragments, consistent with that observed by smFISH. The MBSV6 gave fewer decay products as compared to the MBSV5 version for the highly expressed GAL1 gene as well, indicating that the MBSV6 version greatly reduced mRNA decay fragments with diverse mRNAs (Supplementary Figure 5c). Therefore, tagging of ASH1, MDN1 or GAL1 genes with the MBSV6 system recapitulated the endogenous pattern of expression and the expected cellular localization of the full-length mRNA, even when bound by MCP.
MBSV6 reports rapid changes in mRNA degradation
The rapid kinetics of GAL1 mRNA provided a means to determine whether MBSV6 degrades simultaneously with the CDS and accurately reports on mRNA decay. GAL1 responds to rapid changes in carbon source25. Shifting cells from glucose to raffinose generates a pre-induced state, leading to a rapid induction of GAL1 upon galactose addition. Conversely, washing out galactose and adding glucose inhibits GAL1 transcription and induces GAL1 mRNA decay26, allowing comparison of GAL1 CDS half-life (t1/2) with MBS t1/2 when protected or not by MCP (Fig. 3a).
Figure 3. 12xMBSV6 faithfully reports the rapid degradation of GAL1 mRNA.
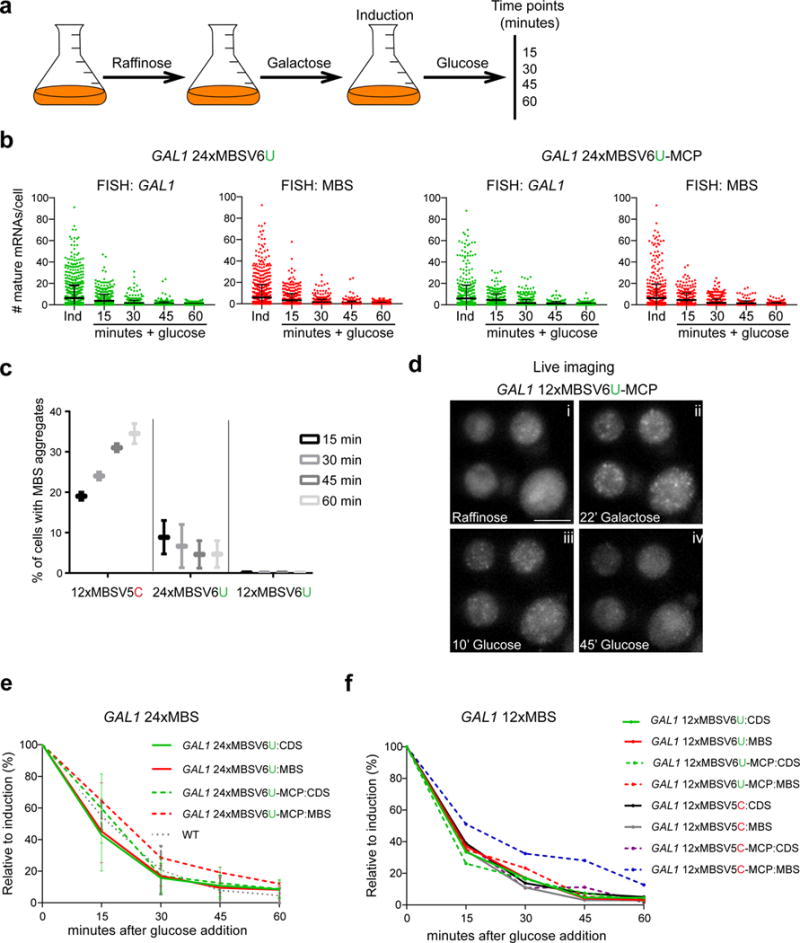
(a) Scheme of protocol used to control GAL1 mRNA expression.
(b) Quantification of smFISH for GAL1 24xMBSV6 mRNAs in cells expressing left: vector alone or right: MCP. Each dot represents the quantification obtained from a single cell with probes binding the CDS (green) or the MBSV6 (red). Error bars indicate the Mean and SD from three independent cell cultures.
(c) Percentage of cells with MBS aggregates derived from the degradation of GAL1 mRNA tagged with the current and new MBS systems at different times after glucose addition. Mean and SD from two independent cell cultures. MBS aggregates were not detected for cells co-expressing GAL1 12xMBSV6 and MCP.
(d) Representative images of Supplementary Video1 of GAL1 12xMBSV6-MCP. Time indicates the minutes cells were shifted from raffinose (i) to galactose (ii) and then to glucose (iii, iv).
(e) Plots of GAL1 mRNA decay obtained from the quantification described in 2b. The mean number of mRNAs at each time point was normalized to the induced condition (100%) and reported as a percentage. WT indicates the quantifications of smFISH performed with GAL1 CDS probes on an untagged (wt) strain. Non significantly differences between the half-life measured with the CDS or MBS probes (paired t test, P values are reported in Supplementary Table 2). Mean and SD are calculated from three independent cultures.
(f) Plots of GAL1 mRNA decay tagged with 12xMBSV5 or V6. The mean number of mRNAs at each time point was normalized to the induced condition (100%) and reported as a percentage. The plots represent one experiment out of two independent cell cultures.
The degradation of MBSV6-MCP compared to MBSV5-MCP was analyzed by two color smFISH in yeast strains expressing the GAL1 mRNA tagged with 12x or 24xMBSV6 compared to 12xMBSV5, with and without MCP (Supplementary Figure 6a). Cells growing in raffinose did not express GAL1 mRNA (Supplementary Figure 6a, Ctrl). Addition of 0.2% galactose for 30 minutes triggered an induction of GAL1 mRNA expression (Fig. 3b and Supplementary Figures 6b–c). After switching to glucose, the number of single molecules detected by probes to CDS or MBS declined over time in the presence or absence of MCP, reaching undetectable levels after sixty minutes (Fig. 3b and Supplementary Figures 6a–c). Cells expressing 12xMBSV5-MCP increased the formation of large MBS aggregates over time after glucose supplementation (Fig. 3c and Supplementary Figure 6d). However, less than 10% of cells tagged with 24xMBSV6-MCP showed smaller MBS aggregates (Fig. 3c, Supplementary Figure 6a and Supplementary Video1). The number of MBS molecules per aggregate and the percentage of cells with aggregates, decreased over time for the GAL1 tagged with 24xMBSV6 strain (Fig. 3c and Supplementary Figure 6e). MBS aggregates were not observed in the 12xMBSV6 (Fig. 3c). The decay of GAL1 12xMBSV6–MCP induced by glucose was observed over the course of an hour by live imaging (Fig. 3d and Supplementary Video 1).
Tagging of GAL1 with 24xMBSV6 shortened its half-life to t1/2= 11 minutes, possibly due to a change in 3′UTR length or sequence (Fig. 3e, Supplementary Table 2 and Supplementary Note 4). Notably, the curves obtained for the CDS and the MBS probes were practically identical (Fig. 3e). Furthermore, in presence of MCP, the t1/2 obtained with the MBS probes (Fig. 3e), although slightly longer, was not significantly different (paired t test) than the one obtained with the CDS probes or the endogenous GAL1 (Fig. 3e and Supplementary Table 2). In cells expressing GAL1 12xMBSV6-MCP, the CDS and the MBS sequence were degraded simultaneously, in contrast to 12xMBSV5 (Fig. 3f and Supplementary Table 2). Therefore, in the case of highly inducible genes where the mRNAs were degraded in a short period of time, reducing the number of MBSV6 repeats from 24 to 12 prevented the formation of MBS aggregates and enabled precise measurement of their abundance and degradation rate.
Characterization by live imaging of mRNAs tagged with MBSV6
Since MBSV6 was an accurate reporter of mRNA decay by smFISH, we tested whether it could be reliably used in living cells. The brightness of constitutively expressed single MDN1 mRNAs tagged with 24xMBSORF or 24xMBSV6 MCP-systems was compared. Mixed cultures were differentiated by the expression of the nuclear pore protein Nup49 tagged with tdTomato only in the strain expressing MBSV6 (Fig. 4a–b). The average intensity of single MDN1 mRNAs was determined for each strain and significant differences were not found (P = 0.675; Fig. 4c). The cytoplasmic MBS aggregates in the 24xMBSORF-MCP expressing cells were excluded from the analysis because they crossed into the red channel (Fig. 4b, yellow arrows). The average number of mRNAs counted in cells expressing MDN1-24MBSV6 or MDN1-24MBSORF closely resembled those obtained by smFISH (Fig. 4d compared to Fig. 1f and 2h). Thus, the detection of single molecules was not affected by the reduction of affinity of MCP for the MBSV6 U-variant. MBSV6 was also used to visualize single mRNAs in mammalian cells, as with the previously characterized MBSV5 system6,21, without significant loss of brightness (Supplementary Figure 7a–b and Supplementary Note 5).
Figure 4. MBSV6-MCP maintains single mRNA resolution in living cells.
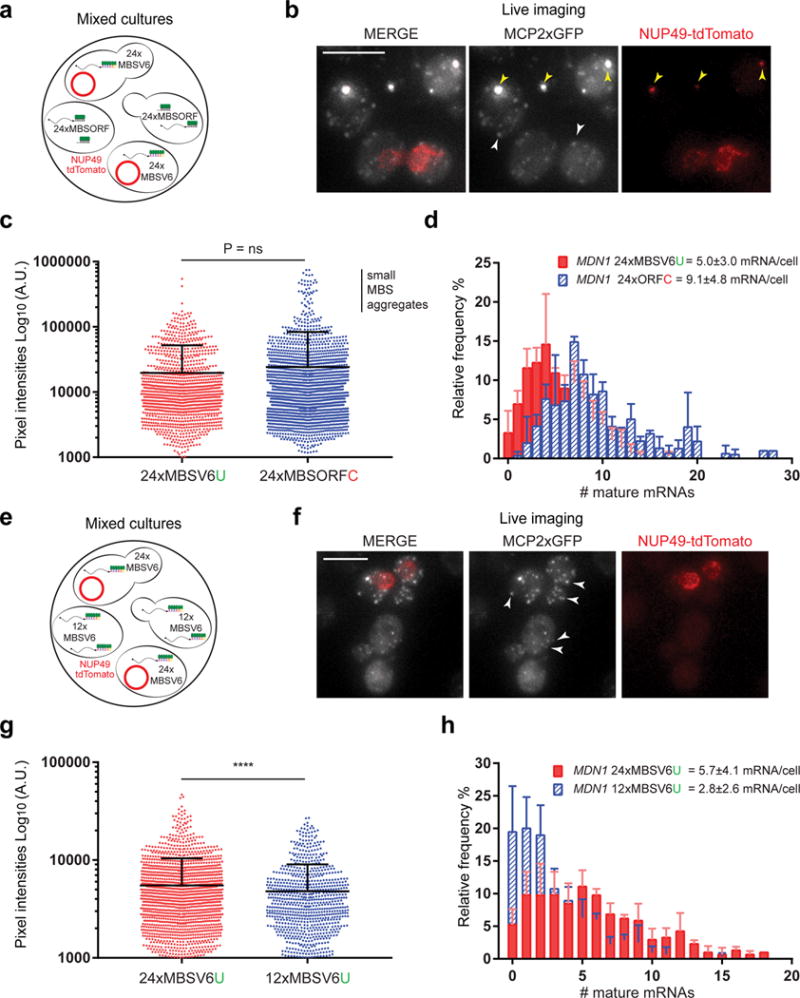
(a) Scheme of the mixed cultures used to compare the intensity of single MDN1 mRNAs tagged with either 24xMBSV6 or 24xMBSORF. Cells expressing 24xMBSV6-MCP co-express Nup49-tdTomato marking the nuclear envelope (red circle).
(b) Two color live imaging of the mixed cultures. MERGE shows the mRNA signal (gray) and Nup49tdTomato (red). Yellow arrows = MBS aggregates containing GFP that “bleed through” the red channel. White arrows = single mRNAs.
(c) Plot of the intensities of single MDN1 mRNAs tagged with either 24xMBSV6 (n= 1246) or 24xMBSORF (n=2271). Note higher intensities of small aggregates, cells with large aggregates visible in the red channel were excluded. Mean and SD of three independent cultures, n = ~100 cells per experiment. Non-parametric Mann-Whitney test does not show significant difference in brightness between 24xMBSV6 or 24xMBSORF populations, P= 0.6753.
(d) Frequency distribution of MDN1 mRNAs per cell tagged with either 24xMBSV6 or 24xMBSORF. Single mRNA molecules counted from sample in 4b. Mean and SD of three independent cultures, n= ~100 cells per experiment.
(e) Scheme of the mixed cultures to compare the intensity of single MDN1 mRNAs tagged with either 24xMBSV6 or 12xMBSV6. Cells expressing 24xMBSV6-MCP co-express Nup49-tdTomato marking the nuclear envelope (red circle).
(f) Two color live imaging of the mixed cultures. MERGE shows the mRNA signal (gray) and Nup49tdTomato (red). White arrows = single mRNAs.
(g) Plot of the intensities of single MDN1 mRNAs tagged with either 24xMBSV6 (n= 1684) or 12xMBSV6 (n=861). Mean and SD of three independent cultures, n = ~100 cells per experiment. Non-parametric Mann-Whitney test shows significant difference in brightness between 24xMBSV6 or 12xMBSV6 populations, P <0.0001.
(h) Frequency distribution of MDN1 mRNAs per cell tagged with either 24xMBSV6 (red) or 12MBSV6 (blue). Single mRNA molecules counted from sample in 4f. Mean and SD of three independent cultures, n= ~100 cells per experiment.
To define the optimal number of loops required to detect single mRNAs, we compared the brightness of MDN1 mRNAs tagged either with 12× or 24× MBSV6 under the same imaging conditions (Figures 4e–g and Supplementary Notes). Mixed cultures, differentiated by Nup49-tdTomato in the strain expressing 24xMBSV6, showed that MDN1 mRNAs tagged with 12xMBSV6 were on average 15% dimmer than the ones tagged with 24xMBSV6 (Fig.4e–g; Non-parametric Mann-Whitney test P<0.0001). A similar loss of intensity from the MBS signal was quantified by smFISH (Supplementary Figure 7c). However, the decrease in brightness of MDN1 12xMBSV6 compared to 24xMBSV6 reduced the number of detected single molecules by 50%, while no reduction was observed by smFISH (Fig. 4h and Supplementary Figure 7d). In the case of MDN1, the 12xMBSV6-MCP system detected 65 to 75% of the mRNA molecules that were detected by smFISH. These results emphasized the use of 24xMBSV6 to follow individual mRNAs in living cells.
mRNA localization during stress induced by glucose starvation
The MS2-MCP system has been used to co-localize mRNAs with Processing Bodies (PBs), stress granules or peroxisomes during stress conditions15,16,27,28. However, a recent report suggested that only the MBS fragments, but not the CDS of the tagged mRNA, co-localize with PBs12. To ensure that the MBSV6 system faithfully reported mRNA localization during stress, we used live imaging to visualize ASH1 or MDN1 mRNAs and PBs markers during glucose starvation. We monitored PB formation by co-expressing the de-capping co-factor Edc3 fused to mCherry29,30 in cells where ASH1 or MDN1 were tagged with either the previous 24xMS2-MCP systems or 24xMBSV6-MCP. Cells expressing ASH1 or MDN1 tagged with the previous systems showed cytoplasmic MBS aggregates even before glucose deprivation in both channels and substantial “bleed-through” that could affect interpretation of co-localization with a second labeled component (Fig. 5a–b, yellow arrows; Supplementary Figures 8c–d, Supplementary Videos 2 and 3 and Supplementary Note 6). In contrast, cells expressing ASH1 and MDN1 mRNAs tagged with 24xMBSV6-MCP did not form MCP aggregates during glucose starvation and surprisingly did not recruit single ASH1 and MDN1 mRNAs, not required for the stress response, to PBs (Fig. 5c and 5d, and Supplementary Videos 2 and 3). smFISH was used to confirm the integrity of the ASH1 and MDN1 mRNAs and the induction of the stress response (HSP104) (Supplementary Figure 8a–b and Supplementary Note 6). These results validated the use of the MBSV6-MCP system for analyzing mRNA localization and decay during stress conditions.
Figure 5. MBSV6-MCP enables single mRNA imaging under stress conditions.
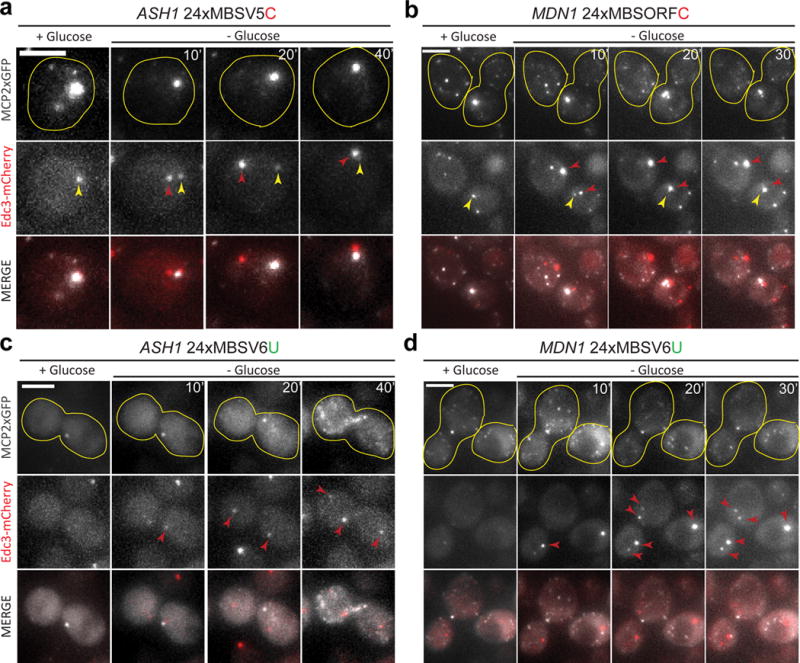
(a–d) Live imaging of mRNAs tagged with 24xMBS-MCP in cells expressing the PB marker Edc3-mCherry. (a, c) ASH1 mRNAs tagged with either 24xMBSV5-MCP or 24xMBSV6-MCP. (b, d) MDN1 mRNAs tagged with either 24xMBSORF-MCP or 24xMBSV6-MCP. MERGE indicates the overlap between the mRNA signal (gray) and Edc3-mCherry signal (red). Yellow lines define the shape of a single cell. Yellow arrows = “bleed through” from MBS aggregates. Red arrows = PBs. Representative images from Supplementary Videos 2 and 3. Time after glucose starvation (left to right, intervals in min). Scale bar = 3μm.
ASH1 mRNA cell cycle expression
Cell cycle regulated genes require precise control of their synthesis and degradation31. In yeast, ASH1 mRNA expression is temporally restricted to anaphase and the mRNA localizes to the bud tip where it is locally translated to control mating type switching18,32,33. To quantify ASH1 mRNAs during the cell cycle, ASH1 was tagged with 24xMBSV6 and cell cycle progression was monitored with the TUB1 gene tagged with mRuby (Fig. 6a). The microtubules extend from the spindle pole body between the mother and daughter cell, participating in chromosome separation and mitosis34 (Fig. 6a). ASH1 mRNA expression was preceded by microtubule stretching, allowing the clear identification of mother-daughter pairs and cell cycle phase (Fig. 6a and 6b). The number of single ASH1 mRNAs for each time point was counted (a representative cell is shown and quantified in Fig. 6b and Supplementary Figure 9a and Supplementary Video 4). The quantification of 21 cells showed that ASH1 mRNA was expressed during 30 minutes corresponding to anaphase (Fig. 6c). We measured a t1/2 (5.6–6.1 min), consistent with recent reports that the full cycle of ASH1 mRNA lasted about 30 min and the mean t1/2 was 6.3±1 min (Fig. 6c and Supplementary Figure 9a)35. We observed bursts of transcription in the mother followed by localization of mRNAs to the bud tip; surprisingly before the end of mitosis a second burst of accumulation occurred in the bud tip from transcription in the daughter (Fig. S9b and Supplementary Video 5 and Supplementary Note 7). The ASH1 mRNAs in the daughter cell stayed for a prolonged period before degradation.
Figure 6. MBSV6-MCP quantitatively reports ASH1 mRNA levels throughout the cell cycle.
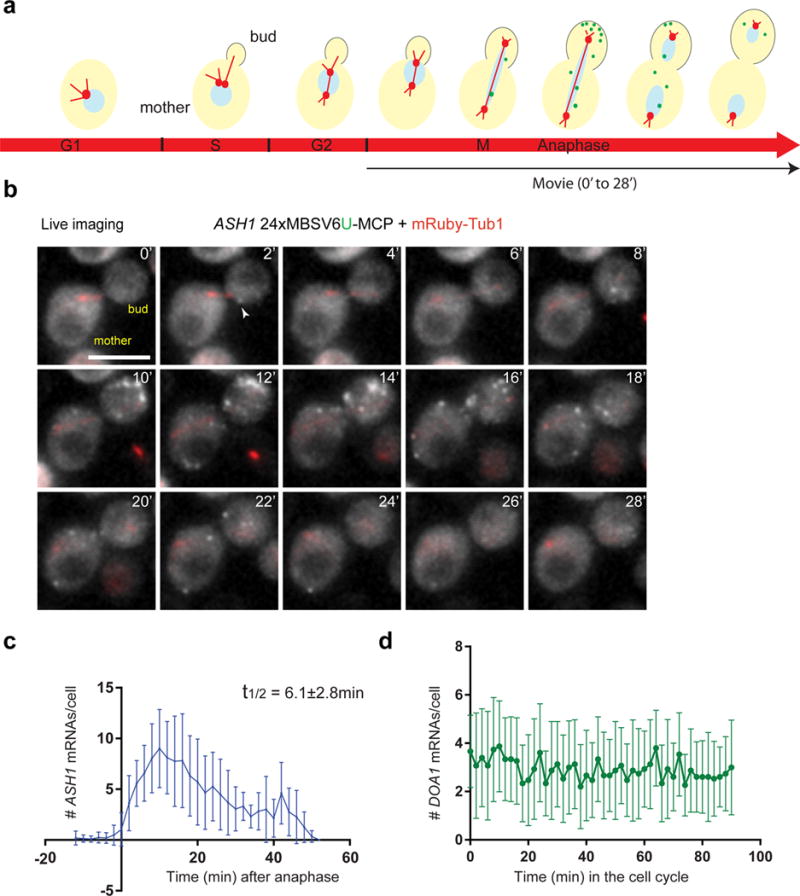
(a) Scheme of ASH1 mRNA expression during the cell cycle (marked on red arrow). Green dots represent ASH1 mRNA. mRubyTub1 (red) marks the spindle pole body, duplicated during S phase. The bud emergence (outlined) starts during S-phase and ends with the formation of the daughter cell. The black arrow indicates the corresponding cell cycle phase of the Video in Figure 6b.
(b) Representative images of Supplementary Video 4. Simultaneous two-color imaging of cells co-expressing ASH1 24xMBSV6-MCP (gray) and mRubyTub1 (red). Time 0 indicates the beginning of anaphase. Images were acquired every 2 minutes. White arrows = single mRNAs. Scale bar = 5μm.
(c) Quantification of single ASH1 mRNAs during the cell cycle. Time 0 indicates the beginning of anaphase (n= 21). During mitosis, ASH1 decayed with a t1/2 of 6.1±2.8 min.
(d) Quantification of single DOA1 mRNAs tagged with 24xMBSV6-MCP during the complete cell cycle (n=15). Images were acquired every 2 minutes (Supplementary Video 4).
To demonstrate that the disappearance of the mRNA signal is due to mRNA decay and not fading of the MCP-GFP signal during the time of observation, we used same imaging conditions to follow the DOA1 gene, constantly expressed throughout the cell cycle31 (Supplementary Figures 9c–e). The number of single DOA1 molecules quantified over the cell cycle was constant with an average of 2.9±1.1 mRNAs/cell (Fig. 6d and Supplementary Video 4) consistent with two color smFISH experiments (Supplementary Figure 9e). These experiments demonstrated that the MBSV6 system provided the temporal and spatial resolution required to quantify the expression of mRNAs from birth to death in cells.
Discussion
The MS2-MCP system has been extensively used to study gene expression regulation by following endogenously tagged mRNAs1. The use of C-variant MBS is appropriate for mammalian cells where mRNAs with long half-lives are investigated36 (Supplementary Table 1). However, in yeast where the mRNA half-life is short and degradation of the MBS becomes rate limiting, the MBS can accumulate as individual fragments or aggregates11–14. Other systems to detect endogenous mRNA molecules, such as the Spinach or MANGO aptamers37,38 or the RCas9 system39 require additional evaluation of target specificity, formation of artifacts and reliability on reporting single mRNAs. Therefore, we engineered and characterized a new MS2-MCP system that prevented the formation of MBS aggregates by reducing the binding affinity between the MBS and MCP. MBSV6 faithfully recapitulated the life cycle of the mRNA while preserving single molecule resolution. Previous reports using MBS C-variant system suggested that during stress, mRNAs not involved in the stress response (such as MDN1 or ASH1), accumulate in cytoplasmic structures such as PBs, where the mRNAs are stored or degraded15,40. Surprisingly, coordinated recruitment of MDN1 or ASH1 mRNAs tagged with MBSV6 to PBs was not observed. The approach can be used to validate mRNAs tagged with orthologous systems, such as PP741, lambda boxB RNA42 or U1A43.
The modified MS2 system provides a new capability for imaging and measuring the regulatory events of the entire RNA lifetime without perturbation (Supplementary Figure 10 and Supplementary Tables 1 and 3). In particular, the decay events of single RNAs in single cells can now be elucidated with temporal and spatial resolution sufficient to study the localization and function of highly unstable RNAs, such as non-coding or regulatory RNAs as well as the binding proteins regulating them.
Online METHODS
Yeast cell cultures
All strains described are derived either by the S.cerevisiae background BY4741 (MATa;his3Δ1; leu2Δ0; met15Δ0; ura3Δ0) or W303 BMA64-1B (MATα ; ura3-1; trp1Δ 2; leu2-3,112; his3-11,15; ade2-1; can1-100), see Supplementary Table 4. Yeast cultures were exponentially grown in synthetic medium with 2% glucose. Cells were grown at 25°C using constant shaking at 210 rpm. For each application (smFISH and live imaging), details of cell cultures are described in the Method details section.
Mammalian cells cultures
Human U2OS osteoscarcoma cell line (American Type Culture Collection HTB-96) stable expressing tdMCP-GFP6 was used to test the applicability of the MBSV6 system in mammalian cells. U2Os were grown at 37°C and 5% CO2 in DMEM supplemented with 10% fetal bovine serum, 4.5g/L glucose and 1% penicillin-streptomycin. Cells were transient transfected with SINAPsV5 (Wu et al., 2016) or SINAPsV6 (Supplementary Table 4) with lipofectamine 3000 twenty-four hours before being subjected to live imaging experiments. The U2OS cell line was originally purchased from ATCC. We regularly genotype our human cell lines to confirm that our cell lines match the ATCC database. This validation is done by the genomics facility at Albert Einstein College of Medicine. Cells were free of mycoplasma.
Bacteria cell cultures
MBP-MCP-His (pET336) was transformed into Rosetta2 cells (EMD Millipore). Cells were grown at 37°C in LB (with ampicillin and chloramphenicol) until OD600 of 0.6. Protein expression was then induced with 1mM IPTG for 4 hours. Cell pellets were centrifuged and stored at −80 until ready for lysis. Lysis was performed by sonication in lysis buffer (50mM Tris pH 7.2, 1.5M NaCl, 1mM EDTA, 1mM DTT supplemented with one Complete EDTA-free protease inhibitor tablet (Roche)). After centrifugation of cell debris, the soluble protein was first purified by amylose affinity chromatography (New England Biolabs) and subsequently by TALON affinity chromatography (Takara Bioscience). Protein concentration was measured using the absorbance at 280nm and a computationally predicted extinction coefficient (ProtParam).
METHOD DETAILS
Yeast strains construction
Yeast strains were constructed in the BY4741 or BMA64-1A background (Supplementary Table 4). All strains where a gene of interest was tagged with MBSs in the 3′UTR, right after the STOP codon, were prepared as follow: PCR amplification of the MBS insert (see plasmids in Supplementary Table 4) followed by the kanamycin resistance gene, flanked by Loxp sequences, was performed with oligos (see Supplementary Table 4) containing homology sequences (50–70 nt) for the specific gene. For all strains, the Kanamycin resistance gene was removed by expressing the CRE recombinase under the control of the GAL1 promoter (Supplementary Table 4). Genomic DNA was extracted using standard techniques and PCR amplification of the 3′ UTR was loaded on a gel and sent for sequencing to verify the size of the insert.
Plasmids construction
The new MBS sequences, U or C-variants, 12xMBSV6 and 12xMBSV7 were synthetized by Genescript. To obtain the 24xMBSV6 and 24xMBSV7 we cloned the 12xMBS V6/V7 in tandem by using restriction enzymes BamHI and BglII. Orientation of the insert was confirmed by sequencing. The 12xMBS or 24xMBS variants were then sub-cloned in a pUC vector containing the Kanamycin resistance gene flanked by Loxp sites by using the restriction enzymes BamHI SalI. The plasmid pET296 (CYC1p-MCP-NLS-2xGFP) was generated by inserting the CYC1p, amplified from genomic DNA of BY4741, with flanking restriction enzymes XhoI and BamHI. The NLS from SV40 was added at the C-terminus of the MCP coding sequence by PCR amplification using a reverse oligo containing the NLS sequence, flanked by restriction enzymes BamHI and AgeI. The addition of a nuclear localization signal to the MCP reduced the cytoplasmic background during live imaging. In the SINAPsV5 plasmid the sequence of 24xMBSV5 was replaced by digesting with AgeI and ClaI restriction enzymes and inserting within the same site 24XMBSV6 amplified by PCR. For EMSAs a C-terminal His Tag was added by PCR and MCP-His was cloned using BamHI and HindIII sites into a pMalc derivative that contains a Tobacco Etch Virus (TEV) site after the maltose-binding protein (plasmid pET336- Supplementary Table 4).
smFISH probes preparation
ASH1, DOA1, GAL1, MDN1, MBSV5, MBSV6, MBSV7 probes were designed using the StellarisTM Probe Designer by LGC Biosearch Technologies and purchased from Biosearch Technologies. HSP104 and MBSORF probes were synthetized by Invitrogen-Thermo Fisher, and labelled in the lab using Cy3 dyes (Amersham) as previously described31. Sequence and fluorophores for all the probes are provided in Supplementary Table 4.
smFISH and image acquisition and analysis
Single molecule FISH (smFISH), was essentially performed as follows. Yeast strains were grown overnight at 25°C in selective medium with 2% glucose. In the morning cells were diluted to OD600 0.1 and allowed to grow until OD600 0.3–0.4. Yeast strains tagged in the GAL1 gene were grown for twenty-four hours in SC-Leu supplemented with 2% Raffinose. At OD = 0.3, GAL1 expression was induced with 0.2% galactose for thirty minutes and decay was induced by adding 4% glucose, as described in Fig. 5A. Cells were fixed by adding paraformaldehyde (32% solution, EM grade; Electron Microscopy Science #15714) to a final concentration of 4% and gently shacked at room temperature for 45 minutes. Cells were then washed 3 times with buffer B (1.2M sorbitol and 100mM potassium phosphate buffer pH=7.5) and resuspended in 500μL of spheroplast buffer (buffer B containing 20 mM VRC (Ribonucleoside–vanadyl complex NEB #S1402S), and 25U of Lyticase enzyme (Sigma #L2524) per OD of cells for about 10 minutes at 30°C. Digested cells were washed once with buffer B and resuspended in 1mL of buffer B. 150 μL of cells were seeded on 18mm poly-lysine treated coverslips and incubated at 4°C for 30 minutes. Coverslips were washed once with buffer B, gently covered with ice-cold 70% ethanol and stored at −20°C. For hybridization, coverslips were rehydrated by adding 2xSSC at room temperature twice for 5 minutes. Coverslips were pre-hybridized with a mix containing 10% formamide (ACROS organics #205821000)/2xSSC, at room temperature for 30 minutes. For each coverslip the probe mix (to obtain a final concentration in the hybridization mix of 125nM) was added to 5μL of 10mg/μL E. coli tRNA/ ssDNA (1:1) mix and dried with a speed-vac. The dried mix was resuspended in 25 μL of hybridization mix (10% formamide, 2×SSC, 1 mg/ml BSA, 10mM VRC, 5mM NaHPO4 pH 7.5) and heated at 95°C for 3 minutes. Cells were then hybridized at 37°C for 3 hours in the dark. Upon hybridization coverslips were washed twice with pre-hybridization mix for 30 minutes at 37°C, once with 0.1% Triton X-100 in 2xSSC for 10 minutes at room temperature, once with 1xSSC for 10 minutes at room temperature. Nuclei were stained with 0.5μg/mL DAPI in 1xPBS for 2 minutes at room temperature, washed with 1xPBS for 10 minutes at room temperature. Coverslips were mounted on glass slides using ProLong Gold antifade (Thermo Fisher). Images were acquired using an Olympus BX61 wide field epi-fluorescence microscope with a 100X/1.35NA UPlanApo objective. Samples were visualized using an X-Cite 120 PC lamp (EXFO) and the ORCA-R2 Digital CCD camera (Hamamatsu). Metamorph software (Molecular Devices) was used for acquisition. Z-sections were acquired at 200nm intervals over an optical range of 8.0 μm. Image pixel size: XY, 64.5 nm. FISH images were analyzed using FISHQUANT22. Briefly, after background subtraction, the FISH spots in the cytoplasm were fit to a three-dimensional (3D) Gaussian to determine the coordinates of the mRNAs. The intensity and width of the 3D Gaussian were thresholded to exclude nonspecific signal. The average intensity of all the mRNAs was used to determine the intensity of each transcription site.
Sample preparation for live yeast fluorescence imaging
Yeast cells were grown at 25°C in synthetic selective medium. Exponentially growing cells (O.D. 0.2–0.4) were plated on coated Delta-T dishes (Bioptech- 04200417C). The dishes coating was done by incubating with Concanavalin A 1mg/ml (Cayman chemical company) for 10 minutes at room temperature. Excess liquid was aspirated and dishes were dried at room temperature. To activate Concanavalin A, dishes were incubated for 10 minutes at room temperature with a 50mM CaCl2 50mM MnCl2 solution. Excess was removed and dishes dried at room temperature. Finally, dishes were washed once with ultrapure water (Invitrogen), and let completely dry at room temperature. Cells attachment was performed by gravity for 20 minutes at room temperature, excess liquid removed and substitution with fresh media. Glucose deprivation was performed by growing cells co-transformed with plasmids MCP-2xGFP and Edc3-mCherry in double selective medium with- 2% glucose overnight at 25°C. Cells were diluted in the morning and grown until OD600 0.3–0.4. Cells were plated on Concanavalin A coated dishes. Images were acquired before glucose starvation and then, keeping the dishes on the microscope stage with appropriate temperature control, washes were performed 6 times with 1 ml of medium without glucose. Cells were then kept in medium lacking glucose at 25°C taking z-stacks every minute for 40 minutes.
Live cells fluorescence imaging and image analysis
The two-color simultaneous imaging of mRNAs and the appropriate cellular marker was performed on a modified version of the home-built microscope described in6. Briefly, the microscope was built around an IX71 stand (Olympus). For excitation, a 491nm laser (CalypsoTM, Cobolt) and a 561nm laser (JiveTM, Cobolt) were combined and controlled by an acoustic-optic tunable filter (AOTF, AOTFnC-400.650-TN, AA Opto-electronic) before coupled into a single mode optical fiber (Qioptiq). The output of the fiber was collimated and delivered through the back port of the microscope and reflected into an Olympus 150× 1.45 N.A. Oil immersion objective lens with a dichroic mirror (zt405/488/561rpc, 2mm substrate, Chroma). The tube lens (180mm focal length) was removed from the microscope and placed outside of the right port. A triple band notch emission filter (zet405/488/561m) was used to filter the scattered laser light. A dichroic mirror (T560LPXR, 3mm substrate, Chroma) was used to split the fluorescence onto two precisely aligned EMCCDs (Andor iXon3, Model DU897) mounted on alignment stages (x, y, z, θ- and φ- angle). Emission filters FF03-525/50-25 and FF01-607/70-25 (Semrock) were placed in front of green and red channel cameras respectively. The two cameras were triggered for exposure with a TTL pulse generated on a DAQ board (Measurement Computing). The microscope was equipped with a piezo stage (ASI) for fast z-stack and a Delta-T incubation system (Bioptech) for live cell imaging. The microscope (AOTF, DAQ, Stage and Cameras) was automated with the software Metamorph (Molecular Devices). For two-color live cell imaging, yeast cells were streamed at 50 ms, Z plane was streamed, and Z-stacks acquired every 0.5 μm. Single molecule analysis was done on the maximal projected images using AIRLOCALIZE36.
Recombinant Protein Preparation
Transformation of pET336 and purification were performed as previously described41. In brief, constructs were transformed into Rosetta2 cells (EMD Millipore) and protein induction was performed for 4 hours at 37°C. Cell pellets were lysed by sonication in 50mM Tris pH 7.2, 1.5M NaCl, 1mM EDTA, 1mM DTT supplemented with one Complete EDTA-free protease inhibitor tablet (Roche). After centrifugation, the soluble protein was first purified by amylase affinity chromatography (New England Biolabs) and subsequently by TALON affinity chromatography (Takara Bioscience).
Electrophoretic Mobility Shift Assay (EMSA)
Single stem loop fragments with 5′ fluorescein modification (Dharmacon) were deprotected as per the manufacturer recommendation. Prior to the experiment, RNA stocks were heated to 70°C for 5 minutes then snap cooled on ice. The sequences of the RNAs used for these experiments are listed in Supplementary Table 4. Complexes were monitored and quantified by EMSA as previously described41. In brief, 100pM RNAs were incubated at room temperature for three hours with 2 fold dilutions of MCP in 10mM Tris, 100mM NaCl, 0.1mM EDTA, 0.01mg/mL tRNA, 50μg/mL heparin and 0.01% IGEPAL CA630. Complexes were then run using 5% native PAGE in 0.5× TBE and visualized using the Typhoon 9400 variable mode laser scanner (GE Healthcare). Uncropped gels in Supplementary Figure 11.
RNA preparation and Northern blots
Total mRNA was isolated from yeast cultures grown at 25°C in synthetic selective medium as described in11,13. For strains tagged in the GAL1 gene, yeast were cultured overnight in 2% raffinose and then induced for five hours with 0.2% galactose. Northern blots were performed by resolving 10μg total RNA on 1.5% formaldehyde agarose gel, transferring by capillary action to a Nytran membrane, and, probing blots with [32P] end-labelled oligonucleotide complementary to the 3′ UTR of ASH1 (5′- ACAAGGAGAGAAATGTACAATTGTTTCGTGATAATGTCTCTTATTAGTTG-3′) and GAL1 (5′-AAATGAGAAGTTGTTCTGAAACAAAGTAAA-3′ and 5′-TTGCGTATTTGTGATGCTAAAGTTATGAGTAGA-3′) as described in detailed in11,13. Blots were stripped and reprobed for the 7S RNA using the following probe oRP100 (5′ – GTCTAGCCGCGAGGAAGG – 3′). Blots were visualized using a phosphoimager. Original Northern Blots in Supplementary Figure 12.
QUANTIFICATION AND STATISTICAL ANALYSIS
FISH-quant was used to quantify single mRNA molecules in fixed samples22. Airlocalize was used to quantify single mRNA molecules in live cells36. GraphPad Prism was used to calculate the mean and the standard deviation (SD) of all the data and perform the statistical analysis. The distribution of the mRNAs as reported in all “frequency distribution plots” was generated using the same binning. For each experiment the n, statistical analysis applied and significance (P<0.05 for significant differences) is indicated in the Fig. legend or the results section of the main text. All cells that fulfil the requirements for single molecules detection were included in the analysis.
Supplementary Material
Acknowledgments
We thank X. Meng for help with cloning. D. Muhlrad for help with the Northern blots. B. Wu for writing the script to generate the new MBS system. C. Eliscovich, Y. Yoon and S. Das for critical reading. This work was supported by NIH Grant GM57071 to R.H.S. R.P. was supported by HHMI. E.T was supported by Swiss National Science Foundation Fellowships P2GEP3_155692 and P300PA_164717. J.B was supported by training support for AECOM (T32GM007288) and pre-doctoral fellowship (F30CA214009). J.G. was supported by NIH grant F32 GM10807.
Footnotes
Authors Contributions
E.T and M.V. designed and performed the experiments and analyzed the data. J.B performed EMSAs. J.G. performed the northern blot. E.T, M.V and R.H.S. conceived ideas and wrote the manuscript with inputs from R.P. R.H.S supervised the research.
Competing Financial Interest
The material in this manuscript is the subject of a provisional application to the US Patent and Trademark Office. It has not been licensed to any corporation, and the authors (E.T, M.V. and R.H.S) are the sole inventors.
Data Availability and Accession Code Availability statement
Further information and requests for resources and reagents should be directed to and will be fulfilled by the Lead Contact, Robert H. Singer (robert.singer@einstein.yu.edu)
References
- 1.Vera M, Biswas J, Senecal A, Singer RH, Park HY. Single-Cell and Single-Molecule Analysis of Gene Expression Regulation. Annual review of genetics. 2016;50:267–291. doi: 10.1146/annurev-genet-120215-034854. [DOI] [PMC free article] [PubMed] [Google Scholar]
- 2.Bernardi A, Spahr PF. Nucleotide sequence at the binding site for coat protein on RNA of bacteriophage R17. Proceedings of the National Academy of Sciences of the United States of America. 1972;69:3033–3037. doi: 10.1073/pnas.69.10.3033. [DOI] [PMC free article] [PubMed] [Google Scholar]
- 3.Bertrand E, et al. Localization of ASH1 mRNA particles in living yeast. Molecular cell. 1998;2:437–445. doi: 10.1016/s1097-2765(00)80143-4. doi:S1097-2765(00)80143-4 [pii] (1998) [DOI] [PubMed] [Google Scholar]
- 4.Grunwald D, Singer RH. In vivo imaging of labelled endogenous beta-actin mRNA during nucleocytoplasmic transport. Nature. 2010;467:604–607. doi: 10.1038/nature09438. [DOI] [PMC free article] [PubMed] [Google Scholar]
- 5.Larson DR, Zenklusen D, Wu B, Chao JA, Singer RH. Real-time observation of transcription initiation and elongation on an endogenous yeast gene. Science (New York, NY) 2011;332:475–478. doi: 10.1126/science.1202142. [DOI] [PMC free article] [PubMed] [Google Scholar]
- 6.Wu B, Eliscovich C, Yoon YJ, Singer RH. Translation dynamics of single mRNAs in live cells and neurons. Science (New York, NY) 2016;352:1430–1435. doi: 10.1126/science.aaf1084. [DOI] [PMC free article] [PubMed] [Google Scholar]
- 7.Halstead JM, et al. Translation. An RNA biosensor for imaging the first round of translation from single cells to living animals. Science (New York, NY) 2015;347:1367–1671. doi: 10.1126/science.aaa3380. [DOI] [PMC free article] [PubMed] [Google Scholar]
- 8.Morisaki T, et al. Real-time quantification of single RNA translation dynamics in living cells. Science (New York, NY) 2016;352:1425–1429. doi: 10.1126/science.aaf0899. [DOI] [PubMed] [Google Scholar]
- 9.Lim B, Levine M, Yamakazi Y. Transcriptional Pre-patterning of Drosophila Gastrulation. Curr Biol. 2017;27:286–290. doi: 10.1016/j.cub.2016.11.047. [DOI] [PMC free article] [PubMed] [Google Scholar]
- 10.Tantale K, et al. A single-molecule view of transcription reveals convoys of RNA polymerases and multi-scale bursting. Nature communications. 2016;7:12248. doi: 10.1038/ncomms12248. [DOI] [PMC free article] [PubMed] [Google Scholar]
- 11.Garcia JF, Parker R. MS2 coat protein bound to yeast mRNAs block 5′ to 3′ degradation and trap mRNA decay products: implications for the localization of mRNAs by MS2-MCP system. RNA (New York, NY) 2015 doi: 10.1261/rna.051797.115. [DOI] [PMC free article] [PubMed] [Google Scholar]
- 12.Heinrich S, Sidler CL, Azzalin CM, Weis K. Stem-loop RNA labeling can affect nuclear and cytoplasmic mRNA processing. RNA (New York, NY) 2017;23:134–141. doi: 10.1261/rna.057786.116. [DOI] [PMC free article] [PubMed] [Google Scholar]
- 13.Garcia JF, Parker R. Ubiquitous accumulation of 3′ mRNA decay fragments in Saccharomyces cerevisiae mRNAs with chromosomally integrated MS2 arrays. RNA (New York, NY) 2016;22:657–659. doi: 10.1261/rna.056325.116. [DOI] [PMC free article] [PubMed] [Google Scholar]
- 14.Haimovich G, et al. Use of the MS2 aptamer and coat protein for RNA localization in yeast: A response to “MS2 coat proteins bound to yeast mRNAs block 5′ to 3′ degradation and trap mRNA decay products: implications for the localization of mRNAs by MS2-MCP system. RNA (New York, NY) 2016;22:660–666. doi: 10.1261/rna.055095.115. [DOI] [PMC free article] [PubMed] [Google Scholar]
- 15.Sheth U, Parker R. Decapping and decay of messenger RNA occur in cytoplasmic processing bodies. Science (New York, NY) 2003;300:805–808. doi: 10.1126/science.1082320. [DOI] [PMC free article] [PubMed] [Google Scholar]
- 16.Zid BM, O’Shea EK. Promoter sequences direct cytoplasmic localization and translation of mRNAs during starvation in yeast. Nature. 2014;514:117–121. doi: 10.1038/nature13578. [DOI] [PMC free article] [PubMed] [Google Scholar]
- 17.Zipor G, et al. Localization of mRNAs coding for peroxisomal proteins in the yeast, Saccharomyces cerevisiae. Proceedings of the National Academy of Sciences of the United States of America. 2009;106:19848–19853. doi: 10.1073/pnas.0910754106. [DOI] [PMC free article] [PubMed] [Google Scholar]
- 18.Long RM, et al. Mating type switching in yeast controlled by asymmetric localization of ASH1 mRNA. Science (New York, NY) 1997;277:383–387. doi: 10.1126/science.277.5324.383. [DOI] [PubMed] [Google Scholar]
- 19.Zenklusen D, Larson DR, Singer RH. Single-RNA counting reveals alternative modes of gene expression in yeast. Nature structural & molecular biology. 2008;15:1263–1271. doi: 10.1038/nsmb.1514. [DOI] [PMC free article] [PubMed] [Google Scholar]
- 20.Hocine S, Raymond P, Zenklusen D, Chao JA, Singer RH. Single-molecule analysis of gene expression using two-color RNA labeling in live yeast. Nature methods. 2013;10:119–121. doi: 10.1038/nmeth.2305. [DOI] [PMC free article] [PubMed] [Google Scholar]
- 21.Wu B, et al. Synonymous modification results in high-fidelity gene expression of repetitive protein and nucleotide sequences. Genes & development. 2015;29:876–886. doi: 10.1101/gad.259358.115. [DOI] [PMC free article] [PubMed] [Google Scholar]
- 22.Mueller F, et al. FISH-quant: automatic counting of transcripts in 3D FISH images. Nature methods. 2013;10:277–278. doi: 10.1038/nmeth.2406. [DOI] [PubMed] [Google Scholar]
- 23.Lowary PT, Uhlenbeck OC. An RNA mutation that increases the affinity of an RNA-protein interaction. Nucleic acids research. 1987;15:10483–10493. doi: 10.1093/nar/15.24.10483. [DOI] [PMC free article] [PubMed] [Google Scholar]
- 24.Valegard K, et al. The three-dimensional structures of two complexes between recombinant MS2 capsids and RNA operator fragments reveal sequence-specific protein-RNA interactions. Journal of molecular biology. 1997;270:724–738. doi: 10.1006/jmbi.1997.1144. [DOI] [PubMed] [Google Scholar]
- 25.Lohr D, Venkov P, Zlatanova J. Transcriptional regulation in the yeast GAL gene family: a complex genetic network. FASEB journal : official publication of the Federation of American Societies for Experimental Biology. 1995;9:777–787. doi: 10.1096/fasebj.9.9.7601342. [DOI] [PubMed] [Google Scholar]
- 26.Hsu C, et al. Stochastic signalling rewires the interaction map of a multiple feedback network during yeast evolution. Nature communications. 2012;3:682. doi: 10.1038/ncomms1687. [DOI] [PMC free article] [PubMed] [Google Scholar]
- 27.Simpson CE, Lui J, Kershaw CJ, Sims PF, Ashe MP. mRNA localization to P-bodies in yeast is bi-phasic with many mRNAs captured in a late Bfr1p-dependent wave. J Cell Sci. 2014;127:1254–1262. doi: 10.1242/jcs.139055. [DOI] [PMC free article] [PubMed] [Google Scholar]
- 28.Haim-Vilmovsky L, Gerst JE. m-TAG: a PCR-based genomic integration method to visualize the localization of specific endogenous mRNAs in vivo in yeast. Nat Protoc. 2009;4:1274–1284. doi: 10.1038/nprot.2009.115. [DOI] [PubMed] [Google Scholar]
- 29.Haimovich G, et al. Gene expression is circular: factors for mRNA degradation also foster mRNA synthesis. Cell. 2013;153:1000–1011. doi: 10.1016/j.cell.2013.05.012. [DOI] [PubMed] [Google Scholar]
- 30.Kshirsagar M, Parker R. Identification of Edc3p as an enhancer of mRNA decapping in Saccharomyces cerevisiae. Genetics. 2004;166:729–739. doi: 10.1093/genetics/166.2.729. [DOI] [PMC free article] [PubMed] [Google Scholar]
- 31.Trcek T, Larson DR, Moldon A, Query CC, Singer RH. Single-molecule mRNA decay measurements reveal promoter- regulated mRNA stability in yeast. Cell. 2011;147:1484–1497. doi: 10.1016/j.cell.2011.11.051. [DOI] [PMC free article] [PubMed] [Google Scholar]
- 32.Long RM, et al. Characterization of transport and localization of ASH1 mRNA in yeast. Molecular biology of the cell. 1997;8:2060–2060. [Google Scholar]
- 33.Heym RG, Niessing D. Principles of mRNA transport in yeast. Cellular and molecular life sciences : CMLS. 2012;69:1843–1853. doi: 10.1007/s00018-011-0902-4. [DOI] [PMC free article] [PubMed] [Google Scholar]
- 34.Pereira G, Schiebel E. The role of the yeast spindle pole body and the mammalian centrosome in regulating late mitotic events. Current opinion in cell biology. 2001;13:762–769. doi: 10.1016/s0955-0674(00)00281-7. [DOI] [PubMed] [Google Scholar]
- 35.Eser P, et al. Periodic mRNA synthesis and degradation co-operate during cell cycle gene expression. Molecular systems biology. 2014;10:717. doi: 10.1002/msb.134886. [DOI] [PMC free article] [PubMed] [Google Scholar]
- 36.Lionnet T, et al. A transgenic mouse for in vivo detection of endogenous labeled mRNA. Nature methods. 2011;8:165–170. doi: 10.1038/nmeth.1551. [DOI] [PMC free article] [PubMed] [Google Scholar]
- 37.Dolgosheina EV, et al. RNA mango aptamer-fluorophore: a bright, high-affinity complex for RNA labeling and tracking. ACS chemical biology. 2014;9:2412–2420. doi: 10.1021/cb500499x. [DOI] [PubMed] [Google Scholar]
- 38.Guet D, et al. Combining Spinach-tagged RNA and gene localization to image gene expression in live yeast. Nature communications. 2015;6:8882. doi: 10.1038/ncomms9882. [DOI] [PMC free article] [PubMed] [Google Scholar]
- 39.Nelles DA, et al. Programmable RNA Tracking in Live Cells with CRISPR/Cas9. Cell. 2016;165:488–496. doi: 10.1016/j.cell.2016.02.054. [DOI] [PMC free article] [PubMed] [Google Scholar]
- 40.Aizer A, et al. Quantifying mRNA targeting to P-bodies in living human cells reveals their dual role in mRNA decay and storage. Journal of cell science. 2014;127:4443–4456. doi: 10.1242/jcs.152975. [DOI] [PubMed] [Google Scholar]
- 41.Chao JA, Patskovsky Y, Almo SC, Singer RH. Structural basis for the coevolution of a viral RNA-protein complex. Nature structural & molecular biology. 2008;15:103–105. doi: 10.1038/nsmb1327. [DOI] [PMC free article] [PubMed] [Google Scholar]
- 42.Daigle N, Ellenberg J. LambdaN-GFP: an RNA reporter system for live-cell imaging. Nature methods. 2007;4:633–636. doi: 10.1038/nmeth1065. [DOI] [PubMed] [Google Scholar]
- 43.Brodsky AS, Silver PA. Pre-mRNA processing factors are required for nuclear export. RNA (New York, NY) 2000;6:1737–1749. doi: 10.1017/s1355838200001059. [DOI] [PMC free article] [PubMed] [Google Scholar]
Associated Data
This section collects any data citations, data availability statements, or supplementary materials included in this article.