Correction to: Scientific Reports 10.1038/s41598-017-10718-y, published online 06 September 2017
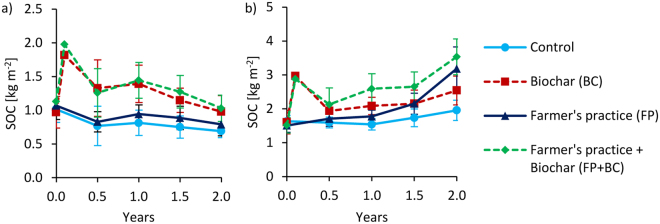
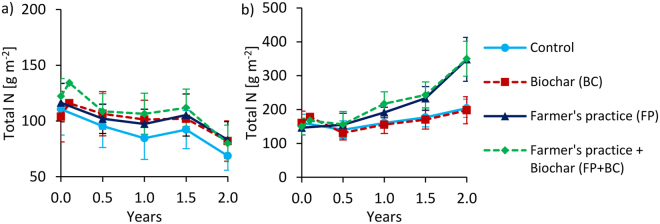
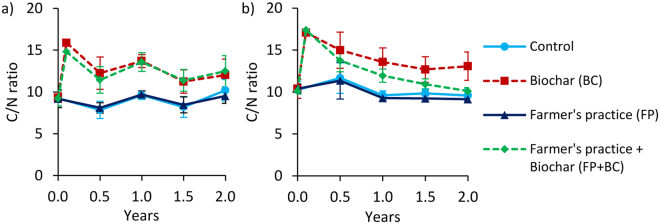
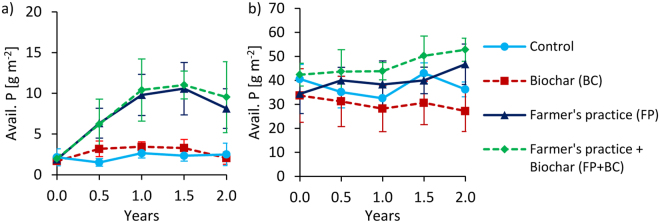
This Article contains errors in Figures 1, 4, 5, 7, 8 and 9, where the keys were omitted. The correct Figures 1, 4, 5, 7, 8 and 9 appear below as Figures 1, 2, 3, 4, 5 and 6 respectively.
Figure 1.
Changes of soil organic carbon stocks over time at 0–20 cm depth for Tamale (a) and Ouagadougou (b). Means were calculated irrespective of irrigation water quantity and quality levels because they had no significant effects on SOC stocks (means ± sd; n = 16). Values after biochar additions (between 0 and 0.5 years) are calculated and have no standard deviation.
Figure 2.
Changes of total N stocks over time at 0–20 cm depth for Tamale (a) and Ouagadougou (b). Means were calculated irrespective of irrigation water quantity and quality levels because they had no significant effects on N stocks (means ± sd; n = 16). Values after biochar additions (between 0 and 0.5 years) are calculated and have no standard deviation.
Figure 3.
C/N ratio changes over time at 0–20 cm depth for Tamale (a) and Ouagadougou (b). Means were calculated irrespective of irrigation water quantity and quality levels because they had no significant effects on C/N ratios (means ± sd; n = 16). Values after biochar additions (between 0 and 0.5 years) are calculated and have no standard deviation.
Figure 4.
Changes of available P (Bray) over time at 0–20 cm depth under full irrigation for Tamale (a) and Ouagadougou (b). Means were calculated irrespective of irrigation water quality levels because they had no significant effects on available P (means ± sd; n = 8).
Figure 5.
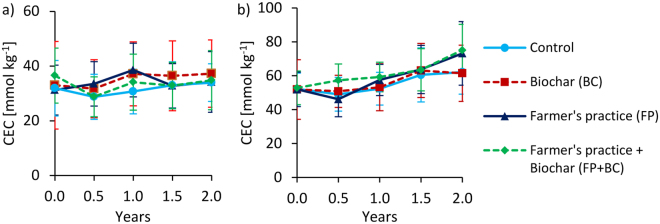
Changes of effective cation exchange capacity (CEC) over time at 0–20 cm depth under full irrigation for Tamale (a) and Ouagadougou (b). Means were calculated irrespective of irrigation water quality levels because they had no significant effects on CEC (means ± sd; n = 8).
Figure 6.
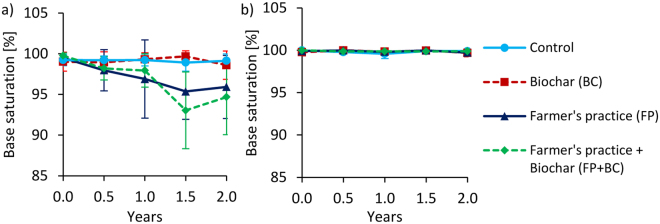
Changes of effective base saturation (BS) over time at 0–20 cm depth under full irrigation for Tamale (a) and Ouagadougou (b). Means were calculated irrespective of irrigation water quality levels because they had no significant effects on BS (means ± sd; n = 8).
Footnotes
The original article can be found online at 10.1038/s41598-017-10718-y.


