

Abstract
Objective:
The accuracy of aldosterone/direct renin concentration ratio (ADRR) as a screening test in patients with primary aldosteronism (PA) varies widely across the studies. Therefore, we conducted a meta-analysis to assess the accuracy of ADRR.
Methods:
A literature search was performed in PubMed, Embase, and the Cochrane library published between April 1971–February 2016. Studies focusing on the accuracy of ADRR for PA screening were included. Two authors independently extracted information regarding patient characteristics, antihypertensives status, true positives, true negatives, false positives, and false negatives. The random-effects model was used for statistical analysis. Heterogeneity was explored by subgroup analysis and meta-regression.
Results:
Nine studies involving 974 patients were included. The overall sensitivity, specificity, area under the curve, and diagnostic odds ratio of ADRR were 0.89 (95% confidence interval (CI) 0.84–0.93), 0.96 (95% CI 0.95–0.98), 0.985 and 324 respectively, with substantial heterogeneity. Meta-regression showed that antihypertensive status affects the ADRR and may account for the heterogeneity (p=0.03). Subgroup analysis of patients who discontinued the antihypertensives revealed a sensitivity of 0.99 (95% CI, 0.95–1.00) and a specificity of 0.98 (95% CI, 0.96–0.99).
Conclusions:
This study demonstrates the efficacy of ADRR as a screening test for PA. However, as antihypertensive drugs can interfere with the interpretation of ADRR, it is recommended to interrupt therapy or at least replace with analogues that do not significantly affect the ADRR value.
Keywords: Primary aldosteronism, direct renin concentration, aldosterone-to-renin ratio, aldosterone/direct renin concentration, screening test
Introduction
Primary aldosteronism (PA), described by Conn in 1955,1 is one of the most common endocrine cause of secondary hypertension. The prevalence of PA is more than 10% in hypertensive patients.2 Moreover, PA patients tend to experience more cardiovascular events than those with essential hypertension (EH).3 Consequently, an accurate and early diagnosis of PA is essential, as specific treatment can alleviate its impact on mortality. As recommended by the guidelines, the aldosterone-to-renin ratio (ARR) is currently used for PA screening.2 An elevated ARR indicates the possibility of PA but further confirmatory testing is required. Conventionally, the plasma aldosterone concentration (PAC) and plasma renin activity (PRA) are measured to calculate ARR (PAC/PRA). However, PRA measurement is influenced by various factors, e.g. angiotensinogen concentration, incubation conditions, pH value, and it shows poor inter-laboratory reproducibility.4 To avoid these issues, the measurement of direct renin concentration (DRC) is appropriate to determine ARR (PAC/DRC). The DRC assay provides several advantages compared with PRA, e.g. specimen handing, shorter turn around time, better reproducibility, and easier standardization.5 Correlation between DRC and PRA is generally good except when concentration of PRA is below 1 ng/ml/h.5,6 Meanwhile, the diagnostic efficiency of plasma aldosterone/direct renin concentration ratio (ADRR, PAC/DRC) was varied in studies,7–19 and no general consensus regarding the impact of antihypertensives on the measured ADRR value is available.
Accordingly, we conducted a meta-analysis to assess the accuracy of ADRR, and the impact of antihypertensives on PA screening.
Methods
Search strategy and study criteria
The electronic databases PubMed, Embase, and the Cochrane library were screened for the following keywords: “primary aldosteronism,” “primary hyperaldosteronism,” and “renin concentration.”- The search was limited to publications in English on human subjects. The period from April 1971–February 2016 was included in the search; the related bibliographies were screened for relevant additional studies. The abstracts of the studies were independently evaluated according to the inclusion criteria by two authors (XL and RG). Studies were included when fulfilling the following points: (a) studies using at least one of the four confirmatory tests (oral sodium loading test, saline infusion test, fludrocortisones suppression test, and captopril challenge test) recommended by guidelines2 or if a histopathological diagnosis for PA was made; (b) studies discussing the accuracy of diagnosis for ADRR in PA screening and a 2×2 table with a certain cut-off could be constructed; and (c) the availability of a full text publication.
Data extraction
Two reviewers (XL and RG) independently performed the data extraction of all selected studies. The extracted data consisted of information about the first author, year of publication, sample size, gender, original cut-off for a positive result, antihypertensives status, blood sampling conditions, potassium concentration, and a 2×2 table of true positives, true negatives, false positives, and false negatives. For a better comparison the ADRR units (pmol/l)/(mU/l) were divided by 1.76 to convert to (ng/l)/(ng/l) as per the guidelines.2 Disagreements were resolved by discussion until consensus was reached. Authors were contacted for additional information if the required data were unclear or were not presented in the full article.
Quality assessment
The Quality Assessment of Diagnostic Accuracy Studies (QUADAS-2) criteria recommended by the Cochrane Collaboration was used to evaluate the methodological quality of each included study.20 QUADAS-2 criteria consist of four key domains: the patient selection, the index test, the reference standard, and the flow and timing of samples/patients along the study. Each is assessed in terms of risk of bias and the first three in terms of concerns regarding applicability. Each key domain was graded as “low,” “high,” or “unclear,” if information for accurate judgment was lacking.
Statistical analysis
First, the threshold effect was evaluated by the Spearman correlation coefficient. Meanwhile, I2 was used to evaluate the influence of heterogeneity between studies caused by inconsistencies instead of chance. The quantity I2 ranges from 0–100%, where 0% indicates the unobserved heterogeneity and more than 50% may represent substantial heterogeneity. The random effects model was used when I2 was more than 30%. Pooled sensitivity and specificity estimation points with 95% confidence intervals (CIs) were calculated for PA screening. Forest plots were used to display sensitivity and specificity in this study. For each outcome, the summary receiving operation characteristic curves and the respective area under the curve (AUC) were constructed for accuracy. The diagnostic odds ratio (DOR) is the ratio of the odds of a positive test result in a patient with disease compared with the odds of a positive test result in a patient without disease. It is the best indicator of test performance. To explore the causes of heterogeneity among the studies, meta-regression as well as subgroup analysis was performed. More than four studies in a subgroup were selected to achieve more credible results. For meta-regression, the residual maximum likelihood method was used to estimate between–study variance, and the discontinuation of antihypertensives was included as a covariate. Funnel plots were constructed to allow visual inspection for potential publication bias.21 All analyses were performed with Meta-Disc version 1.4. The funnel plots were constructed by STATA version 12.0 (Stata Corporation, College Station, Texas, USA). All statistical tests were two-sided, with a p value of 0.05 denoting statistical significance.
Results
The literature search identified 1043 articles (Figure 1). The titles and abstracts of all articles were screened. Twenty-one articles were retrieved for full text evaluation. Nine articles7–15 of these, met our inclusion criteria for final meta-analysis as summarized in Table 1. From all reviewed studies, the most common reasons for exclusion were the following: (a) the study was unable provide the basis for a 2×2 table with a specific cut-off (n=6); (b) the study did not use any confirmatory tests in diagnosing PA (n=5); and (c) the study used the post-captopril DRC (n=1). In total, nine studies including 974 subjects were selected; PA patients were recruited as patient groups in all of the studies whereas one study included only patients with aldosterone-producing adenoma (APA), a subtype of PA, as their patient group. However, the definition of control group varied in the studies. EH patients were assigned as controls in six studies.7,9,10,13–15 Normotensive and EH subjects were recruited as controls in the study conducted by Corbin et al.8 Normotensive subjects were also used as controls in the study conducted by Perschel et al.11 Lastly, in the study by Tzanela et al.,12 the control set comprised 79 subjects without suspected adrenal diseases, 27 members were hypertensive and the other 52 were normotensive. The cut-off of ADRR ranged from 26.35 ((ng/l)/(ng/l)) to 59.66 ((ng/l)/(ng/l)). Five studies8,9,11–13 interrupted antihypertensive-therapy, ranging from three days to six weeks, before blood sampling. An upright posture was used for blood sampling in most studies,7–9,11–14 while in one study blood samples were collected in the supine position.10
Figure 1.

Literature search results for identification, exclusion and selection of studies. DRC: direct renin concentration; PA: primary aldosteronism.
Table 1.
Descriptive summary of the patients’ characteristics in the studies included in the analysis.
| Author | Year | Male% | Study population | Cut-off of original test |
Cut-off ((ng/l)/(ng/l)) |
Potassium concentration | Discontinuation of antihypertensives |
Sample size |
Sampling condition |
|---|---|---|---|---|---|---|---|---|---|
| Balas7 | 2010 | 0.34 | PA, EH | 26.35 (ng/l)/(ng/l) | 26.35 | 3.4±0.7 | No | 61 | Sitting for at least 15 min in the morning |
| Perschel11 | 2004 | 0.38 | PA, N | 71 (pmol/l)/(mu/l) | 40.34 | 3.4±0.5 | Yes | 104 | Upright sitting posture at 0800 h |
| Tzanela12 | 2007 | 0.22 | PA, NAI+ adrenal mass without PA |
32 (pg/ml)/(μU/ml) | 50.46 | N/A | Yes | 123 | Ambulatory condition at 0900 h |
| Diederich9 | 2007 | 0.48 | PA, EH | 105 (pmol/l)/(mu/l) | 59.66 | 2–4.3 | Yes | 107 | Upright sitting posture between 0800 and 1200 h |
| Willenberg13 | 2009 | 0.35 | PA, EH | 33 (ng/l)/(ng/l) | 33 | 3.6±0.6 | Yes | 106 | Sitting for 30 min in the morning |
| Corbin8 | 2011 | 0.51 | PA, N+EH | 130 (pmol/ng) | 46.93 | 3.2±0.1 | Yes | 211 | Ambulatory condition in the midmorning |
| Lonati10 | 2014 | N/A | APA, EH | 3.7(ng/dl/mu/l) | 58.35 | 2.3–4.3 | No | 98 | Supine position at least for 45 min between 0800 and 1200 h |
| Jansen14 | 2014 | N/A | PA EH | 91 (pmol/l)/(mu/l) | 51.82 | 3.9±0.5 | No | 178 | Sitting for 10 min between 0800 and 1000 h |
| Fischer15 | 2011 | 0.46 | PA EH | 20 ng/mu | 31.54 | 3.4±0.1 | No | 50 | Not mentioned |
APA: aldosterone-producing adenoma; EH: essential hypertension; N: normotensive patient; N/A: not available because data regarding the number of cases not mentioned in the articles; NAI: normaladrenal imaging; PA: primary aldosteronism.
Risk of bias and applicability judgments
The risk of bias is shown in Table 2. In the risk of bias, only one study used normotensives as a control group and thus had a high risk of bias in the selection of patients. As to the index test, most studies had high risk, as they did not pre-specify the cut-off values for ADRR. Regarding the reference standard as well as flow and timing, none of the studies showed a high risk. In applicability bias, a high risk of bias was not found in applicability except for one study, which recruited normotensive subjects as its control group.
Table 2.
Risk of bias and applicability concerns summary: review authors’ judgments about each domain for each study included.
| First author | Risk of bias |
Applicability bias |
|||||
|---|---|---|---|---|---|---|---|
| Patient selection |
Index test |
Reference standard |
Flow and timing |
Patient selection |
Index test |
Reference standard |
|
| Balas7 | +/− | − | + | + | + | + | + |
| Perschel11 | − | − | + | + | − | + | + |
| Tzanela12 | + | − | + | + | + | + | + |
| Diederich9 | + | − | + | + | + | + | + |
| Willenberg13 | + | − | + | + | + | + | + |
| Corbin8 | + | − | + | + | + | + | + |
| Lonati10 | + | + | + | + | + | + | + |
| Jansen14 | + | + | + | + | + | + | + |
| Fischer15 | + | + | + | + | + | + | + |
Use of + indicates the authors’ judgment as positive, low risk of bias or applicability concern; +/– indicates authors’ judgment neutral, unclear risk of bias or applicability concern; – indicates authors’ judgment negative, high risk of bias or applicability concern.
Overall analyses and publication bias
There was no threshold effect because the Spearman correlation coefficient showed no correlations between sensitivity and specificity (r=−0.33; p>0.05). The pooled sensitivity and specificity of the studies overall were 0.89 (95% CI 0.84–0.93) and 0.96 (95% CI 0.95–0.97), respectively (Figure 2(a)). The I2 for sensitivity (90.1%) and specificity (90.6%) was more than 50%, representing a high level of inconsistency among studies. In the random effects model, the symmetric area under the curve (SAUC) of nine studies was 0.985 (Figure 2(b)). In addition, the DOR was 324.
Figure 2.

Sensitivity and specificity of studies: (a) forest plot of sensitivities and specificities of nine studies; (b) summary receiving operation characteristic curve (SROC) curve for individual studies on the accuracy of diagram primary aldosteronism (PA). AUC: area under the curve; CI: confidence interval; SE: standard error.
No evidence of publication bias was found (p=0.195), as shown in Figure 3.
Figure 3.
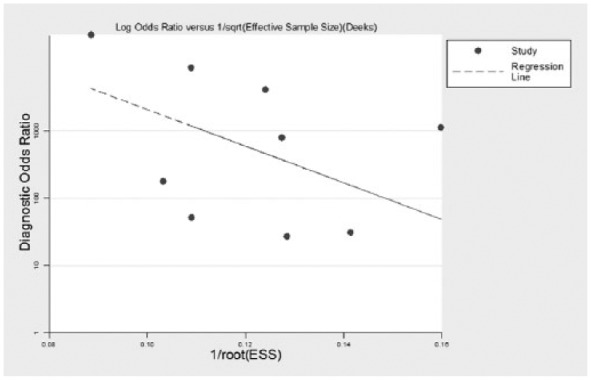
Funnel plots of publication bias in nine included studies.
ESS: effective sample size.
Meta-regression and subgroup analysis
The meta-regression analysis showed that the status of antihypertensives had a significant influence on heterogeneity (p=0.03). Five studies regarding discontinuation of antihypertensives were analyzed to evaluate the impact of discontinuing antihypertensives on the diagnostic accuracy of ADRR. The pooled sensitivity increased to 0.99 (95% CI, 0.95–1.00), while the specificity increased to 0.98 (95% CI, 0.96-0.99), respectively (Figure 4(a)). In addition, the I2 of sensitivity and specificity decreased to 32% and 81%, respectively. The SAUC showed an enhanced accuracy (SAUC=0.993). However, pooled sensitivity and specificity of the four studies where antihypertensives were not discontinued decreased to 0.73 (95% CI, 0.62–0.82) and 0.94 (95% CI, 0.90–0.96), respectively (Figure 4(b)). Six studies that set EH patients as the control group showed a pooled sensitivity of 0.83 (95% CI 0.76–0.89) and specificity of 0.94 (95% CI 0.91–0.96) (Figure 4(c)).
Figure 4.

(a) Forest plot of sensitivities and specificities of the five studies with discontinuation of antihypertensives. (b) Forest plot of sensitivities and specificities of the four studies without discontinuation of antihypertensives. (c) Forest plot of sensitivities and specificities of the six studies that set essential hypertension (EH) patients as control group. CI: confidence interval.
Discussion
The reported accuracy of ADRR in the screening of PA was inconsistent (the sensitivity ranged from 0.28–1.00 and the specificity ranged from 0.56–1.00). To the best of our knowledge, this is the first meta-analysis designed to evaluate the accuracy of ADRR in PA screening. This meta-analysis demonstrated that for PA screening, ADRR had a sensitivity of 0.89 (95% CI 0.84–0.93), a specificity of 0.96 (95% CI 0.95–0.98) and SAUC of 0.985, respectively. The diagnostic accuracy is at least comparable with previous studies where ARR was based on the PRA.16 Furthermore, the DOR of 324 also showed ADRR to be an efficient test. The quality of the studies was good according to the QUADAS-2 criteria, showing that the pooled results were valuable.
The analysis also demonstrated a massive heterogeneity, especially for sensitivity. Various reasons clarify this high degree of variability. Firstly, the cut-off of nine studies was variable and ranged from 26.35 ((ng/l)/(ng/l)) to 59.66 ((ng/l)/(ng/l)), which may be due to different populations, confirmatory criteria, and approach to cut-off decisions. Secondly, the control selection might induce heterogeneity. Regarding inclusion criteria of the control groups, one study included normotensive people whose average ADRR was lower than that of EH patients,11 which inevitably led to an overestimated diagnostic accuracy, with elevated sensitivity and specificity. As our study showed, the pooled sensitivity and specificity of the six studies that used EH patients as controls were decreased compared with the total pooled sensitivity and specificity. Thirdly, regarding the patient groups, there were several inconsistent factors such as age, gender, confirmatory test, subtype of PA, and concentration of potassium, which might also induce heterogeneity. The influence of potassium on aldosterone and vice versa cannot be ignored.22 Moreover, the potassium levels of PA subjects were low in most studies, leading to inhibition of aldosterone secretion and low PAC levels. Lastly, the status of antihypertensive drugs and blood sampling positions varied among the nine studies. Yin et al. showed that the accuracy of ARR fluctuated with the different blood sampling positions.23 Consequently, it can be easily inferred that ADRR accuracy varied with changes of blood drawing position as ARR did. However, studies on this issue are rare.
Furthermore, discontinuation of antihypertensives and cut-off selection might be possible interpretations for the outliers of the forest plots. Jansen et al. enrolled persistent hypertensive patients on several antihypertensives, and the proportion of diuretics, renin-angiotensin system blockers, and calcium channel blocker nearly reached 80% in PA and EH groups, which resulted in a relatively lower sensitivity.14 Fischer et al. selected 31.54 ((ng/l)/(ng/l)) as the cut-off, which might lead to a relatively lower specificity.15
There are some studies that discuss the effects of antihypertensives on ADRR.14,15,24–27 In theory, β-blockers lead to a significant suppression of renin and less significantly altered aldosterone, which results in an elevated ADRR. Angiotensin-converting enzyme (ACE) inhibitors and angiotensin II receptor blockers increase renin levels and decrease aldosterone concentration. It is well known that these molecules increase the ADRR, yet their effects in terms of influence on the AUC and the cut-off are still under investigation.14,24,28 In addition, it is dangerous to stop antihypertensives in PA patients who have various complications or severe hypertension. In this study, ADRR in subjects who discontinued antihypertensives had significantly increased sensitivity (0.99 vs 0.72) and specificity (0.98 vs 0.94) compared with those who continued the antihypertensives. It is highly recommended to stop antihypertensives before PA screening or at least substitute the drugs with less interfering ones as per recommendations of the screening test.
Five studies16–19,29 were excluded as they used confirmatory criteria not recommended in the guidelines.2 They showed cut-offs of 50 ((ng/l)/(ng/l)),18 90 ((ng/l)/(ng/l)),19 43.5 ((ng/l)/(ng/l)),17 19 (pg/μU) (as 30 ((ng/l)/(ng/l))),29 100 ((ng/l)/(ng/l)) in cases of blood sampling in the supine position, and 164 ((ng/l)/(ng/l)) in cases where subjects were ambulant,16 respectively. The sensitivity ranged from 0.60–1.00, whereas the specificity ranged from 0.91–1.00. The poor sensitivity of 0.60 is probably due to the continuation of antihypertensives, the inappropriate cut-off, the improper confirmatory criteria, and the incorrect measurement procedure. It should be noted that two studies combining ADRR with aldosterone concentration are more accurate,18,19 which requires further research. One study was excluded due to measurement of ADRR after the use of captopril, it showed a sensitivity of 0.75 and specificity of 0.86 under the cut-off of 35.5 (pmol/ng) (as 12.82 ((ng/l)/(ng/l))).30
This analysis has several limitations. The lack of a golden standard for PA diagnosis and consistent study design lowered the power of this study. The fact that we used the sensitivity and specificity rather than positive and negative likelihood ratios as main outcome measures is a limitation, strictly, due to the various cut-offs used. However, sensitivity and specificity are easy to understand and widely used by clinicians.
In conclusion, this meta-analysis reveals that ADRR has a sensitivity of 0.89 (95% CI 0.84–0.93) and the specificity of 0.96 (95% CI 0.95–0.98) at cut-offs ranging from 26.35 ((ng/l)/(ng/l)) to 59.66 ((ng/l)/(ng/l)). This suggests that the determination of ADRR is an effective and convenient screening tool for PA. The discontinuation of antihypertensives is necessary when using ADRR for PA screening, and further clinical investigation is required. Over all, DRC may be widely used due to its easy measurement and standardization.
Footnotes
Declaration of conflicting interests: The author(s) declared no potential conflicts of interest with respect to the research, authorship, and/or publication of this article.
Funding: The author(s) disclosed receipt of the following financial support for the research, authorship, and/or publication of this article: This research was supported by the National Key Clinical Specialties Construction Program of China, the National Natural Science Foundation of China (81370954) and The Fundamental Science and Advanced Technology Research of Chongqing (Major Project, cstc2015jcyjBX0096).
References
- 1. Conn JW. Presidential address. I. Painting background. II. Primary aldosteronism, a new clinical syndrome. J Lab Clin Med 1955; 45: 3–17. [PubMed] [Google Scholar]
- 2. Kaplan NM. Primary aldosteronism: An update on screening, diagnosis and treatment. J Hypertens 2008; 26: 1708–1709. [DOI] [PubMed] [Google Scholar]
- 3. Milliez P, Girerd X, Plouin PF, et al. Evidence for an increased rate of cardiovascular events in patients with primary aldosteronism. J Am Coll Cardiol 2005; 45: 1243–1248. [DOI] [PubMed] [Google Scholar]
- 4. Gruson D, Maisin D, Lison P, et al. Two-site automated chemiluminescent assay for measurement of immunoreactive renin. Biomarkers 2011; 16: 605–609. [DOI] [PubMed] [Google Scholar]
- 5. Morganti A and European study group for the validation of DiaSorin LDRA. A comparative study on inter and intralaboratory reproducibility of renin measurement with a conventional enzymatic method and a new chemiluminescent assay of immunoreactive renin. J Hypertens 2010; 28: 1307–1312. [DOI] [PubMed] [Google Scholar]
- 6. Dorrian CA, Toole BJ, Alvarez-Madrazo S, et al. A screening procedure for primary aldosteronism based on the Diasorin Liaison automated chemiluminescent immunoassay for direct renin. Ann Clin Biochem 2010; 47: 195–199. [DOI] [PubMed] [Google Scholar]
- 7. Balas M, Zosin I, Maser-Gluth C, et al. Indicators of mineralocorticoid excess in the evaluation of primary aldosteronism. Hypertens Res 2010; 33: 850–856. [DOI] [PubMed] [Google Scholar]
- 8. Corbin F, Douville P, Lebel M. Active renin mass concentration to determine aldosterone-to-renin ratio in screening for primary aldosteronism. Int J Nephrol Renovasc Dis 2011; 4: 115–120. [DOI] [PMC free article] [PubMed] [Google Scholar]
- 9. Diederich S, Mai K, Bahr V, et al. The simultaneous measurement of plasma-aldosterone- and -renin-concentration allows rapid classification of all disorders of the renin-aldosterone system. Exp Clin Endocrinol Diabetes 2007; 115: 433–438. [DOI] [PubMed] [Google Scholar]
- 10. Lonati C, Bassani N, Gritti A, et al. Measurement of plasma renin concentration instead of plasma renin activity decreases the positive aldosterone-to-renin ratio tests in treated patients with essential hypertension. J Hypertens 2014; 32: 627–634. [DOI] [PubMed] [Google Scholar]
- 11. Perschel FH, Schemer R, Seiler L, et al. Rapid screening test for primary hyperaldosteronism: Ratio of plasma aldosterone to renin concentration determined by fully automated chemiluminescence immunoassays. Clin Chem 2004; 50: 1650–1655. [DOI] [PubMed] [Google Scholar]
- 12. Tzanela M, Effraimidis G, Vassiliadi D, et al. The aldosterone to renin ratio in the evaluation of patients with incidentally detected adrenal masses. Endocrine 2007; 32: 136–142. [DOI] [PubMed] [Google Scholar]
- 13. Willenberg HS, Kolentini C, Quinkler M, et al. The serum sodium to urinary sodium to (serum potassium)2 to urinary potassium (SUSPPUP) ratio in patients with primary aldosteronism. Eur J Clin Invest 2009; 39: 43–50. [DOI] [PubMed] [Google Scholar]
- 14. Jansen PM, van den Born BJ, Frenkel WJ, et al. Test characteristics of the aldosterone-to-renin ratio as a screening test for primary aldosteronism. J Hypertens 2014; 32: 115–126. [DOI] [PubMed] [Google Scholar]
- 15. Fischer E, Beuschlein F, Bidlingmaier M, et al. Commentary on the Endocrine Society Practice Guidelines: Consequences of adjustment of antihypertensive medication in screening of primary aldosteronism. Rev Endocr Metab Disord 2011; 12: 43–48. [DOI] [PubMed] [Google Scholar]
- 16. Glinicki P, Jeske W, Bednarek-Papierska L, et al. The ratios of aldosterone / plasma renin activity (ARR) versus aldosterone/direct renin concentration (ADRR). J Renin Angiotensin Aldosterone Syst 2015; 16: 1298–1305. [DOI] [PubMed] [Google Scholar]
- 17. Rossi GP, Barisa M, Belfiore A, et al. The aldosterone-renin ratio based on the plasma renin activity and the direct renin assay for diagnosing aldosterone-producing adenoma. J Hypertens 2010; 28: 1892–1899. [DOI] [PubMed] [Google Scholar]
- 18. Trenkel S, Seifarth C, Schobel H, et al. Ratio of serum aldosterone to plasma renin concentration in essential hypertension and primary aldosteronism. Exp Clin Endocrinol Diabetes 2002; 110: 80–85. [DOI] [PubMed] [Google Scholar]
- 19. Unger N, Lopez Schmidt I, Pitt C, et al. Comparison of active renin concentration and plasma renin activity for the diagnosis of primary hyperaldosteronism in patients with an adrenal mass. Eur J Endocrinol 2004; 150: 517–523. [DOI] [PubMed] [Google Scholar]
- 20. Whiting P, Rutjes AW, Reitsma JB, et al. The development of QUADAS: A tool for the quality assessment of studies of diagnostic accuracy included in systematic reviews. BMC Med Res Methodol 2003, 10: 25. [DOI] [PMC free article] [PubMed] [Google Scholar]
- 21. Deeks JJ, Macaskill P, Irwig L. The performance of tests of publication bias and other sample size effects in systematic reviews of diagnostic test accuracy was assessed. J Clin Epidemiol 2005; 58: 882–893. [DOI] [PubMed] [Google Scholar]
- 22. Tanabe A, Naruse M, Takagi S, et al. Variability in the renin/aldosterone profile under random and standardized sampling conditions in primary aldosteronism. J Clin Endocrinol Metab 2003; 88: 2489–2494. [DOI] [PubMed] [Google Scholar]
- 23. Yin G, Zhang S, Yan L, et al. One-hour upright posture is an ideal position for serum aldosterone concentration and plasma renin activity measuring on primary aldosteronism screening. Exp Clin Endocrinol Diabetes 2012; 120: 388–394. [DOI] [PubMed] [Google Scholar]
- 24. Gallay BJ, Ahmad S, Xu L, et al. Screening for primary aldosteronism without discontinuing hypertensive medications: Plasma aldosterone-renin ratio. Am J Kidney Dis 2001; 37: 699–705. [DOI] [PubMed] [Google Scholar]
- 25. Seifarth C, Trenkel S, Schobel H, et al. Influence of antihypertensive medication on aldosterone and renin concentration in the differential diagnosis of essential hypertension and primary aldosteronism. Clin Endocrinol (Oxf) 2002; 57: 457–465. [DOI] [PubMed] [Google Scholar]
- 26. Ahmed AH, Gordon RD, Taylor P, et al. Effect of atenolol on aldosterone/renin ratio calculated by both plasma Renin activity and direct Renin concentration in healthy male volunteers. J Clin Endocrinol Metab 2010; 95: 3201–3206. [DOI] [PubMed] [Google Scholar]
- 27. Stowasser M, Ahmed AH, Pimenta E, et al. Factors affecting the aldosterone/renin ratio. Horm Metab Res 2012; 44: 170–176. [DOI] [PubMed] [Google Scholar]
- 28. Niizuma S, Nakahama H, Kamide K, et al. The cutoff value of aldosterone-to-renin ratio for the diagnosis of primary aldosteronism in patients taking antihypertensive medicine. Clin Exp Hypertens 2008; 30: 640–647. [DOI] [PubMed] [Google Scholar]
- 29. Barigou M, Ah-Kang F, Orloff E, et al. Effect of postural changes on aldosterone to plasma renin ratio in patients with suspected secondary hypertension. Ann Cardiol Angeiol (Paris) 2015; 64: 169–174. [DOI] [PubMed] [Google Scholar]
- 30. Wu VC, Kuo CC, Chang HW, et al. Diagnosis of primary aldosteronism: Comparison of post-captopril active renin concentration and plasma renin activity. Clin Chim Acta 2010; 411: 657–663. [DOI] [PubMed] [Google Scholar]