Figure 4.
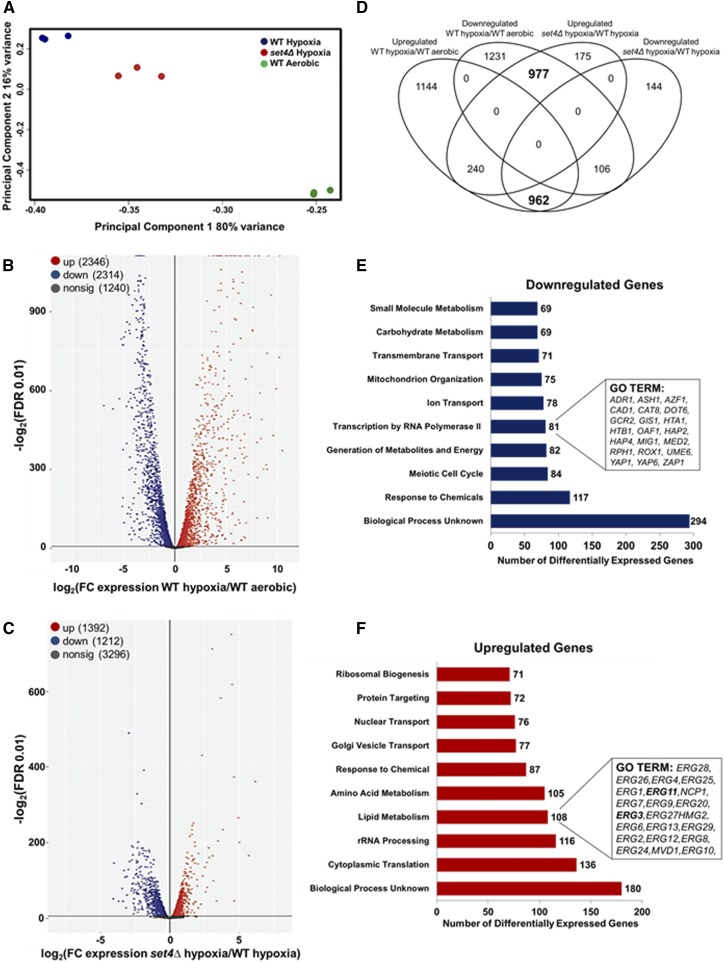
Set4 alters global levels of gene expression under hypoxic conditions. The genome-wide changes in gene expression under hypoxia were performed using BY4741 WT and set4Δ strains. (A) The PCA for WT and set4Δ hypoxic samples relative to WT aerobic samples based on the counts per million. (B) Volcano plot showing the significance [−log2 (FDR), y-axis] vs. the fold change (x-axis) of the DEGs identified in the WT hypoxic samples relative to WT aerobic samples. (C) Volcano plot showing the significance [−log2 (FDR), y-axis] vs. the fold change (x-axis) of the DEGs identified in the set4Δ hypoxic samples relative to WT hypoxic samples. Genes with significant differential expression (FDR < 0.01) in (B and C) are highlighted in red or blue for up- and downregulated genes, respectively. Gray highlighted genes are considered nonsignificant. (D) Venn diagram showing the number of genes identified as differentially expressed (FDR < 0.01). Bold numbers indicate a high overlap of genes predicted to be in common by chance based on Fisher’s exact test (P < 10−52). (E and F) GO terms of the Set4-dependent DEGs under hypoxic conditions. Downregulated genes refer to the DEGs that are dependent on Set4 for activation and the upregulated genes refer to the DEGs that are dependent on Set4 for repression. Significantly enriched groups of GO terms were identified for the DEGs from set4Δ and WT hypoxic samples. Bar plots show the number of DEGs in each GO group that are dependent on Set4 under hypoxia. The number of genes in each GO group is shown to the right of each bar. Genes identified are shown in the inset boxes.

