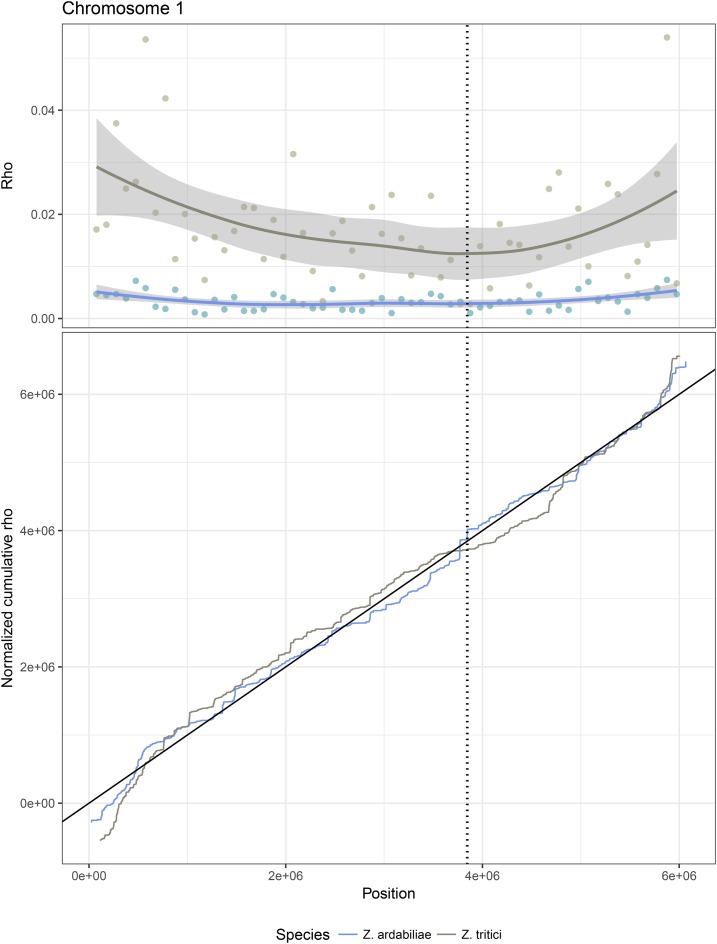
Figure 6.
Recombination maps of Z. tritici and Z. ardabiliae plotted along the chromosome 1 of Z. tritici. (Upper panel) Recombination map in 100-kb windows plotted together with smoothing curves. (Lower panel) Cumulative curves of the recombination maps, scaled to be comparable. The position of the centromere is marked over the chromosome plots as a vertical stippled line. Figures for other chromosomes are available in File S2.

