Abstract
Control of many infectious diseases relies on the detection of clinical cases and the isolation, removal or treatment of cases and their contacts. The success of such ‘reactive’ strategies is influenced by the fraction of transmission occurring before symptoms appear. We performed experimental studies of foot-and-mouth disease transmission in cattle and estimated this fraction at less than half the value expected from detecting virus in body fluids, the standard proxy measure of infectiousness. This is because the infectious period is shorter (mean 1.7 days) than currently realised and animals are not infectious until, on average, 0.5 days after clinical signs appear. These results imply that controversial pre-emptive control measures may be unnecessary; instead, efforts should be directed at early detection of infection and rapid intervention.
Strategies to control the spread of many infectious diseases rely wholly or partly on reactive measures implemented upon the detection of a clinical case. Examples include human influenza, diphtheria, pertussis, pneumonic plague, SARS and viral haemorrhagic fevers, as well as major animal diseases such as classical swine fever, foot-and-mouth disease, highly pathogenic avian influenza and swine vesicular disease (1). For these diseases, once a clinical case is detected, the affected individual may be treated or isolated or (for livestock diseases) culled with the aim of limiting opportunities for further transmission. In some circumstances, prophylaxis, quarantine or culling of at-risk individuals (usually those in close physical proximity to a case or identified by contact tracing) is also implemented. Such measures are often contentious (2, 3) and are defended on the grounds of their perceived contribution to reducing transmission rates and so protecting public or animal health.
The success of reactive disease control strategies has previously been shown to depend on the timing of the onset of infectiousness relative to the onset of detectable clinical symptoms (4). The key variable is θ, the fraction of transmission that occurs during the overlap of the incubation period (time from exposure to onset of symptoms) and the infectious period. If θ is small then reactive control targeted only at clinical cases may be effective. For moderate values of θ (or for low values of θ if there is a significant delay implementing control measures) additionally targeting at-risk individuals may be warranted. However, if θ is too large, i.e. most transmission occurs before disease is apparent (e.g., HIV/AIDS), reactive control measures will be ineffective. Three successful disease eradication campaigns – smallpox, SARS and rinderpest – were facilitated by low θ values (4, 5).
The means and distributions of incubation, latent and infectious periods are key determinants of θ and have been estimated for many infectious diseases (e.g., 6–9), but the value of θ also depends on their joint distributions, which are less well studied. Here, we report how we quantified these distributions for foot-and-mouth disease (FMD) in cattle and assess the implications of the results for the design of control strategies. We go on to consider the relevance of the findings to other infectious diseases.
Foot-and-mouth disease virus (FMDV) is a RNA virus of the Picornaviridae family (a group containing a number of animal and human pathogens) that naturally infects cattle and other livestock species, causing an acute illness characterized by fever, nasal discharge and lesions on the tongue and/or feet. It is one of the world’s most important animal pathogens, responsible for huge global losses to livestock production and trade, as well as frequent and highly disruptive large-scale epidemics (10).
We carried out an experimental study of direct transmission of FMDV between pairs of animals kept indoors in close proximity for 8 hours, with room temperature, humidity and air circulation optimised, during pilot studies, for transmission to occur. Briefly, eight ‘source’ cows were successfully exposed to infection by direct contact with cattle injected with the FMDV serotype O isolate circulating in the UK in 2001 and transmissions to naïve cows were attempted at 2 day intervals post exposure (11). This design allowed us to study individual transmission events occurring at specific time points following exposure, in contrast to previous studies that estimated net FMDV transmission rates for small groups of animals in contact for extended periods (12, 13).
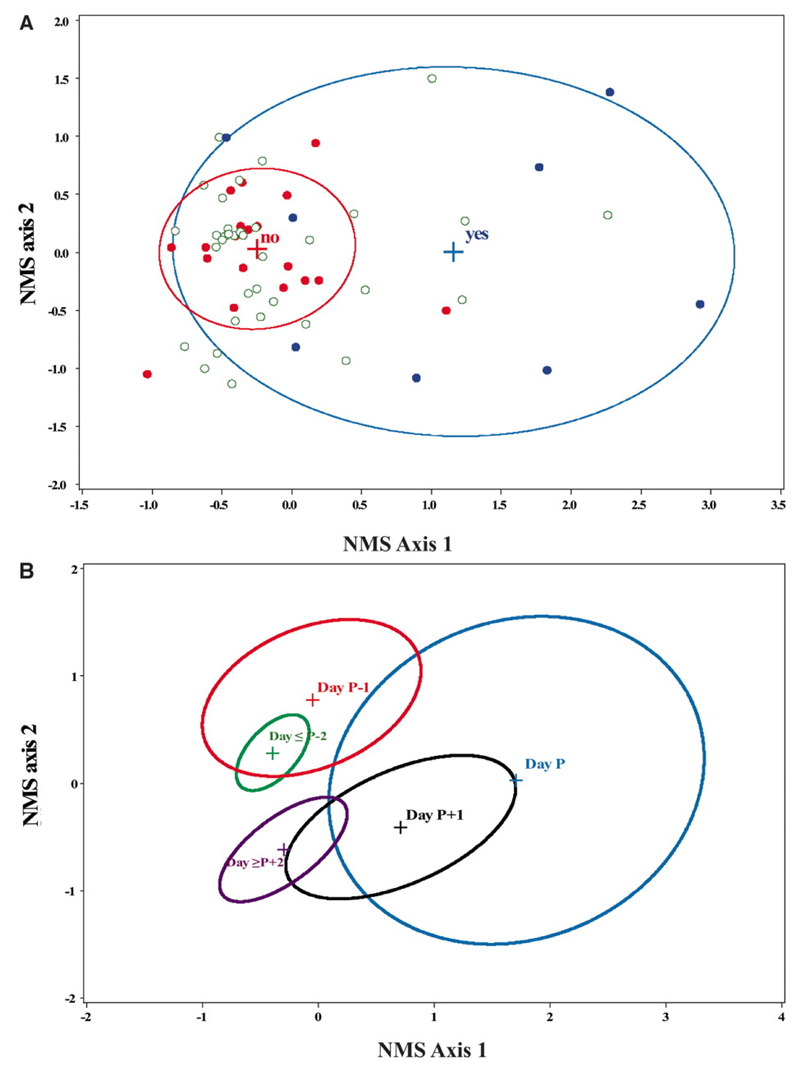
There were only 8 successful transmissions (from 7 of the cows) in 28 attempts even though we detected FMDV in blood (i.e., viraemia), nasal fluid (NF) and/or oesophageal-pharyngeal fluid (OPF) on all but one occasion (Table S1). We quantified a set of 23 virological, immunological and clinical variables for each of the source cows (Table S2). From these, we created composite variables using the data reduction method non-metric multi-dimensional scaling (NMS) (11). NMS score was strongly associated with infectiousness (p=0.0002; see Figure 1A and Table S3). Moreover, NMS axis 1 and 2 together provided an informative representation of the sequence of events that occur during FMDV infection and, crucially, how these relate to infectiousness (Figure 1B). We depict these in relation to a reference time point, Day P, which corresponds to the day of peak NMS axis 1 score for each infected cow. There is an initial quiescent phase lasting 1-4 days; previous studies suggest the variation is due to differences in the infectious dose received (14). Day P-1 is marked by the first appearance of high levels of viraemia. On Day P there is a rapid cascade of events including the detection of live virus in nasal fluid and the onset of clinical signs and a type-I interferon response, all of which are heavily weighted components of NMS axis 1 (Fig S1). On Day P+1 there is a decrease in the amount of detectable virus as a sharp peak in the level of type-1 interferon prevents virus from infecting additional epithelial cells where most replication occurs (15), although some clinical signs persist. From Day P+2 onwards only low levels of virus and interferon are detectable, but FMDV-specific antibodies are present. Six out of eight successful transmissions occurred on Day P, a highly significant association (exact p=0.0064). These results suggest that conditions promoting transmission exist for only a brief period and clearly show that infectiousness is a complex phenomenon related not just to virus dynamics but also to host responses and clinical signs, consistent with a general, but rarely tested, expectation that disease symptoms may be functionally linked to infectiousness (16).
Figure 1.
Nonmetric multidimensional scaling (NMS) ordination of transmission data. The NMS final solution was two dimensional and explained 86.1% of the variation in FMD transmission success. Correlations between variables used (see Table S2) and NMS scores are shown in Fig. S1. (A) Blue circles represent days when transmission occurred, red circles when no transmission occurred and green open circles when transmission was not attempted. Ellipses indicate the mean ±1 standard deviation bivariate interval for successful and unsuccessful transmission attempts only. (B) Ellipses indicate the mean ±1 standard deviation bivariate interval for each day, where Day P is the day of peak NMS axis 1 score. Days ≥P+2 and ≤P-2 have been grouped.
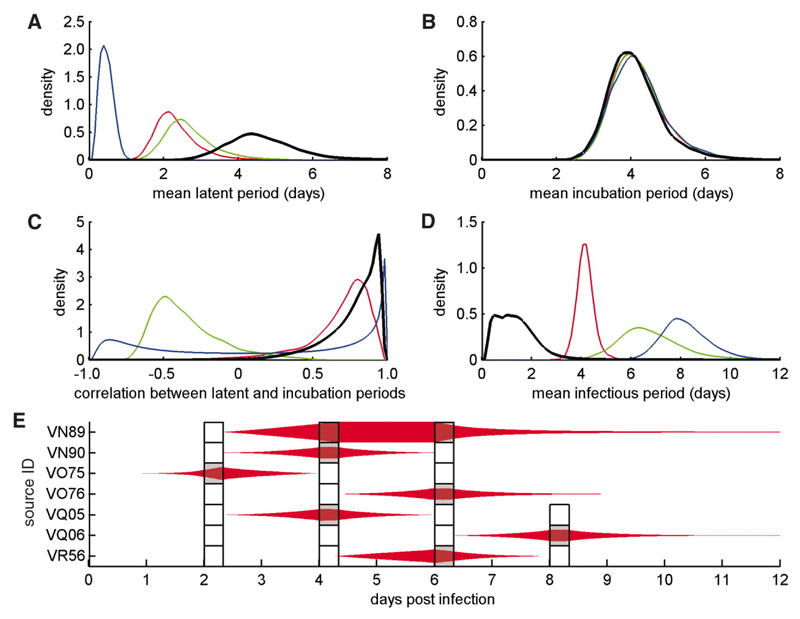
The experimental data allowed us to make formal estimates of the infectious period, the latent period and the incubation period; clinical signs were defined here as any visible lesions or body temperature above 39.5°C. We did this using a Bayesian framework which allowed us to draw inferences about the unobserved latent and infectious periods based on the outcome of each transmission attempt. The mean latent and incubation periods were estimated to be 4.6 days (95% credible interval (CI): 3.1-7.2 days) and 4.1 days (2.9-5.9 days) respectively (Figures 2A and 2B). Importantly, these variables were significantly correlated (correlation coefficient, ρ = 0.77, 95% CI: 0.30-0.96) (Figure 2C) and the mean infectious period was short: 1.7 days (0.3-4.8 days) (Figure 2D). Both these results are consistent with the NMS analysis. The statistical model was a good description of the transmission data (Figure 2E).
Figure 2.
Bayesian analysis of FMDV transmission data. (A-D) Marginal posterior densities for the mean duration (in days) of the (A) latent and (B) incubation periods, (C) the correlation between the latent and incubation periods, and (D) the infectious period. Results for the analysis based on transmission attempt outcome only (black lines) were compared with results for virus isolation from nasal fluid (NF) (green lines), blood (red lines) or oesophageal-pharyngeal fluid (OPF) (blue lines). There were significant (p<0.05) differences for latent period (blood and OPF), latent period minus incubation period (blood and OPF), their correlation (NF), and infectious period (NF, blood and OPF). (E) Posterior estimates for the (unobserved) latent and infectious periods in relation to the experimental transmission attempts (indicated by boxes marked grey if the attempt was successful and white if it was not). The thickness of the red shapes indicates the proportion of Markov chain Monte Carlo samples for which an animal was infectious at that time (with the symbol occupying the full width of the box if it was infectious for all samples). Cow VR57 was excluded from these analyses as, though infected, it was apparently never infectious.
Previous estimates of the latent and infectious periods for FMDV have used indicators such as the detection of virus in blood, NF or OPF as proxy measures of infectiousness (13), rather than directly demonstrating transmission to another animal. Using these measures from our experimental data gave significantly shorter estimates of the mean latent period (0.5-2.7 days; Figure 2A), and much longer estimates of the mean infectious period (4.2-8.2 days; Figure 2D). These estimates are very similar to the results of a recently published meta-analysis of data on FMDV serotype O in cattle (17). Additionally, when we used proxy measures of infectiousness, the latent period appeared longer than the incubation period (whereas the transmission data suggested it was shorter; cf. Figures 2A and 2B) and the correlation between latent and incubation periods was weaker or entirely absent (Figure 2C). We note that similar proxies for infectiousness are routinely used in studies of not just FMDV but many other human and animal pathogens (e.g., 6–8).
Extending previous analyses (4) to allow for jointly distributed latent and incubation periods, the proportion of transmission occurring before the onset of clinical signs is given by
| (1) |
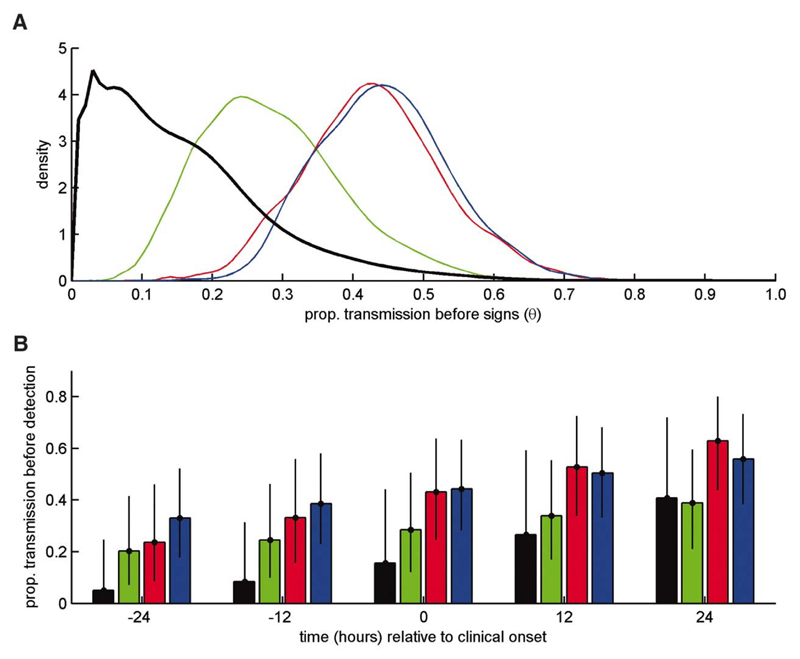
where f(E,C) is the joint probability distribution function (PDF) for the latent and incubation periods, fE(E) is the marginal PDF for the latent period and g(I) is the PDF for the infectious period (see (11) for derivation of this expression). As shown in Figure 3A, with parameters based on virus isolation in blood, NF or OPF, the median estimate of θ was 0.43, 0.27 or 0.44 respectively (see Figure 3A for PDFs), with the possibility that a cow could be infectious for several days before showing clinical signs. Using a direct measure of infectiousness the median estimate of θ was only 0.13 (Figure 3A) and an animal that was infectious before clinical onset would most likely be so for only a few hours.
Figure 3.
Implications of results for detection and control of FMDV. (A) Marginal posterior density for the proportion of transmission that occurs before the onset of clinical signs, θ. (B) Posterior means (bars) and 95% credible intervals (error bars) for the proportion of transmission that occurs before detection assuming infected animals are detected at -24, -12, 0, +12 or +24 hrs relative to the onset of clinical signs. In each plot results are shown for the analysis based on transmission attempt outcome only (black) and virus isolation from nasal fluid (green), blood (red) or oesophageal-pharyngeal fluid (blue).
Sensitivity analysis of Equation (1) indicates that the effects reported here for FMD could potentially apply to any acute infectious disease (11). The crucial factor is whether the variance of the timing of the onset of infectiousness relative to symptoms is large in comparison to the infectious period. For human influenza, for example, the value of θ has been reported as 0.3 to 0.5 (4), yet several authors have suggested, based on observational data, that it could be much lower (8, 9, 18). Resolving this debate for influenza or any other acute infection will require experimental and/or epidemiological studies of transmission in natural hosts designed to quantify transmission rates at different times post exposure.
In summary, the combined effect of the differences between our findings and previous work based on proxy measures of infectiousness is that cattle infected with FMDV are substantially less likely to be infectious before showing clinical signs than is currently realised, implying that the need for reactive control measures targeted at “at-risk” farms, notably pre-emptive culling (19), has been over-estimated. Importantly, the likelihood of transmission is dramatically decreased if control can be implemented just 24 hrs earlier, noting that this effect is greatly underestimated if proxy measures of infectiousness are used (Figure 3B). This result provides strong support for investment in the development of practical tools for pre-clinical diagnosis (20, 21), noting that the onset of detectable viraemia typically occurs at ≥1 day before infected cows become infectious and/or show clinical signs (Figure 1B, Table S1). The same argument also suggests that the penalties for delayed detection of cases and/or implementation of control are even greater than is currently realised (Figure 3B). Also, for the future, our results suggest that prophylaxis, such as antiviral therapy, targeted at contacts could be used pre-clinically with greater confidence of preventing transmission. Finally, we suggest that there is a need for more robust empirical evidence on relationships between clinical symptoms and infectiousness to underpin policy, not only for FMDV but also other acute infections where reactive measures are an important component of control strategies.
Supplementary Material
One sentence summary.
Experimental studies of transmission of foot-and-mouth disease in cattle demonstrate a need to re-appraise reactive control strategies for acute infectious diseases.
References and Notes
- 1.See WHO Factsheets, http://www.who.int/mediacentre/factsheets/en/ (accessed 01/10/10) and OIE Animal diseases data, http://www.oie.int/eng/maladies/entech_cards.htm (accessed 04/10/10)
- 2.Zinsstag J, Weiss MG. Science. 2001;294:477. doi: 10.1126/science.294.5542.477. [DOI] [PubMed] [Google Scholar]
- 3.Tracey CS, Rea E, Upshur REG. BMC Public Health. 2009;9:470. doi: 10.1186/1471-2458-9-470. [DOI] [PMC free article] [PubMed] [Google Scholar]
- 4.Fraser C, Riley S, Anderson RM, Ferguson NM. Proc Natl Acad Sci U S A. 2004;101:6146. doi: 10.1073/pnas.0307506101. [DOI] [PMC free article] [PubMed] [Google Scholar]
- 5.Scott GR. Rinderpest and Peste des Petits Ruminants In: Virus Diseases of Food Animals. In: Gibbes EPJ, editor. Vol. 2 Academic Press; MO, USA: 1981. [Google Scholar]
- 6.Lipsitch M, et al. Science. 2003;300:1966. doi: 10.1126/science.1086616. [DOI] [PMC free article] [PubMed] [Google Scholar]
- 7.Carrat F, et al. Am J Epidemiol. 2008;167:775. doi: 10.1093/aje/kwm375. [DOI] [PubMed] [Google Scholar]
- 8.Lau LLH, et al. J Infect Dis. 2010;201:1509. doi: 10.1086/652241. [DOI] [PMC free article] [PubMed] [Google Scholar]
- 9.Yamagishi T, et al. Jpn J Infect Dis. 2010;63:327. [PubMed] [Google Scholar]
- 10.Paton DJ, King DP, Knowles NJ, Hammond J. Vet Rec. 2010;166:569. doi: 10.1136/vr.c2300. [DOI] [PubMed] [Google Scholar]
- 11.Materials and methods are available as supporting material on Science Online.
- 12.Orsel K, Bouma A, Dekker A, Stegeman JA, de Jong MCM. Prev Vet Med. 2009;88:158. doi: 10.1016/j.prevetmed.2008.09.001. [DOI] [PubMed] [Google Scholar]
- 13.Orsel K, de Jong MCM, Bouma A, Stegeman JA. Vaccine. 2007;25:327. doi: 10.1016/j.vaccine.2006.07.030. [DOI] [PubMed] [Google Scholar]
- 14.Howey R, Quan M, Savill NJ, Matthews L, Alexandersen S, Woolhouse M. J R Soc Interface. 2009;6:835. doi: 10.1098/rsif.2008.0434. [DOI] [PMC free article] [PubMed] [Google Scholar]
- 15.Chinsangaram J, Piccone ME, Grubman MJ. J Virol. 1999;73:9891. doi: 10.1128/jvi.73.12.9891-9898.1999. [DOI] [PMC free article] [PubMed] [Google Scholar]
- 16.Williams GC, Nesse RC. The dawn of Darwinian medicine. Quart Rev Biol. 1991;66:1. doi: 10.1086/417048. [DOI] [PubMed] [Google Scholar]
- 17.Mardones FO, Perez A, Sanchez J, Alkhamis M, Carpenter TE. Vet Res. 2010;41:45. doi: 10.1051/vetres/2010017. [DOI] [PMC free article] [PubMed] [Google Scholar]
- 18.Patrozou E, Mermel LA. Public Health Rep. 2009;124:193. doi: 10.1177/003335490912400205. [DOI] [PMC free article] [PubMed] [Google Scholar]
- 19.Tildesley MJ, Bessell PR, Keeling MJ, Woolhouse MEJ. Proc R Soc London Ser B. 2009;276:3239. doi: 10.1098/rspb.2009.0427. [DOI] [PMC free article] [PubMed] [Google Scholar]
- 20.King DA, Peckham C, Waage JK, Brownlie J, Woolhouse MEJ. Science. 2006;313:1392. doi: 10.1126/science.1129134. [DOI] [PubMed] [Google Scholar]
- 21.Paton DJ, Sumption KJ, Charleston B. Philos Trans R Soc London Ser B. 2009;27:2657. doi: 10.1098/rstb.2009.0100. [DOI] [PMC free article] [PubMed] [Google Scholar]
- 22.We thank Luke Fitzpatrick, Colin Randal and Mark Jenkins for their assistance with the handling and management of experimental animals, Pip Hamblin and Phil Keel for help and advice with serology assays, Liz Reid, Miriam Windsor and Sarah Cox for assistance with laboratory assays, Soren Alexandersen, David Paton and Nick Savill for valuable advice on study design and Bryan Grenfell, Matt Keeling, Mart de Jong, Andrea Graham, Chris Dye and four anonymous referees for insightful comments. The work was funded by the Biotechnology and Biological Sciences Research Council (grant ref. BBSB00549), U.K. B. C. and P. V. B. are Jenner Investigators. S. G. and D. S. acknowledge funding from the Biotechnology and Biological Sciences Research Council (grant ref BBSEI00001444). M. E. C. T. is partly supported by the Wellcome Trust.
Associated Data
This section collects any data citations, data availability statements, or supplementary materials included in this article.


