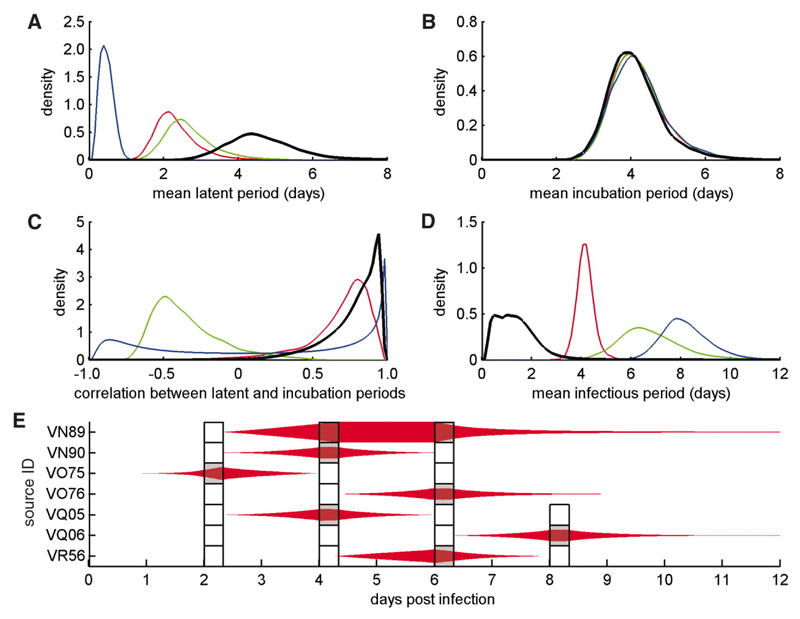
Figure 2.
Bayesian analysis of FMDV transmission data. (A-D) Marginal posterior densities for the mean duration (in days) of the (A) latent and (B) incubation periods, (C) the correlation between the latent and incubation periods, and (D) the infectious period. Results for the analysis based on transmission attempt outcome only (black lines) were compared with results for virus isolation from nasal fluid (NF) (green lines), blood (red lines) or oesophageal-pharyngeal fluid (OPF) (blue lines). There were significant (p<0.05) differences for latent period (blood and OPF), latent period minus incubation period (blood and OPF), their correlation (NF), and infectious period (NF, blood and OPF). (E) Posterior estimates for the (unobserved) latent and infectious periods in relation to the experimental transmission attempts (indicated by boxes marked grey if the attempt was successful and white if it was not). The thickness of the red shapes indicates the proportion of Markov chain Monte Carlo samples for which an animal was infectious at that time (with the symbol occupying the full width of the box if it was infectious for all samples). Cow VR57 was excluded from these analyses as, though infected, it was apparently never infectious.

